
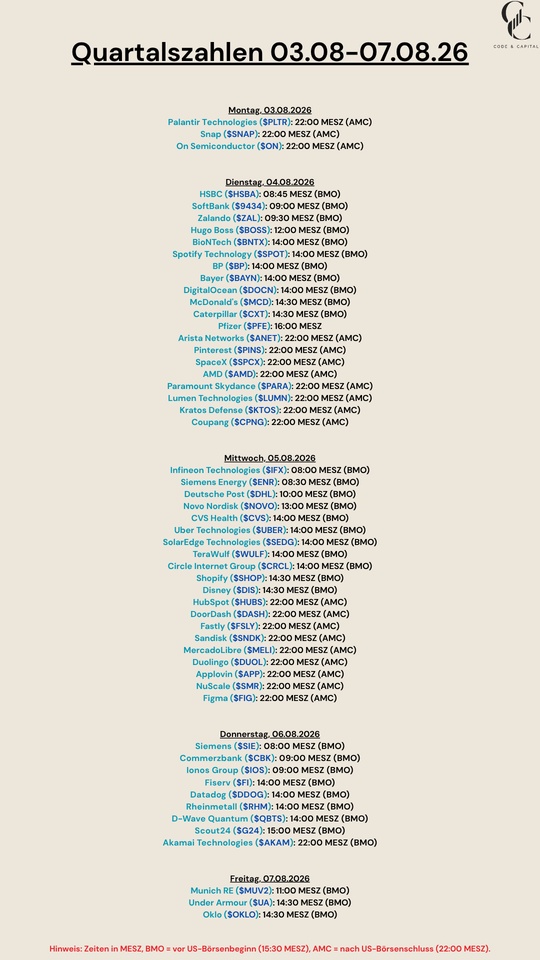
$PLTR (+5,04%)
$SNAP (+2,93%)
$HSBA (-1,11%)
$9434 (+1,06%)
$ZAL (+3,16%)
$BOSS (+0,92%)
$BNTX (+2,27%)
$SPOT (-2,01%)
$BP. (-0,7%)
$BAYN (-1,86%)
$DOCN (+1,66%)
$MCD (+0,56%)
$CAT (-0,55%)
$PFE (-0,07%)
$ANET (+3,76%)
$PINS (+1,79%)
$SPCX (+1,14%)
$AMD (+2,2%)
$PARA (-2,68%)
$LUMN (-3,38%)
$KTOS (-2,37%)
$CPNG (+1,15%)
$IFX (+1,27%)
$ENR (-0,79%)
$DHL (-1,98%)
$NOVO B (-0,41%)
$CVS (+0,18%)
$UBER (+0,46%)
$SEDG (-2,51%)
$WULF (+4,04%)
$CRCL (-0,61%)
$SHOP (+1,47%)
$DIS (-0,45%)
$HUBS (+0,97%)
$DASH (+2,33%)
$FSLY (+2,76%)
$SNDK (+6,06%)
$MELI (+0,31%)
$DUOL
$APP (+1,15%)
$SMR
$FIG (+0,94%)
$SIE (-0,85%)
$CBK (-2,16%)
$IOS (+2,54%)
$FI (+0,83%)
$DDOG (+6,48%)
$RHM (-2,77%)
$QBTS (-0,12%)
$G24 (-0,22%)
$AKAM (-0,01%)
$MUV2 (-0,55%)
$UA (+0,07%)
$OKLO

Figma, Inc. Class A
Ação
Ação
Ticker: FIG
FIG
Price
Discussão sobre FIG
Postos
112Mês·
Quarterly Results August 3–7, 2026
1313
5Mês·
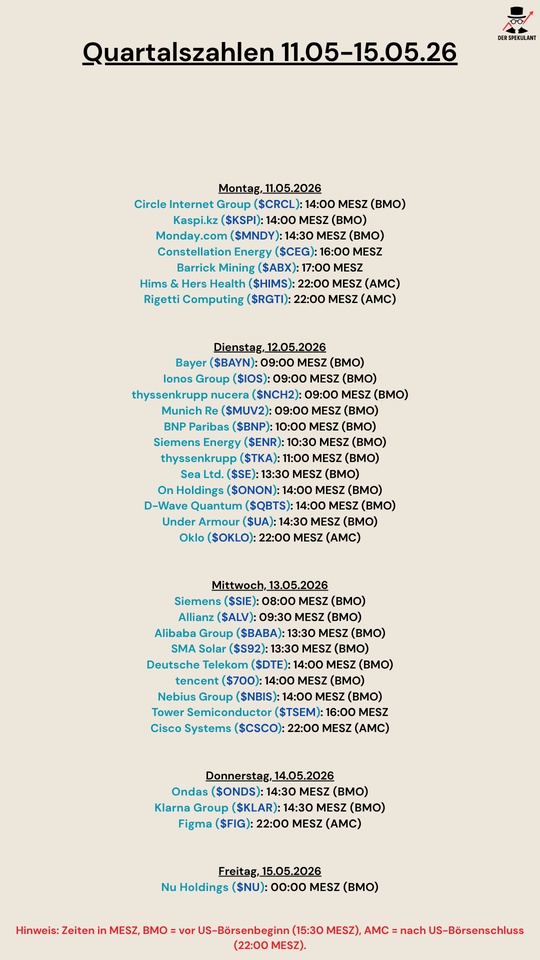
Quarterly figures 11.05-15.05.26
$CRCL (-0,61%)
$KSPI (-0,72%)
$MNDY (+4,22%)
$CEG (-2,91%)
$ABX (-0,21%)
$HIMS (+1,36%)
$RGTI (-0,48%)
$BAYN (-1,86%)
$NCH2 (-1,57%)
$IOS (+2,54%)
$MUV2 (-0,55%)
$BNP (-2,4%)
$ENR (-0,79%)
$TKA (-1,92%)
$SE (-4,8%)
$ONON (+1,68%)
$QBTS (-0,12%)
$UA (+0,07%)
$OKLO
$SIE (-0,85%)
$ALV (-1,45%)
$BABA (-0,26%)
$S92 (-2,71%)
$DTE (-1,14%)
$700 (-0,78%)
$NBIS (+0,53%)
$CSCO (+0,1%)
$ONDS (+1,21%)
$KLAR (+0,86%)
$FIG (+0,94%)
$NU (-0,25%)
1212
3 Comentários
Sebbster@Sebbster
5Mês
•
66
•Mostrar resposta
8Mês·
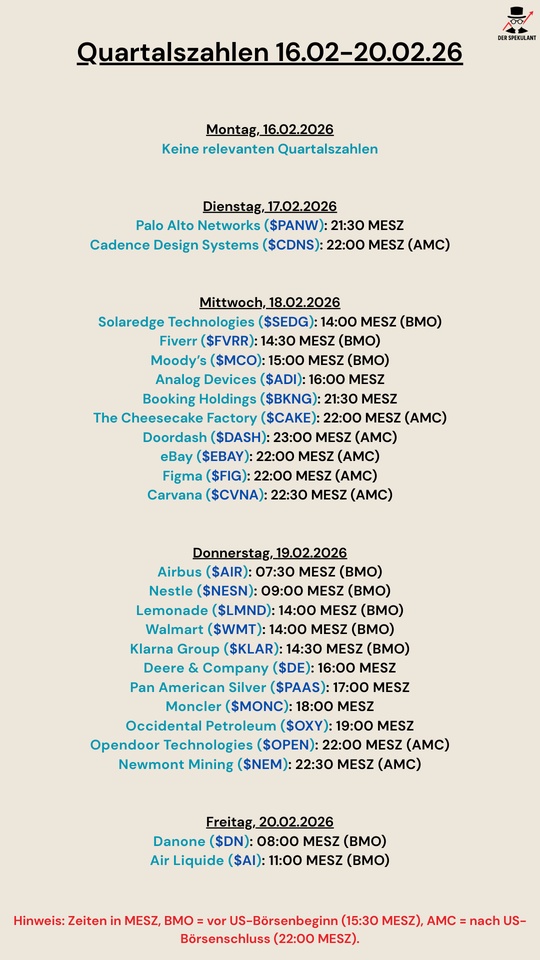
Quarterly figures 16.02-20.02.26
$PANW (+1,91%)
$CDNS (+1,62%)
$SEDG (-2,51%)
$FVRR (+0,46%)
$MCO (-0,7%)
$ADI (+0,05%)
$BKNG (-0,28%)
$CAKE (+0,88%)
$DASH (+2,33%)
$EBAY (+0,74%)
$FIG (+0,94%)
$CVNA (-0,86%)
$AIR (-1,83%)
$NESN (+0,37%)
$LMND (-1,78%)
$WMT (+0,58%)
$KLAR (+0,86%)
$DE (-1,79%)
$PAAS (+1,69%)
$MONC (-1,3%)
$OXY (+1,24%)
$OPEN (-1,98%)
$NEM (+0,48%)
$BN (-1,21%)
$AI (+0,17%)


11Mês·
Figma Q3’25 Earnings Highlights
🔹 Revenue: $274.2M (Est. $263.9M) 🟢; +38% YoY
🔹 GAAP Loss/Share: -$2.72 (Est. -$1.58) 🔴 (includes one-time IPO SBC charge)
🔹 Paid Customers >$100K ARR: 1,262; +140 added in Q3
🔹 Net Dollar Retention (>$10K ARR): 131%
Guidance
🔹 Q4 Revenue: $292M–$294M (Est. $281M) 🟢
🔹 FY25 Revenue: $1.044B–$1.046B (Prior: $1.02B–$1.03B) 🟢
🔹 FY25 Non-GAAP Operating Income: $112M–$117M
Other Metrics
🔹 Non-GAAP Operating Income: $34M; 12% margin
🔹 Non-GAAP Net Income: $62.4M
🔹 Revenue run-rate > $1B
🔹 Free Cash Flow: $49M; 18% margin
🔹 Cash & Marketable Securities: $1.6B
CEO Commentary
🔸 “Q3 was the best quarter in Figma’s history… AI investments are driving adoption.” – CEO Dylan Field
33
11Mês·
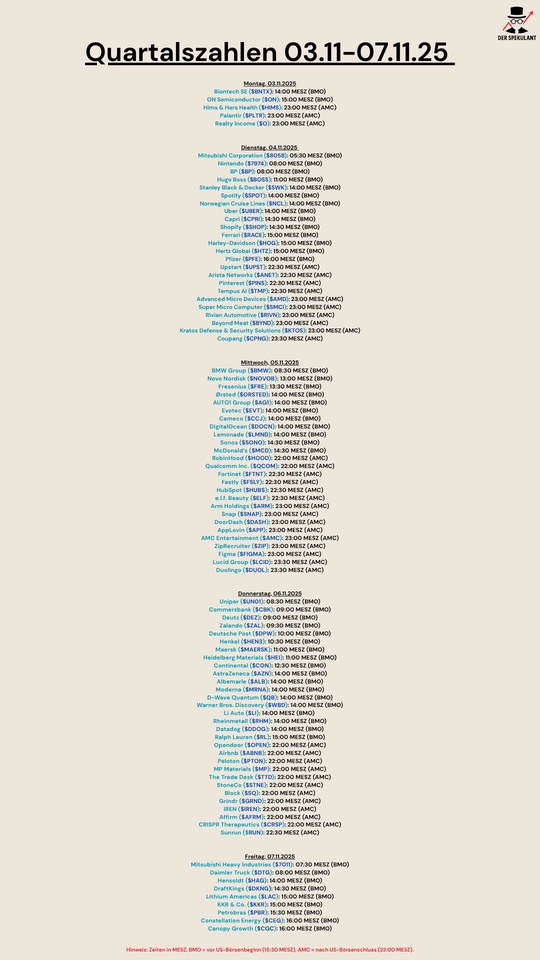
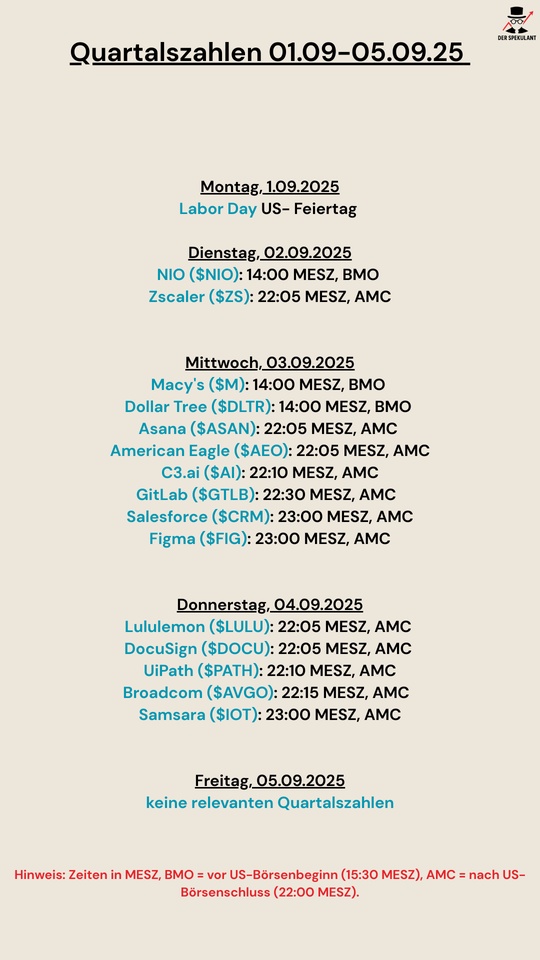
Quartalszahlen 03.11.25-07.11.15
$BNTX (+2,27%)
$ON (+0,96%)
$HIMS (+1,36%)
$PLTR (+5,04%)
$O (-0,84%)
$8058 (+0,68%)
$7974 (+1,24%)
$BP. (-0,7%)
$BOSS (+0,92%)
$SWK (-0,45%)
$SPOT (-2,01%)
$N1CL34
$UBER (+0,46%)
$CPRI (+0,7%)
$SHOP (+1,47%)
$RACE (-0,54%)
$HOG (-0,65%)
$HTZ (+0,9%)
$PFIZER
$UPST (-2,22%)
$ANET (+3,76%)
$PINS (+1,79%)
$TEM (-1,11%)
$AMD (+2,2%)
$SMCI (+1,78%)
$RIVN (-1,03%)
$BYND (-2,67%)
$KTOS (-2,37%)
$CPNG (+1,15%)
$BMW (+0%)
$NOVO B (-0,41%)
$FRE (-0,31%)
$ORSTED (-2,21%)
$AG1 (-1,8%)
$EVT (+2,35%)
$CCO (-0,52%)
$DOCN (+1,66%)
$LMND (-1,78%)
$SONO (-2,19%)
$MCD (+0,56%)
$HOOD (-1,85%)
$QCOM (+1,38%)
$FTNT (+2,17%)
$FSLY (+2,76%)
$HUBS (+0,97%)
$ELF (+1,54%)
$ARM (+0,98%)
$SNAP (+2,93%)
$DASH (+2,33%)
$APP (+1,15%)
$AMC (+4,26%)
$ZIP (+1,12%)
$FIG (+0,94%)
$LCID (-1,78%)
$DUOL
$UN0 (-1,77%)
$CBK (-2,16%)
$DEZ (-1,62%)
$ZAL (+3,16%)
$HEN (-0,59%)
$MAERSK A (+0,26%)
$HEI (+0,71%)
$CON (-1,64%)
$AZN (-0,24%)
$ALB (-0,11%)
$MRNA (+4,71%)
$QBTS (-0,12%)
$WBD
$LI (-0,69%)
$RHM (-2,77%)
$DDOG (+6,48%)
$RL (-0,66%)
$OPEN (-1,98%)
$ABNB (+1,3%)
$PTON (+0,97%)
$MP (-2,03%)
$TTD (-0,37%)
$STNE (+1,62%)
$SQ (+0,22%)
$GRND (-1,59%)
$IREN (+2,88%)
$AFRM (-1,76%)
$CRISP
$RUN (-4,41%)
$7011 (-0,47%)
$DTG (-1,9%)
$HAG (-0,68%)
$DKNG (+5,07%)
$LAC (-2,88%)
$KKR (+1,33%)
$PETR3 (+0,66%)
$CEG
$WEED (-1,09%)
88
1Ano·
Figma Q2’25 Earnings Highlights:
🔹 Revenue: $249.6M (Est. $248.7M) 😐; UP +41% YoY
🔹 EPS: $0.00 (Est. $0.08) 🔴
Business Metrics
🔹 Net Dollar Retention Rate: 129% (for >$10k ARR customers)
🔹 Paid Customers >$10k ARR: 11,906
🔹 Paid Customers >$100k ARR: 1,119
🔹 >80% of customers use 2+ products; ~⅔ use 3+ products
Q3 Guidance
🔹 Revenue: $263M–$265M; UP +33% YoY
FY25 Guidance
🔹 Revenue: $1.021B–$1.025B; UP +37% YoY
🔹 Adj. Operating Income: $88M–$98M
Product & Growth Updates
🔹 Launched 4 products: Figma Make (AI prototyping), Figma Draw, Figma Sites, Figma Buzz
🔹 Released Dev Mode MCP server for LLM-integrated workflows
🔹 Hosted annual Config conference, boosting customer engagement
🔹 Closed acquisitions of Modyfi (motion/animation tools) & Payload (headless CMS)
Other Metrics:
🔹 Operating Income: $2.1M; Operating Margin: 1%
🔹 Adj. Operating Income: $11.5M; Margin: 5%
🔹 Net Income: $28.2M; Adj. Net Income: $19.8M
🔹 Operating Cash Flow: $62.5M; Margin: 25%
🔹 Adj. Free Cash Flow: $60.6M; Margin: 24%
🔹 Cash & Investments: $1.6B
CEO Commentary
🔸 Dylan Field: “We delivered record revenue in Q2 as we continued to innovate with the launch of four new products. Design is more important than ever, and we have so much more to build.”
🔸 CFO Praveer Melwani: “We delivered best-in-class revenue growth and positive operating margin, while investing in AI and expanding our platform.”
88

1Ano·
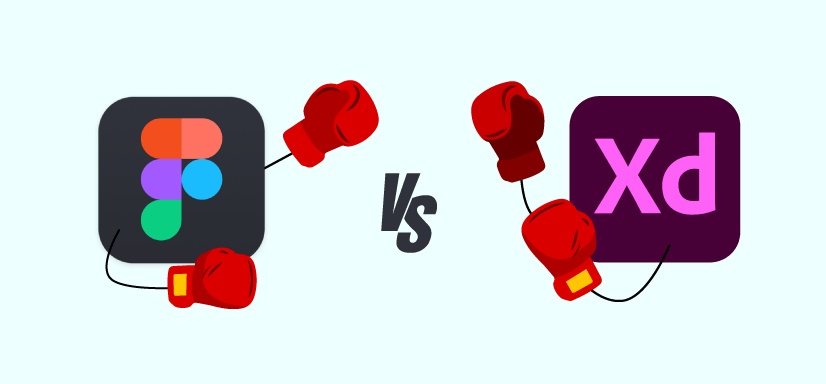
Sep 2 / Adobe vs. Figma - Who Wins Creative Software?
Adobe – The Old King at Risk
“Adobe is still the undisputed heavyweight of creative software.” Valid statement? For now. Adobe controls a massive slice of the design market: Photoshop around 42% share, InDesign 26%, Illustrator 12%. Together, that’s dominance built over decades, embedded deep into companies and workflows.
But that doesn’t mean invincibility. Growth is slowing, subscription prices look absurd, and the product experience feels increasingly outdated compared to new players. Meanwhile, AI is shaking the entire industry — and Adobe risks falling behind if it doesn’t integrate fast.
Yes, the stock looks cheap (Forward P/E ~20, near historic lows) and the business model is sticky. But moats don’t last forever if customers start fleeing to sharper, cheaper, or more collaborative competitors. Adobe is still a force — but it looks like an aging one.
Figma – The Challenger Eating Market Share
Figma isn’t just another tool, it’s a different way of working: browser-native, collaborative, and viral. Teams adopt it before management even notices. The clearest proof of its threat? Adobe’s failed $20B acquisition attempt. If the king wants to buy you, it’s because he knows you’re dangerous.
And Figma didn’t just IPO — it exploded. The stock started trading more than 4x its $33 IPO price, before cooling back to a ~$32B market cap. That’s still a hell of a lot higher than what Adobe would’ve paid. The risk? Valuation. Forward EV/Sales around 32 is nosebleed territory. Not quite Palantir-insanity, but definitely in that neighborhood.
Still, Figma is where the next generation of designers are building muscle memory. Once you’ve won mindshare, revenue follows. And Adobe knows this — which is why they tried (and failed) to buy the problem away. Unfortunately, thanks to European bureaucrats, the deal died. I mean who doesn’t appreciate the work of these geniuses? How could we ever have two companies perfectly complementing each other merge? No, no, no. That would clearly harm competition.
My Take
Both companies are impressive in their own ways, but I own neither. Adobe feels safe but slow. Figma feels disruptive but extremely expensive. If I had to bet, I’d lean Adobe — because Figma has a long way to fall, while Adobe’s downside is partly priced in. But either way, I’m watching from the sidelines.
44

1Ano·
The most “expensive” software stocks based on EV/NTM Revenue
- $PLTR (+5,04%) : 77x 🤯
- $NET (+1,27%) : 31x
- $FIG (+0,94%) : 30x
- $CRWD (+0,98%) : 30x
- $SNOW (+3,47%) : 16x
- $SHOP (+1,47%) : 15x
- $GWRE (+2,6%) / $ZS (+3,65%) : 14x
- $NOW (+2,88%) : 13x
➡️ The premium investors pay for growth is massive in some names.
22


1Ano·
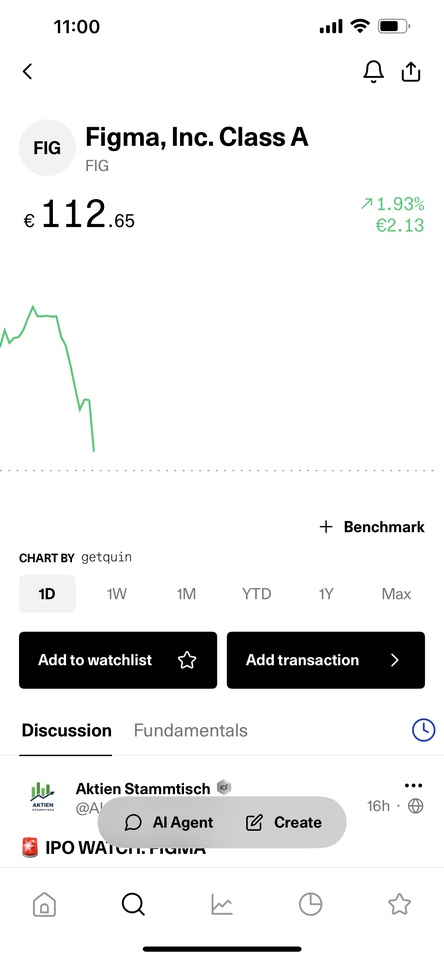
Why is everyone celebrating the Figma IPO as a success? 🤔
This morning I see a lot of praise for the Figma IPO in various media ($FIG (+0,94%) ) - a plus of +200 % on the first day of trading on Wall Street.
For me, however, this is an obvious sign of mispricing. mispricingand here's why:
- The company raised far less capital than it could have.
- Instead, the increase in value was siphoned off by hedge funds and institutional investors who were allocated early at a lower price (which is often the case - but there should be some balance).
- Retail investors paid a (high) premium at the start of trading and bought at inflated prices, while early investors were already cashing in.
In my opinion, what is missing from the reporting and discussion is the role of the accompanying banks (underwriters). By setting a low price:
- Can the banks easily place all the shares - with minimal risk,
- Their investors receive an attractive offer,
- And the IPO is considered a "success".
The result is already visible: the share price is now declining significantly.
1414
5 Comentários
1Ano
All the points you mentioned are typical for IPOs 🤷🏻♂️ The same could be said for CRCL.
•
22
•Títulos em alta
Principais criadores desta semana
Dados tempo real da LSX · Dados financeiros e EOD da FactSet