
Palantir Tech
Price
Discussão sobre PLTR
Postos
785



Palantir Falls 5.5% to $168.41 in Pre-Market Trading Following Earnings Report:
$PLTR (-1,93%)
Revenue growth accelerates to 96%, but the sharp decline in new contract volume raises questions about the 2027 pipeline
⠀
The key takeaway: The quarter was exceptionally strong in terms of revenue, margins, and cash flow. The problem lies with bookings. Palantir is nearly doubling its revenue, while total contract value is growing by only 6%. It is precisely this gap between current growth and future deal dynamics that is concerning the market.
⠀
Average price target: $232
Potential from the current price of $168.41: ~38%
⠀
Current analyst estimates:
• Rosenblatt: Buy, $260 (unchanged) (+54%)
• Baird: Outperform, $250 (unchanged) (+48%)
• Truist: Buy, $250 (up from $233) (+48%)
• UBS: Buy, $250 (unchanged) (+48%)
• Mizuho: Outperform, $245 (unchanged) (+45%)
• Goldman Sachs: Buy, $235 (unchanged) (+40%)
• Piper Sandler: Overweight, $235 from $231 (+40%)
• Morgan Stanley: Equalweight, $233 from $205 (+38%)
• RBC: Underperform, $130 from $90 (-23%)
⠀
What stood out as exceptionally strong:
• Revenue of $2.31 billion, +96% YoY vs. ~$2.18 billion expected
• Adjusted EPS of $0.44 vs. $0.41 consensus
• U.S. Commercial revenue +148% YoY to $984 million
• U.S. Government revenue up 96% to $953 million
• U.S. Commercial surpasses U.S. Government for the first time in company history
• Adjusted operating margin reached 61.7%
• Free cash flow was approximately $1.2 billion, more than 50% of revenue
• FY26 revenue guidance raised to approximately $8.53 billion, representing about 91% growth
⠀
Why the stock is still falling:
• Total Contract Value grew only 6% year-over-year vs. 49% in Q2
• U.S. Commercial TCV up only 11% vs. 153% in the prior quarter
• Growth in remaining deal value slowed significantly
• RPO remained roughly unchanged sequentially
• Customer growth also slowed
• With a P/E ratio of around 155x, the market demands perfect leading indicators, not just another revenue beat
⠀
The key question: Is the weakness in bookings real, or is it primarily a result of shorter contract terms?
⠀
Palantir argues that Sovereign AI customers are increasingly starting with shorter contracts to deploy quickly and prove value. Contracts under twelve months are not fully captured in RPO, while shorter terms also depress TCV.
⠀
Why the bulls are looking past this: Annualized U.S. commercial revenue per customer reached approximately $5.7 million, about 90% more than the previous year. Palantir also pointed to pilot projects whose annual contract value increased by a factor of 5 to 15 after launch. Small entry-level contracts can therefore very quickly turn into significantly larger production contracts.
⠀
The Bull Case: Revenue has now been accelerating for 13 consecutive quarters, U.S. Commercial is growing at 148%, the operating margin is over 60%, and management continues to raise its guidance. Goldman, Mizuho, UBS, and Truist remain bullish because hardly any other software company combines this level of growth with this level of profitability.
⠀
The Bear Case: The valuation leaves little room for a genuine slowdown. If the weak TCV is not just a timing issue but actually points to weaker enterprise bookings, the gap between 96% revenue growth and 6% contract value growth will be hard to ignore.
⠀
Conclusion: Palantir did not disappoint with its latest numbers. The market is concerned about the metrics that look beyond the current quarter. For the stock, much now depends on whether the weak TCV merely reflects shorter-term Sovereign AI contracts or is the first real indication that bookings are no longer keeping pace with the exceptional revenue growth.

However, 13F filings are up to 45 days old; Q3 filings are due by November 16.
Who did what: https://www.convictionscore.de/aktie/PLTR?utm_source=getquin&utm_medium=social&utm_campaign=pltr-kommentar

Palantir Stock Forecast & Price Targets for 2026: Record Numbers, Yet a Sell-Off!
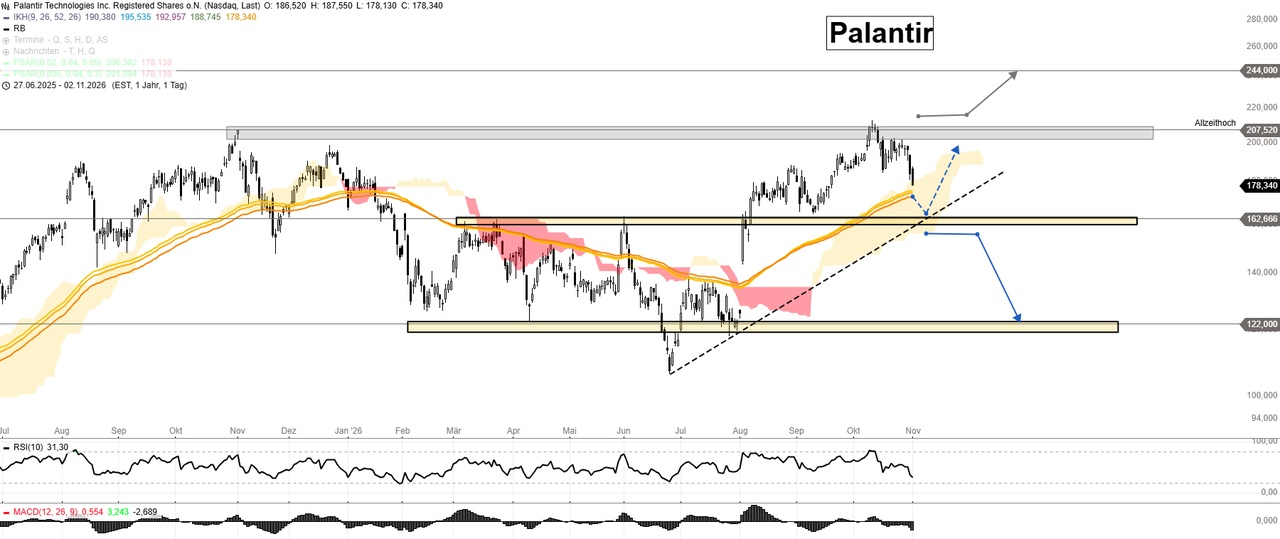
In the third quarter of 2026, Palantir delivered everything investors wanted to see—and yet the stock is still falling. Revenue jumped 96% to $2.313 billion, well above the consensus estimate of around $2.17 to $2.18 billion. Adjusted earnings per share came in at $0.44 instead of the expected $0.41, and for the first time in the company’s history, revenue from U.S. corporate clients surpassed revenue from the U.S. government. Palantir raised its full-year forecast again, to a range of $8.530 to $8.534 billion. The market nevertheless reacted with profit-taking: The stock closed on November 2, 2026, at $178.34 (−3.1%) and slipped to around $171.52 in after-hours trading. The triggers are believed to be the significantly weaker growth in new contract values and the extremely high valuation. From a technical analysis perspective, this brings the support zone around $162.65 into focus.
Key Points
- Q3 2026 revenue: $2.313 billion (+96%), consensus around $2.17–2.18 billion
- Adjusted EPS: $0.44 (consensus: $0.41), net income $1.128 billion
- U.S. business customers: $984 million (+148%) – surpassing the U.S. government for the first time ($953 million)
- Adjusted operating margin: 62%, Rule of 40 at 158%
- 2026 full-year guidance raised: $8.530–8.534 billion (+91%), Q4: $2.649–2.653 billion
- Stock price reaction: Closed at $178.34 (−3.1%), after-hours trading at approx. $171.52 (−3.8%)
- Warning sign: Total Contract Value (TCV) up only +6%; +11% in the U.S. business customer segment
- Key levels: Support at $162.65, resistance at $200–$207.52, support level at $122
What are Palantir’s current key metrics?
Palantir stock closed at $178.34 on the Nasdaq on November 2, 2026, after Palantir reported a 96% jump in revenue to $2.313 billion for the third quarter. Key metrics (as of November 3, 2026):
- Price (Nasdaq: PLTR): $178.34 (close on November 2, 2026), after-hours trading at approximately $171.52
- All-time high / 52-week high: $212.94 (October 2026), 52-week low: $106.37 (June 2026)
- Revenue Q3 2026: $2.313 billion (+96%), total U.S. revenue: $1.937 billion (+119%)
- EPS (adjusted): $0.44, net income (GAAP): $1.128 billion (margin 49%)
- Adjusted operating margin: 62% (previous year: 51%), Rule of 40: 158%
- Adjusted free cash flow for Q3: $1.216 billion (margin 53%)
- Cash and U.S. Treasury bonds: $10.4 billion (as of September 30, 2026)
- Total Contract Value (TCV): $2.918 billion (+6%)
- Remaining U.S. Business Customer Contract Value (RDV): $6.517 billion (+79%)
- 2026 Revenue Forecast: $8.530–8.534 billion (+91%, previously $8.15–8.16 billion)
- 2026 Adjusted Free Cash Flow Forecast: $4.8–5.0 billion
- Dividend: none
- WKN / ISIN: A2QA4J / US69608A1088
- Next quarterly results (Q4): expected in early February 2027
What news is currently driving Palantir stock?
Palantir stock is currently being driven primarily by the record third-quarter results announced on November 2, 2026—and the surprising sell-off that followed despite expectations being clearly exceeded.
- November 2, 2026 – Revenue exceeds $2 billion for the first time: +96% to $2.313 billion, adjusted EPS $0.44 instead of $0.41 (very bullish)
- November 2, 2026 – The company surpasses the government for the first time: U.S. business customers $984 million (+148%) vs. U.S. government $953 million (bullish)
- November 2, 2026 – Full-year forecast raised again to $8.530–8.534 billion (bullish)
- November 2, 2026 – Sell-off despite record figures: TCV up only 6%, U.S. business customer TCV up 11% after over 150% in the previous quarter, high valuation (bearish)
- Oct. 29, 2026 – JPMorgan initiates coverage with an “Overweight” rating and a price target of $262 (bullish)
- Oct. 27, 2026 – Rosenblatt reaffirms Buy and raises price target to $260 (bullish)
- Oct. 15, 2026 – Mizuho reaffirms Outperform, raises price target from $215 to $245 (bullish)
- Mid-Oct. 2026 – New all-time high at $212.94, followed by a correction of about 16% (neutral)
- Oct. 8, 2026 – Goldman Sachs upgrades from Neutral to Buy, price target $230 (bullish)
What does Palantir do—and how does the company make its money?
Palantir makes its money through software platforms that aggregate massive amounts of data and use artificial intelligence to translate it into concrete decisions—for governments as well as for corporations. Palantir Technologies Inc. was founded in 2003 by Peter Thiel and Alex Karp, among others, and is traded on the Nasdaq.
The four platforms:
- Gotham: An analytics and operations platform for the military, intelligence agencies, and government agencies
- Foundry: The enterprise data operating system that connects production, supply chains, and finance on a shared data foundation (ontology)
- AIP (Artificial Intelligence Platform): Integrates language models directly into customers’ workflows and is the key growth driver
- Apollo: Manages software deployment and updates in cloud, government, and edge environments
Here is the breakdown of revenue for the third quarter of 2026:
- U.S. business customers: $984 million (+148%) – the largest segment for the first time
- U.S. government: $953 million (+96%)
- International business: approximately $376 million
- Total: $2.313 billion, of which $1.937 billion was in the U.S. (+119%)
Palantir primarily sells its software through multi-year contracts and subscriptions. The company acquires new customers through initiatives such as AIP boot camps, where companies can build their own AI applications using their own data in just a few days.
Sovereign AI—the new growth engine: CEO Alex Karp sees Palantir at the center of a movement he calls “Sovereign AI”: governments and companies want to control their own AI systems rather than relying entirely on third-party models. According to Karp, demand currently exceeds Palantir’s capacity to meet it. The remaining contract value (RCV) in the U.S. enterprise segment rose to $6.517 billion (+79%); and during the quarter, Palantir signed 212 contracts worth at least $1 million and 64 contracts worth at least $10 million. For months now, the stock market has demonstrated just how much excitement a bulging order backlog can spark Rheinmetall Aktie —but the same rule applies here as there: The market will only pay top prices as long as order growth keeps pace with revenue growth.
Fundamental Analysis: Is Palantir Stock Overvalued After a Record Quarter?
Measured by traditional metrics, Palantir stock is extremely expensive—but in terms of growth and profitability, it is virtually unrivaled in the software sector.
Valuation Comparison: Based on adjusted earnings over the past twelve months, Palantir is valued at about 150 times earnings—a multiple typical of software stocks. In terms of revenue, investors are paying about 50 times the $8.53 billion expected for 2026. Even after a decline of about 16% from its all-time high, Palantir remains one of the most expensive large-cap stocks in the world. Just how closely investors now focus on order books rather than just revenue when it comes to software stocks was recently demonstrated by SAP Aktie, which surged in after-hours trading following a 26% increase in its cloud order backlog—with Palantir, we’re currently seeing the exact opposite.
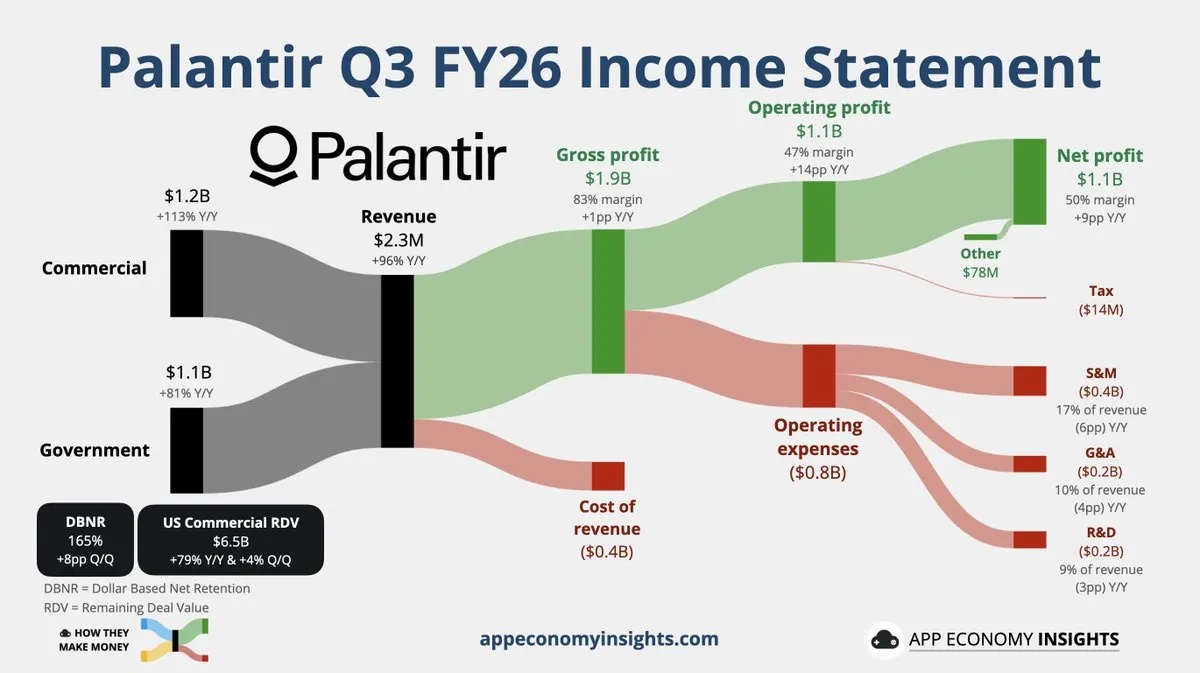
Margin Performance: The adjusted operating margin rose from 51% in the same quarter last year to 62%, while the GAAP operating margin increased from 33% to 47%. Net income (GAAP) climbed from $475.6 million to $1.128 billion, and the gross margin stands at around 83%. Together, this results in a Rule of 40 ratio of 158%—a figure that hardly any other publicly traded software company achieves.
Balance Sheet and Cash Flow: Palantir has no financial debt and holds $10.4 billion in cash and U.S. Treasury bonds. Adjusted free cash flow for the quarter was $1.216 billion (margin of 53%); management expects $4.8 to $5.0 billion for the full year. Two points, however, deserve attention: Stock-based compensation totaled $319 million (just under 14% of revenue), and accounts receivable rose by about 81% since the beginning of the year to $1.88 billion.
Segments and Order Intake: The U.S. business customer segment is growing the fastest at 148% and is projected to generate more than $3.559 billion in revenue by 2026 (+143%). The catch lies in order intake: Total contract value (TCV) rose by only 6% to $2.918 billion, and in the U.S. business customer segment by 11% to $1.463 billion—down from more than 150% in the previous quarter. CFO David Glazer pointed out, among other things, that some major contracts have shorter terms because customers are initially starting with their first Sovereign AI applications.
Conclusion of the fundamental analysis: Operationally, Palantir is delivering results that are unprecedented on this scale. However, the valuation leaves no room for disappointment—and that is precisely why the stock reacts with price declines even to minor weaknesses such as slowing order growth.
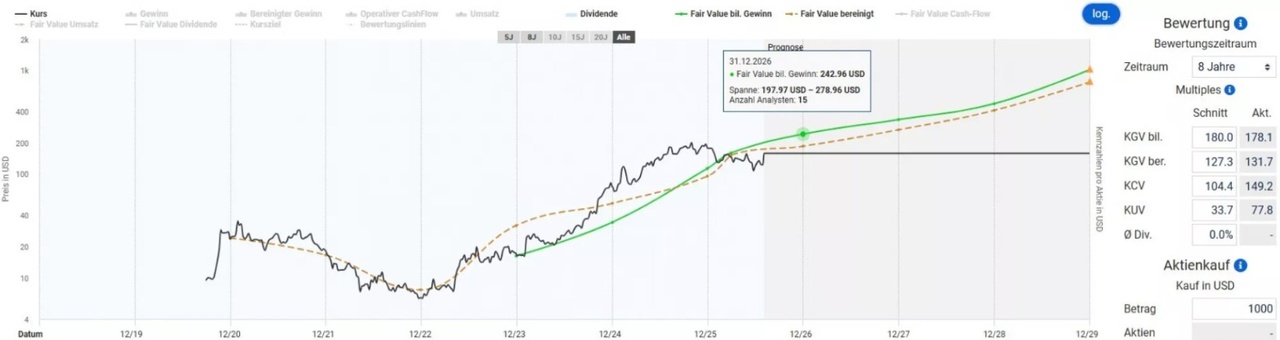
Fair Value Calculation for Palantir Stock (PLTR) 2026 – Source: Aktienfinder / Christian Lill
Palantir Stock Price Targets and Forecast for 2026
Analysts’ price targets for Palantir stock average around $211 to $221, which is about 18% to 24% above the closing price of $178.34. The highest targets come from JPMorgan ($262) and Rosenblatt ($260). The forecast based on the chart is more cautious: In the short term, the focus is initially on the support level around $162.65, from which a new push toward $200 becomes possible.
Since hitting an all-time high of $212.94 in mid-October, the stock has lost about 16%. Anyone who has experienced how brutally the D-Wave Quantum Aktie market has been shaken out following periods of euphoria knows that, at such valuations, chart levels—not headlines—are what matter.
Key price levels:
- 52-week high: $212.94 (also all-time intraday high, October 2026)
- Current price: $178.34 (Nasdaq close on Nov. 2, 2026), after-hours trading: approx. $171.52
- First resistance level: approx. $184 (closing price on October 30, 2026: $184.11)
- Second resistance: $200 to $207.52 (record range)
- Support: approx. $162.65 plus rising trend line
- Critical downside level: closing prices below $160; next support level at $122
Analyst price targets:
- Average price target: approx. $211 to $221 (FMP consensus $210.75, TipRanks $221.27)
- JPMorgan: Overweight, $262 (October 29, 2026)
- Rosenblatt: Buy, $260 (October 27, 2026)
- Mizuho: Outperform, $245 (October 15, 2026)
- Goldman Sachs: Buy, $230 (October 8, 2026)
- Price target revisions following the Q3 earnings report were not yet available as of the morning of November 3, 2026
Chart Analysis:
Strong results are being sold off—this is precisely the picture painted by Palantir stock following its record quarter. After reaching an all-time high in October, the price has turned downward from the narrow range between $200 and $207.52 and is now approaching the next major support level. The RSI(10), at around 31, is already close to the oversold zone.
At around $162.65, a rebound toward $200 could occur. That is where the support zone marked in yellow—formed by the highs from March and June 2026—and the rising trend line since the annual low in June converge—an area where, based on experience, buyers tend to return. I currently consider this scenario (blue dashed arrow) the most likely.
A sustained breakout above the previous record high should trigger follow-on buying up to $244. However, I initially view this scenario (gray arrow) as less likely, since for that to happen, the stock would first have to reclaim the entire resistance zone between $200 and $207.52.
Downward pressure could intensify if we fall below $160. In that case, $122 would be an important, relevant support level—that’s where the lower yellow support zone runs, which was tested multiple times in the spring and summer of 2026 (blue arrow).
Palantir Stock Chart Analysis and Price Targets for 2026 – Source: Stock3 / Christian Lill – November 3, 2026, PLTR
Conclusion: Palantir Stock After the Sell-Off – Opportunity or Trap?
My Assessment: Buy
Palantir is delivering operational results like few other companies: 96% revenue growth, a 62% adjusted operating margin, a full-year forecast raised once again, and—for the first time—more revenue from U.S. companies than from the U.S. government. Nevertheless, the current trend in the stock market is that strong numbers are being sold off. Weak growth in new contract value and a valuation of around 150 times adjusted earnings are enough to trigger significant profit-taking.
From a technical analysis perspective, the situation is clearly defined. Around $162.65, a rebound toward $200 could occur—where the support zone and the rising trend line converge. A sustained breakout above the previous record high should trigger follow-on buying up to $244, though I consider that unlikely for now. If, on the other hand, the stock falls below $160, downward pressure could intensify, and $122 would be the next key support level.
For investors, this means: Those who believe in the Sovereign AI story should closely monitor the area around $162.65 instead of chasing the price. Just how far actual earnings and market speculation can diverge is particularly evident in the Tesla Aktie, where declining earnings are met with strong merger speculation—with Palantir, it’s exactly the opposite, and the $160 mark will determine the next chapter.
✅ Opportunities
- Revenue up 96% to $2.313 billion—exceeding $2 billion for the first time in a quarter
- U.S. enterprise customers up 148%—exceeding U.S. government business for the first time
- Full-year guidance raised to $8.530–8.534 billion (+91%)
- Adjusted operating margin 62%, Rule of 40 at 158%
- $10.4 billion in cash and government bonds, no financial debt
- Analyst targets up to $262 (JPMorgan) – about 47% above the closing price
⚠️ Risks
- Total Contract Value (TCV) up only +6%, U.S. business customer TCV up +11%
- Valuation at approximately 150 times adjusted earnings
- Q4 forecast implies only about 15% growth quarter-over-quarter, following 20% in Q3
- Stock-based compensation of $319 million for the quarter (just under 14% of revenue)
- Receivables have risen by about 81% since the start of the year to $1.88 billion
- Below $160, there is a risk of increased downward pressure toward $122
Sources
- Palantir Q3 2026 Press Release (Form 8-K, SEC, Nov. 2, 2026)
- Palantir Investor Relations
- Investing.com: Palantir Q3 2026 Earnings Call Transcript
- TipRanks: Stock Price Reaction and Consensus Following Q3 Results (November 3, 2026)
- Coinpaper: After-hours stock price reaction (November 3, 2026)
- CNBC: Rosenblatt Raises Price Target to $260 (October 27, 2026)
- Teleborsa: JPMorgan Initiates Coverage with an “Overweight” Rating and a $262 Price Target (October 29, 2026)
- TheFly/TipRanks: Mizuho raises price target to $245 (October 15, 2026)
- FX Leaders: Goldman Sachs rates the stock as “Buy” with a price target of $230 (October 8, 2026)
- Price data: Alpha Vantage, Financial Modeling Prep (Nasdaq closing prices)
- Fundamental data and charts: Aktienfinder · Charts: Stock3
This is not investment advice—all information is provided solely for financial education purposes.
What are your current thoughts on $PLTR (-1,93%)?


1. International business continues to lag far behind strong U.S. growth.
2. There was a decline in newly signed contract volume, meaning Palantir is fulfilling existing orders faster than new ones are coming in. This is a trend that should be monitored closely, as it could otherwise lead to a major disappointment down the road.
𝐏𝐚𝐥𝐚𝐧𝐭𝐢𝐫: 𝐐𝟑 𝐄𝐚𝐫𝐧𝐢𝐧𝐠𝐬 𝐚𝐧𝐝 𝐑𝐞𝐯𝐞𝐧𝐮𝐞 𝐁𝐞𝐚𝐭 𝐄𝐬𝐭𝐢𝐦𝐚𝐭𝐞𝐬, 𝐔.𝐒. 𝐂𝐨𝐦𝐦𝐞𝐫𝐜𝐢𝐚𝐥 𝐆𝐫𝐨𝐰𝐭𝐡 𝐒𝐮𝐫𝐠
⠀
📊 𝐑𝐞𝐬𝐮𝐥𝐭𝐬
• Adj. EPS: $0.44 (Est. $0.41) ✅.
• Revenue: $2.313B (Est. $2.18B) ✅, +96% YoY.
• GAAP EPS: $0.44.
• GAAP Operating Income: $1.085B, 47% margin.
• Adj. Operating Income: $1.427B, 62% margin.
• Adj. EBITDA: $1.434B, 62% margin.
• Adj. Free Cash Flow: $1.216B, 53% margin.
• Rule of 40 Score: 158%.
• Cash & U.S. Treasuries: $10.4B.
⠀
🎯 𝐆𝐮𝐢𝐝𝐚𝐧𝐜𝐞
• Q4 Revenue: $2.649B–$2.653B, midpoint $2.651B (Est. $2.46B) ✅.
• Q4 Adj. Operating Income: $1.640B–$1.644B.
• FY2026 Revenue: $8.530B–$8.534B, midpoint $8.532B (Est. $8.22B) ✅, raised.
• FY2026 U.S. Commercial Revenue: >$3.559B, at least +143% YoY.
• FY2026 Adj. Operating Income: $5.245B–$5.249B, raised.
• FY2026 Adj. Free Cash Flow: $4.8B–$5.0B, raised.
⠀
📌 𝐊𝐞𝐲 𝐓𝐚𝐤𝐞𝐚𝐰𝐚𝐲𝐬
• Q3 adjusted EPS beat consensus by ~7.3%, while revenue exceeded estimates by ~6.1%.
• U.S. commercial revenue surged 148% YoY and 29% QoQ to $984M, surpassing U.S. government revenue for the first time.
• U.S. government revenue increased 96% YoY to $953M.
• Total U.S. revenue jumped 119% YoY to $1.937B, representing ~84% of total revenue.
• Closed 212 deals worth at least $1M, including 64 deals exceeding $10M.
• Total Contract Value reached $2.918B, +6% YoY.
• U.S. commercial Remaining Deal Value increased 79% YoY to $6.517B.
• Q4 revenue guidance midpoint stands ~7.8% above consensus, implying ~14.6% sequential growth.
• FY2026 revenue guidance midpoint exceeds consensus by ~3.8%, implying ~91% annual growth.
• Adjusted operating margin reached 62%, while adjusted free cash flow margin hit 53%.
⠀
💬 𝐌𝐚𝐧𝐚𝐠𝐞𝐦𝐞𝐧𝐭 𝐂𝐨𝐦𝐦𝐞𝐧𝐭𝐚𝐫𝐲
“Our U.S. commercial revenue has surpassed our U.S. government revenue for the first time in our company’s history.”


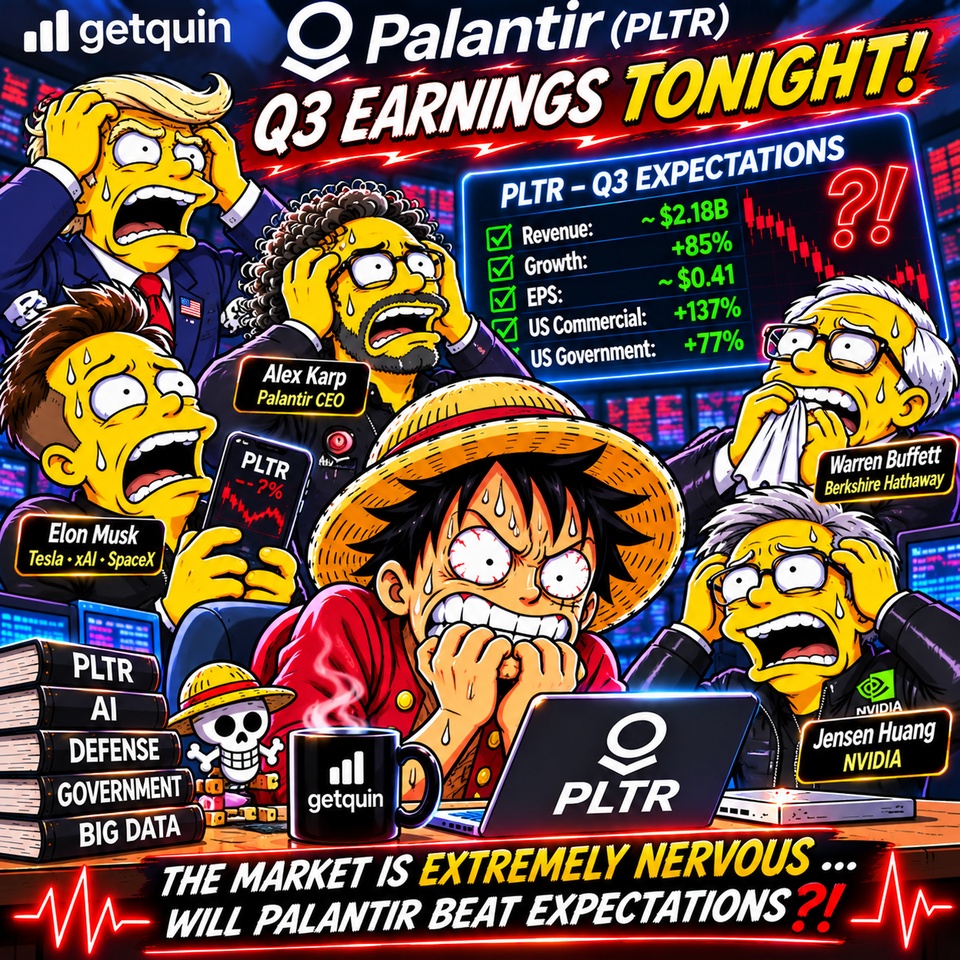
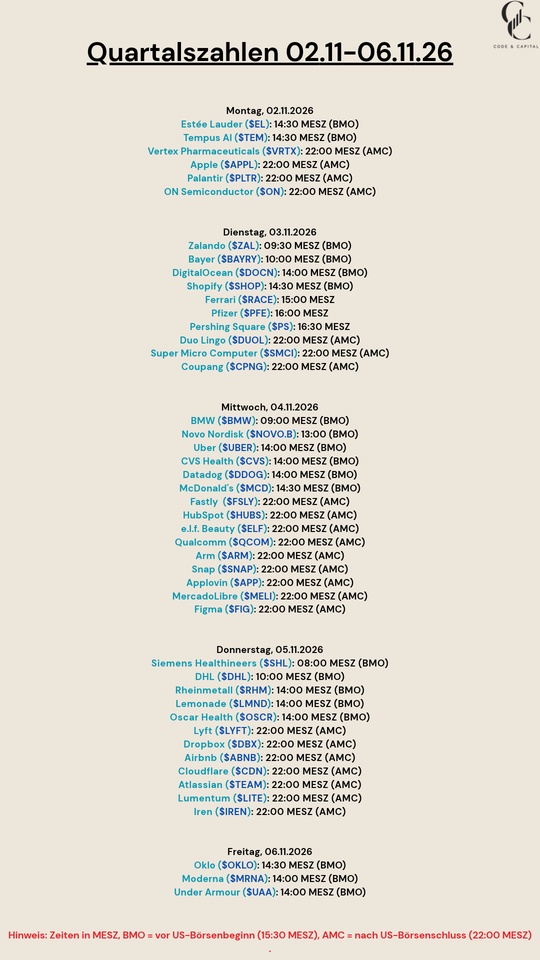
🍿 WALL STREET TONIGHT: POPCORN, PANIC & PALANTIR!


Quarterly Results Nov. 2–Nov. 6, 26
$EL (-0,05%)
$TEM (-1,79%)
$VRTX (+0,18%)
$AAPL (+0,14%)
$PLTR (-1,93%)
$ON (-2,47%)
$ZAL (+4,25%)
$BAYN (+3,03%)
$DOCN (-1,8%)
$SHOP (-1,73%)
$RACE (-0,31%)
$PFE (+0,91%)
$PS (+1,29%)
$DUOL
$SMCI (-2,98%)
$CPNG (-1,53%)
$BMW (+1,88%)
$NOVO B (-0,68%)
$UBER (+0,91%)
$CVS (-0,11%)
$DDOG (-1,77%)
$MCD (+0,95%)
$FSLY (+1,41%)
$HUBS (-3,1%)
$ELF (+0,09%)
$QCOM (-5,36%)
$ARM (-3,08%)
$SNAP (-3,19%)
$APP (+0,29%)
$MELI (-5,23%)
$FIG (+3,61%)
$SHL (-0,1%)
$DHL (-0,74%)
$RHM (-12,68%)
$LMND (-0,55%)
$OSCR (-0,76%)
$LYFT (-1,05%)
$DBX (-0,88%)
$ABNB (-0,52%)
$NET (-2,12%)
$TEAM (-0,12%)
$LITE (-4,09%)
$IREN (-5,08%)
$OKLO
$MRNA (-0,5%)
$UAA (-1,65%)

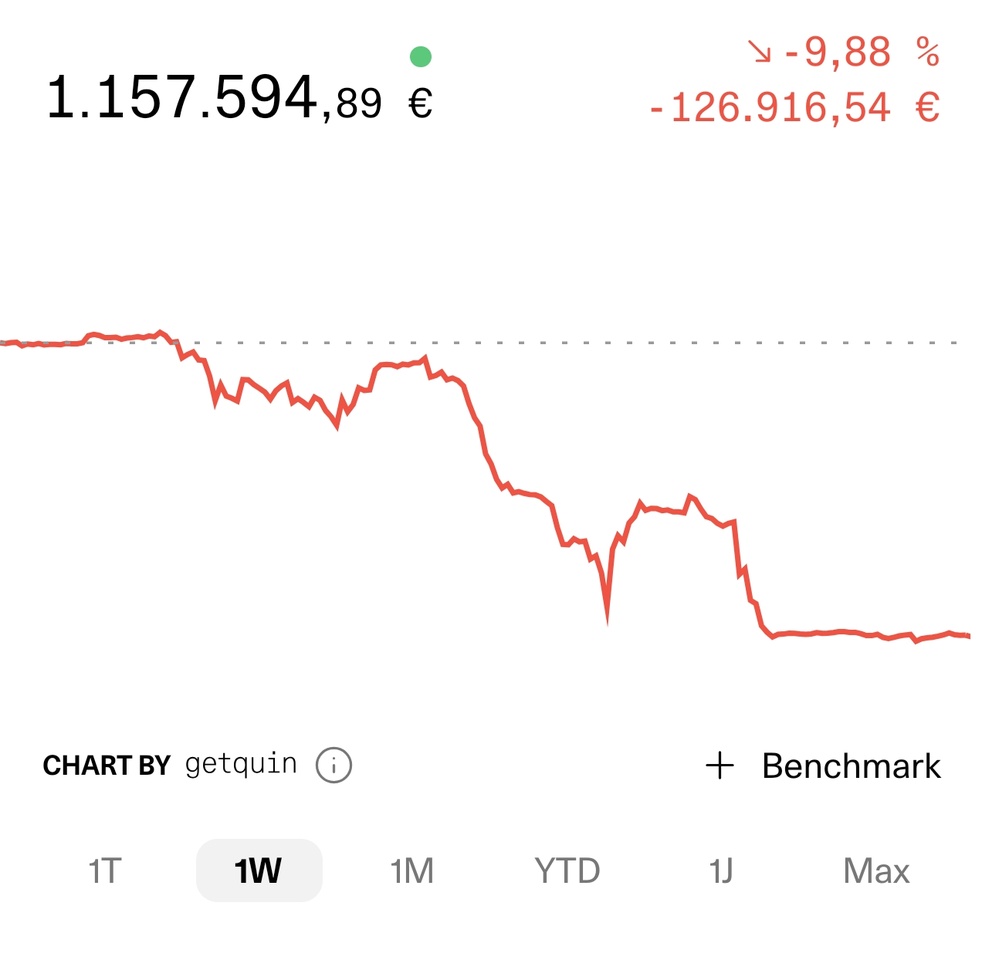
It was certainly a very red week
It was certainly a very rough week, but the portfolio had reached a new all-time high just 11 days ago. Just normal volatility.
Year-to-date performance is +30% overall, but it was already at +40% 11 days ago. How did the week and the year go for you so far? $AMD (-3,55%)
$PLTR (-1,93%)
$BTC (-0,82%)

What 4.5 years of not touching my portfolio would have done
So, since it's been so long since I touched my account, it's interesting to look back at it and actually see the difference between what if I just left my account like I did here vs. what actually transpired (spoiler alert: I didn't let my $NVDA and $PLTR run).
Most important findings:
- Frozen getquin portfolio: €504,764. My actual accounts: €290,261. That’s a €214k gap.
- $NVDA (-1,84%) : getquin still thinks I own 1,300.83 shares, bought for €23,798. Today that’s €266,605 (+1,020%). So yes, Nvidia alone covers the entire gap and then some.
- $PLTR (-1,93%) : 150 shares at €19.97, now €27,897 (+831%).
- The ones I was right to dump: $CRSR (-52%) and $BABA (-26%).
Time to sync this account with reality.

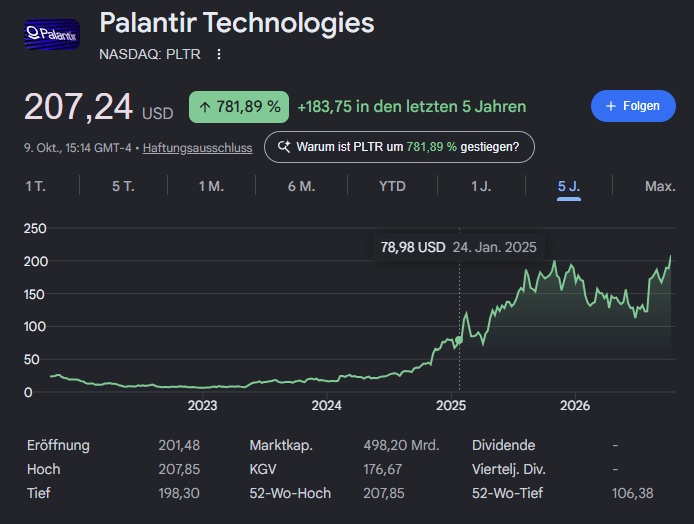
PLTR hit a new all-time high today at $207.85!
$PLTR (-1,93%) The catalyst was essentially a combination of two recent analyst upgrades:
- Goldman Sachs has raised its rating from Neutral to Buy (target price $230) and sees significant potential, particularly in the area of sovereign AI . I also found it interesting that they noted Palantir is scaling much more efficiently from an operational standpoint than before, because it requires fewer “on-site solutions engineers.”
- Barclays also rates it a Buy ($265 target) and justifies this primarily with the strong free cash flow growth rates and high margins.
On top of that, AIP continues to be extremely well-received by companies and is further driving growth in the commercial sector. After the stock lagged somewhat behind other AI stocks at times, it’s now making up for lost ground.
How are you handling this after the breakout? Are you sticking with your investment, taking initial profits at >$200, or would you rather wait for a pullback to make your next entry?
For now, I’m staying relaxed and holding on to the shares. Karp definitely has the potential $PLTR (-1,93%) to become a $1T company.

Títulos em alta
Principais criadores desta semana