
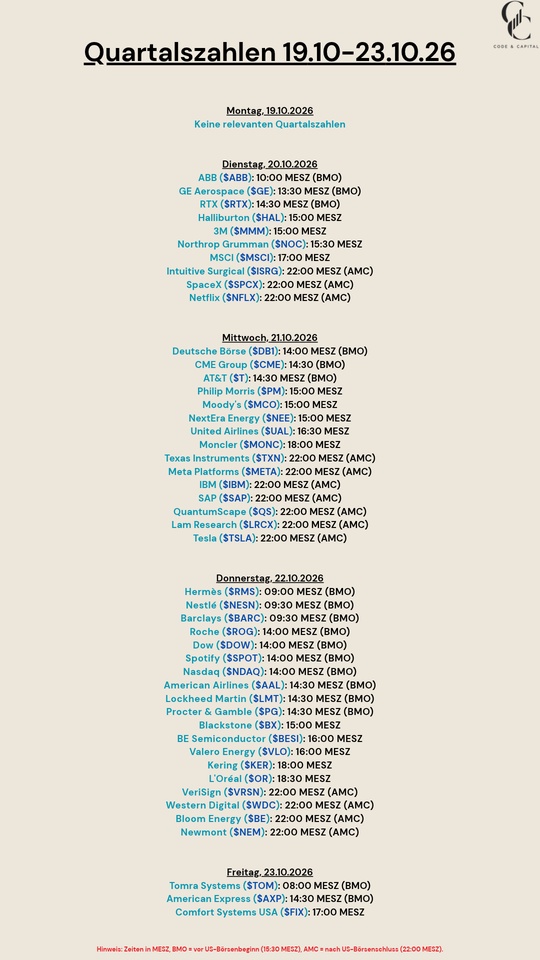
$ABBN (-3,18%)
$GE
$RTX (+2,07%)
$HAL (-2,15%)
$MMM (+1,33%)
$NOC (+2,57%)
$MSCI (+2,82%)
$ISRG (+3,5%)
$SPCX (-8,46%)
$NFLX (+2,97%)
$DB1 (+2,96%)
$CME (+3,49%)
$T (+3,59%)
$PM (+2,23%)
$MCO (+0,58%)
$NEE (+4,85%)
$UAL (+0,66%)
$MONC (+0,75%)
$TXN (-1,27%)
$META (-11,18%)
$IBM (-2,9%)
$SAP (+0,76%)
$QS (-5,4%)
$LRCX (-6,97%)
$TSLA (-3,54%)
$RMS (-5,86%)
$NESN (+3,01%)
$BARC (-2,17%)
$ROP (+1,29%)
$DOW (+5,08%)
$SPOT (+11,1%)
$NDAQ (+7,48%)
$AAL (+2,86%)
$LMT (+6,51%)
$PG (+5,82%)
$BX (+7,94%)
$BESI (-5,03%)
$VLO (-1,95%)
$KER (-10,2%)
$OR (+5,88%)
$VRSN (-3,78%)
$WDC (-10,05%)
$BE (-14,83%)
$NEM (-1,7%)
$TOM (-1,17%)
$AXP (+0,64%)
$FIX (-13,03%)

Newmont Mining
Ação
Ação
Ticker: NEM
NEM
Price
Discussão sobre NEM
Postos
394D·
Quarterly Results: Oct. 19–23, 2026
99
1Semana·
Gold mines—but which ones?
Hello everyone, I’d like to add a gold mine to my portfolio but I’m not sure which one. Why a mine and not gold itself, etc.? Because I see more potential in mines given the long-term rise in the price of gold.
Senior or junior gold mines—obviously, juniors offer more growth potential but also come with more risks.
This would be a long-term investment. My question is: who would you bet on—the heavyweights:
Or the juniors? Maybe you have other options to suggest as well. Thanks, everyone
44
11 Comentários
Tenbagger-Capital@Tenbagger-Capital
1Semana
•
44
•Ver todas as 4 restantes respostas
1Mês·
🕖 Six Months of Global Quant 6-Factor
The strategy was launched on March 13. It has been tradable as a certificate since June 9. Today, it’s up 18.3 percent, and that number doesn’t tell the whole story.
📊 Where the strategy stands today
Up 18.3 percent since launch, up 7.5 percent over the last three months, and up 1.8 percent over the last month. The largest intraday loss was 14.6 percent. A total of 4,259 euros is invested across 44 watchlist entries. One number is almost never included in such overviews: the strategy’s highest level was 126 points; it currently stands at 118.3. So the strategy is a good six percent away from its own high. The 18.3 percent gain mentioned above isn’t a record high, but rather a recovery. What sounds like a quiet half-year actually had a pretty rough summer.
📉 July
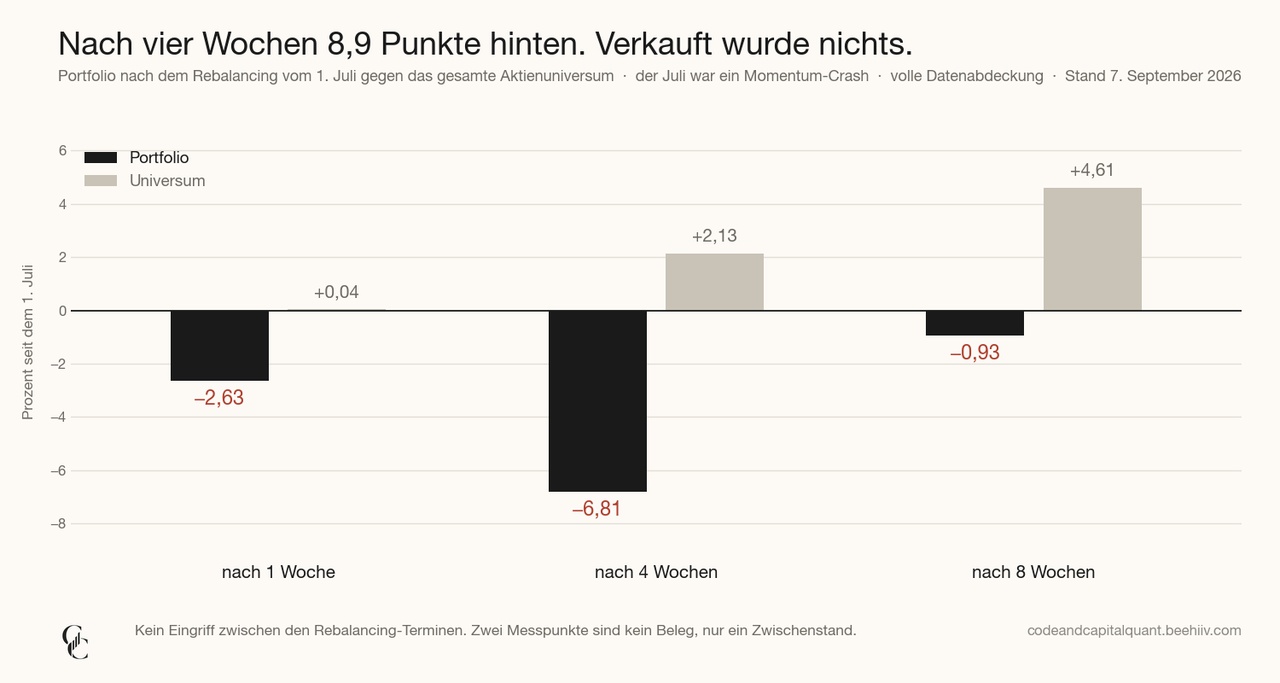
In July, I realized for the first time what the difference is between a backtest and real money. The second rebalancing took place on July 1. After that, the portfolio went down. I track how the purchased portfolio performs against all 843 stocks in my universe, equally weighted. After four weeks, the portfolio was down 6.81 percent. The benchmark stood at plus 2.13. A lag of nearly nine points in four weeks.
That was the momentum crash. What had been performing well before suffered the sharpest decline. Momentum is one of my six factors. A portfolio selected based on this factor is bound to underperform an equally weighted benchmark during such a phase. In backtesting, I’ve seen such stretches multiple times. Still, reading about them is quite different from watching them unfold every morning for four weeks.
I did nothing. Not because I’m disciplined, but because the rule doesn’t call for any intervention. Nothing happens between two scheduled reviews, no matter what’s in the portfolio. After eight weeks, the shortfall had shrunk to 5.5 points. The recovery came when the market turned. If I had sold at the end of July, the loss would have been locked in, and the recovery would have passed me by.
💶 The portfolio after six months
Of the 30 positions, 14 are still from the first day in March. Seven were added in April, and nine in July. Two rebalancings, and nearly half remains unchanged. By weight, about 41 percent is in financials, just under 30 percent in semiconductors and memory, and just under 13 percent in mining stocks. I didn’t set any of these limits myself. The model doesn’t target specific sectors. They’re included because they currently combine favorable valuations with strong momentum. In July, the portfolio rotated out of chip stocks—which had become expensive—into European banks. For the chips, earnings were no longer keeping pace with the stock price; for the banks, it was the other way around. Bankinter $BKT (-8,23%) , CaixaBank $CABK (-6,44%) , BPER $BPE (-2,96%) , Monte dei Paschi $BMPS (-4,21%) and Swedbank $SWED A (-3,72%) are now all side by side in my portfolio. I never had a strong opinion on European banks.
🔁 Let the winners run
Micron $MU (-7,08%) is the perfect example of how this strategy works. I bought it with a 3.3 percent weighting; today it’s at 6.6 percent. I don’t rebalance between trading sessions. Winners stay big; losers get smaller. Compared to a strategy that resets every position to the same weight, this approach yielded 1.86 points last quarter. One quarter isn’t much, but the trend aligns with what the backtest shows.
🔄 On October 1
In the third rebalancing, about half the portfolio changes—15 stocks out and 15 in. Significantly more than last time. The mining stocks are almost entirely out—namely, Antofagasta $ANTO (-6,03%) , Coeur $CDE (-8,11%) , Endeavour $EDV (-5,07%) and Newmont $NEM (-1,7%) . Gold and copper have performed strongly since the spring, and that’s exactly what’s making the stocks in the model expensive. The main additions are refiners and semiconductor companies. I’ll list the exact stocks after the rebalancing. I find it more interesting to see what’s happening with the banks. In July, the model rotated out of expensive chip stocks into European banks. Now it’s rotating back into some of them—Bankinter $BKT (-8,23%) , Swedbank $SWED A (-3,72%) and UniCredit $UCG (-4,29%) are on the sell list. Not because they’ve underperformed—all three are in the black. They’ve risen and thus become more expensive, and that’s enough for the model. This is where a system like this seems least intuitive. It doesn’t sell because something is performing poorly. It sells because something is no longer cheap.
💡 What Six Months Don’t Tell You
Two rebalancings are two data points. The third comes on October 1—only then does a trend even begin. The backtest over six and a half years tells one thing; six months of live trading tell another—and I don’t know today just how far apart those two will diverge.
What I’ve learned after half a year is more valuable than any return figure. A rule set in advance takes the decision out of your hands at the very moment when you’d be least capable of making it.
❓ Did you stick with your strategy in July, or did you rebalance? And do you work with fixed rules, or do you decide on a case-by-case basis?
👇 Let us know in the comments!
➡️ Every month, you’ll find the full Wikifolio update here, along with research from the model in between.
🗞️ Newsletter: codeandcapitalquant.beehiiv.com
📈 Wikifolio: https://www.wikifolio.com/de/de/w/wf0gquant6
Not investment advice; our own research. Past performance is not indicative of future results.
66
1Mês·
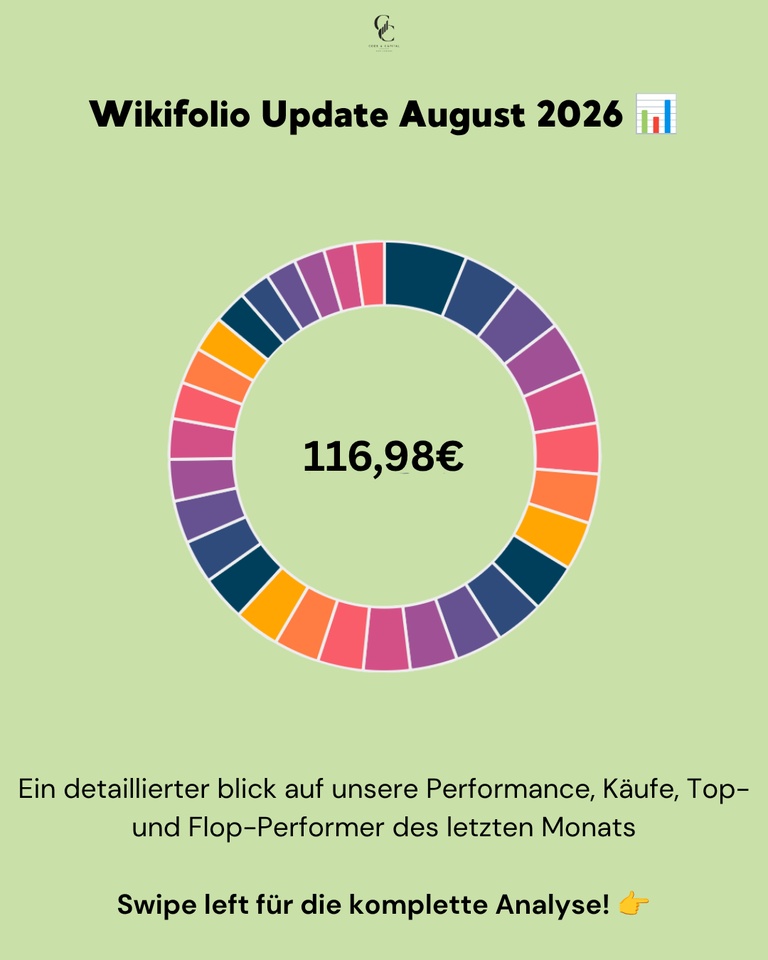
📊 Wikifolio Update August 2026
SanDisk $SNDK (-9,8%) up 28 percent, Western Digital $WDC (-10,05%) down 18 percent. Both in the same sector, in the same month. My model didn’t react to either of these movements, yet at the end of the month it was still up 3.03 percent.
August had two sides. At the beginning of the month, mild inflation data was released, and the S&P 500 hit an all-time high of 7,816 points on August 13. After that, sentiment on the bond markets shifted. The 30-year U.S. yield rose to its highest level in nearly twenty years, and U.S. gross debt exceeded forty trillion dollars. At the end of the month, Nvidia reported $NVDA (-4,4%) quarterly revenue of 96.2 billion, an increase of 106 percent. The next day, Fed Chairman Warsh signaled a pause in Jackson Hole, and the market priced in an interest rate hike in September.
📊 Monthly performance: +3.03%
📊 Max. Performance: 16.1%
📊 Price as of Aug. 31: €116.85
📊 Next Rebalancing: October 1, 2026
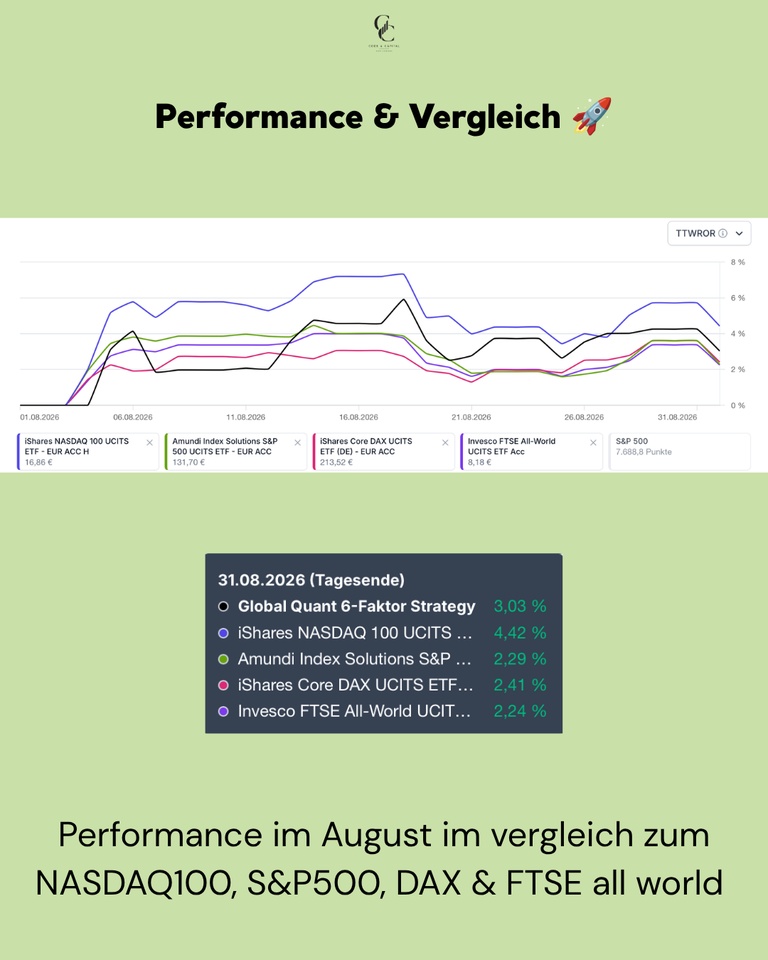
Performance & Comparison 🚀
August was a positive month for all major indices. The Nasdaq led the way, driven by Nvidia. The model performed in the middle of the pack and outperformed the broad indices.
Performance Comparison (August 1–August 31, 2026, end of day):
Global Quant 6-Factor: +3.03%
NASDAQ 100: +3.57%
S&P 500: +2.74%
FTSE All-World: +2.27%
DAX: +2.03%
Purchases & Sales 💶
None. The model trades only quarterly; the last rebalancing took place on July 1. Nothing happens between those dates, even if individual positions diverge significantly. That is precisely the point of the rules. The next rebalancing is scheduled for October 1, when a larger portion of the portfolio will be replaced.
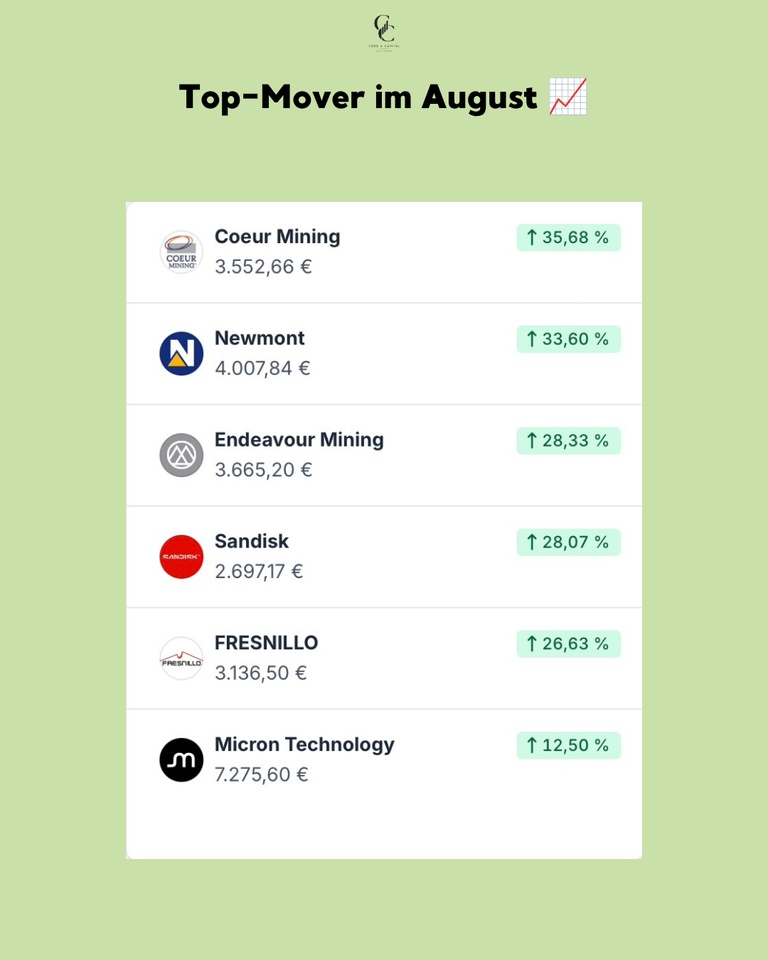
Top Movers in August 🟢
The month belonged to gold mining stocks. Over the course of the month, gold rose at times to nearly $4,700, reaching its highest level since May. By the end of the month, it had given back some of those gains. The move was driven by a weaker dollar combined with ongoing central bank purchases. Mining stocks react to this with leverage because their margins rise disproportionately. Coeur Mining $CDE (-8,11%) topped the list with +35.68%, followed by Newmont $NEM (-1,7%) at +33.60% and Endeavour Mining at +28.33%. Fresnillo $FRES (-4,07%) rose +26.63%. All four have been in the portfolio since the spring. In addition, the storage stocks performed well. SanDisk $SNDK (-9,8%) rose by +28.07%, and Micron $MU (-7,08%) by +12.50%.
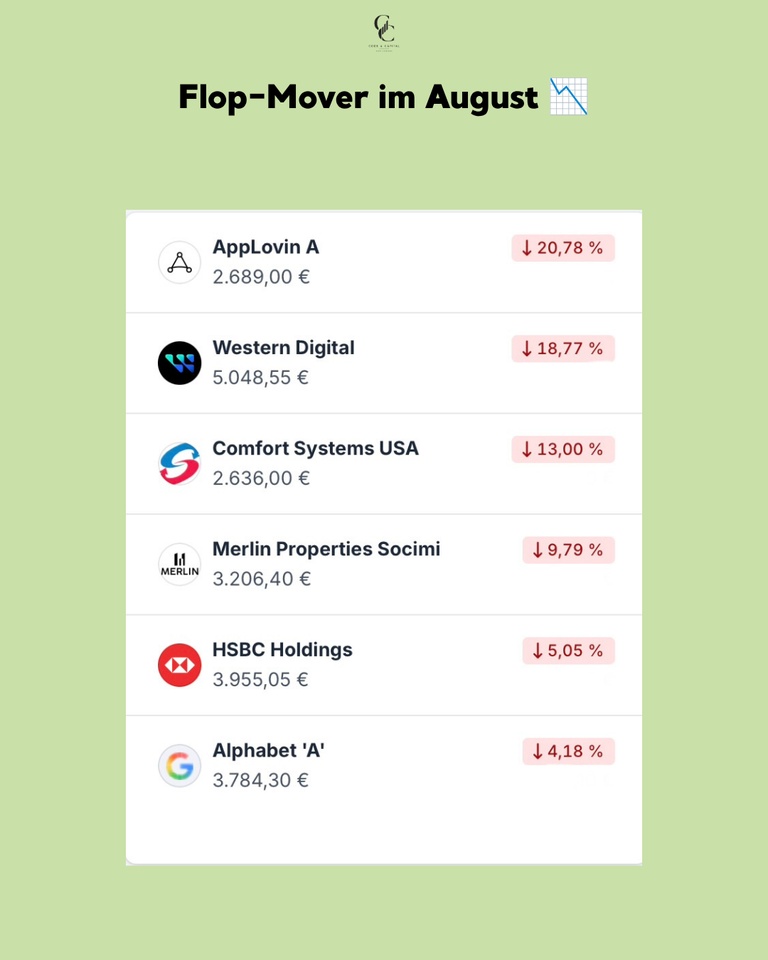
August’s Biggest Losers 🔴
AppLovin $APP (-1,52%) suffered the biggest loss at -20.78%. Western Digital $WDC (-10,05%) fell -18.77%, while SanDisk gained nearly thirty percent over the same period. Comfort Systems $FIX (-13,03%) fell by -13.00%, and Merlin Properties $MRL (-3,23%)
-9.79%. Among financial stocks, the decline was limited; HSBC $HSBA (-2,34%) lost -5.05%. Alphabet $GOOG (-3,09%) fell -4.18%.
Conclusion 💡
August demonstrated the value of a diversified portfolio. While technology stocks diverged and AppLovin fell 20 percent, gold mines carried the month. None of these positions are in the portfolio based on personal opinion; they’re there because the ranking placed them at the top. October 1 will be interesting because a large portion of the commodity stocks are on the sell list.
❓ Question for the Community
Did the volatility in August make you get cold feet, or did you stubbornly hold onto your positions? And how much gold do you currently have in your portfolio?
👇 Let us know in the comments!
➡️ Every month, you’ll find the full Wikifolio update here, along with research from the model in between.
🗞️ Newsletter: codeandcapitalquant.beehiiv.com
📈 Wikifolio: https://www.wikifolio.com/de/de/w/wf0gquant6
+ 1
1010


6Mês·
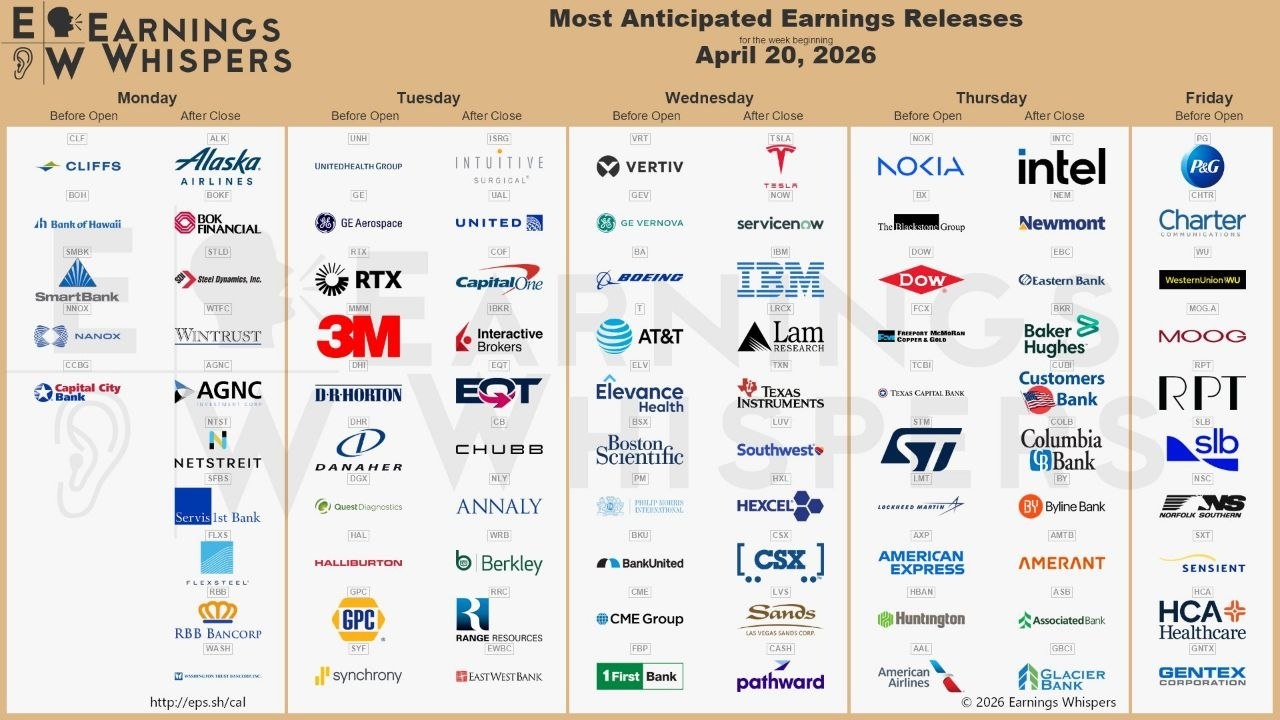
The week ahead
Monday nothing important
Tuesday, April 21
14:30: Retail sales (March) 🌶
16:00: Business inventories (February)
Wednesday, April 22nd
16:30: Weekly US crude oil inventories (EIA)
Thursday, April 23
14:30: Weekly initial jobless claims
15:45: Purchasing managers' indices 🌶
16:00: New home sales (March)
Friday, April 24
16:00: University of Michigan Consumer Confidence (final figures for April)
$INTC (-8,74%)
$TSLA (-3,54%)
$NEM (-1,7%)
$RTX (+2,07%)
$BA (-1,85%)
$DOW (+5,08%)
$PG (+5,82%)
3333
6Mês·
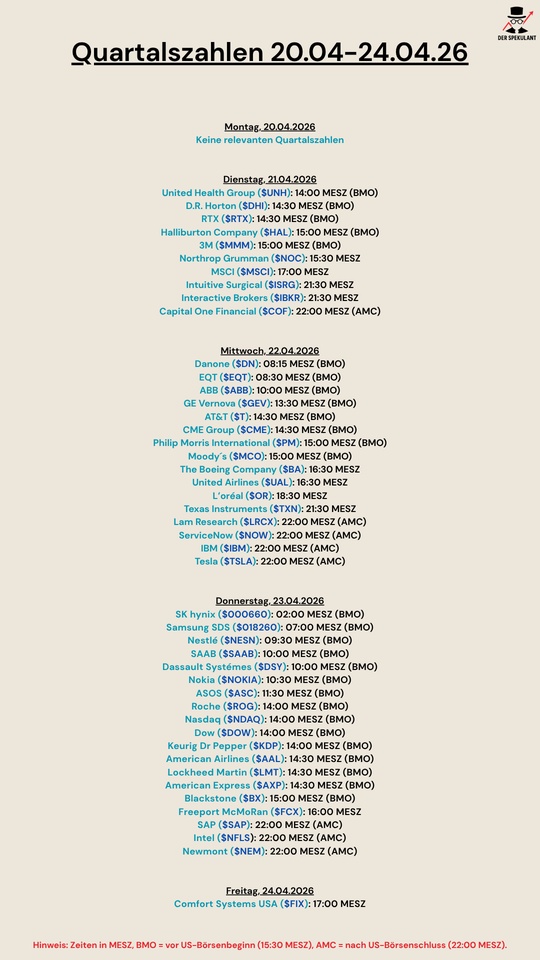
Quarterly figures 20.04-24.04.26
$UNH (+2,16%)
$DHI (+6,47%)
$RTX (+2,07%)
$HAL (-2,15%)
$MMM (+1,33%)
$NOC (+2,57%)
$MSCI (+2,82%)
$IBKR (-3,68%)
$ISRG (+3,5%)
$COF (-1,67%)
$BN (+2,53%)
$EQT (+1,27%)
$ABBN (-3,18%)
$GEV (-10,83%)
$T (+3,59%)
$CME (+3,49%)
$PM (+2,23%)
$MCO (+0,58%)
$BA (-1,85%)
$UAL (+0,66%)
$OR (+5,88%)
$TXN (-1,27%)
$LRCX (-6,97%)
$NOW (+1,42%)
$IBM (-2,9%)
$TSLA (-3,54%)
$000660
$018260
$NESN (+3,01%)
$SAAB B (-0,93%)
$DSY (+1,29%)
$NOKIA (-13,65%)
$ASC (-0,63%)
$ROG
$NDAQ (+7,48%)
$DOW (+5,08%)
$KDP (+2,65%)
$AAL (-5,09%)
$LMT (+6,51%)
$AXP (+0,64%)
$BX (+7,94%)
$FCX (-6,04%)
$SAP (+0,76%)
$INTC (-8,74%)
$NEM (-1,7%)
$FIX (-13,03%)
1212

6Mês·
Why I will never buy gold, why you shouldn't either and why the "safe haven" is an illusion. ⚓️🔥
Hey dear Getquiners, honest question: Do you think gold is crisis-proof?
In this post, I explain why I think gold is one of the worst assets of all and why the "scarcity" on the market is often a lie - because all that glitters is not gold 😉
1. the asset in a deep sleep 😴
Anyone who bought gold at the high in 1980 had to 26 years to get back to zero in nominal terms. Adjusted for inflation, this was a financial disaster. Is an asset really "stable in value" if it takes half a working lifetime to make up for mere losses? After the 2011 high, it also took approx. 9 years (until 2020) until the price broke out sustainably.
2. the gold that wasn't actually there. 👻
Gold is sold as a "limited resource". It has to be painstakingly mined, is physically limited and cannot be conjured up. But what if it is possible on paper?
The Morgan Stanley scandal: In 2007, it came to light that Morgan Stanley had not physically bought or stored gold for many clients at all. The bank only held "paper positions", but still collected the fees for the (non-existent) vault storage. The clients were not holding hard assets, just hot air.
The Bre-X scandal (1997): The company Bre-X Minerals claimed to have discovered the largest gold deposit in the world. Geologists "salted" the drill samples with gold dust (even from their own jewelry!) to keep up appearances. The shares shot up to a value of over 6 billion dollars before everything collapsed.
This begs the question: is the price of gold really linked to physical scarcity, or is it often just a hype chart created by expert opinions and blind bank confidence?
3. the volatility lie: 10% crash in 28 minutes? ⏱️📉
It is often said that gold is so great because it is less volatile. But is that true? Let's jump to January 30, 2026: On this day, gold lost almost 28 minutes almost 7 % of its value in just 28 minutes. Over the entire day, it was around 14 %. Don't even get me started on silver (30% fluctuation... cough).
Another example is the April 12, 2013At that time, sell orders for over 400 tons of gold were placed on the Comex in New York within a very short space of time (approx. 15% of annual global production). Gold plunged in two days by 15,5 % in two days. The absurdity: Not a gram of physical gold was moved. They were pure "paper promises". Someone pressed the sell button without ever having owned the metal.
My conclusion: For me, gold is neither stable nor crisis-proof. It is highly volatile and - most importantly - not protected by financial constructs. not infinitely limited. It can be "printed" on paper as much as you like. That's why it no longer has any real value for me.
What do you think? Would you still buy or hold gold after these facts? Let me know your opinion in the comments and leave a follow for more posts like this. Next, I'll write a post on the biggest gold scandals and show you what I think are the better alternatives! 🚀
Feel free to leave feedback, criticism is also welcome, because that's the only way to learn! 😉
$IGLN (-2,9%)
$4GLD (-2,66%)
$DE000EWG0LD1 (-2,51%)
$NEM (-1,7%)
$GOLD (-7,01%)
$ABX (-5,65%)
$FNV (-4,61%)
$AEM (-5,97%)
$BTC (-3,94%)
#gold

3131
42 Comentários
I've been holding gold for 17 years and I'm still convinced. You could just as easily have written an article entitled "Why I will always buy gold, why you should too and why the "safe haven" is not an illusion.". Some swear by it, others consider it "one of the worst assets."
I belong to the former.
I belong to the former.
•
4040
•
7Mês·
📈 February monthly update: Momentum strategy live check! 🚀
February 2026 is in the bag. While my model’s historical data is impressive, in the end, the only thing that counts is what has happened since the the model went live in late 2023 .
And so far, the numbers don’t lie:
💰 Real portfolio performance (since the live launch)
- Portfolio value as of Feb. 1: €43,344.20
- Portfolio value as of March 1:
€45,960.30 - Monthly gain:
+€2,616.10 (+6.04%)
Since I began implementing this strategy in late 2023, I have achieved a total return of +364.61% . This shows that the momentum strategy not only works in theory (backtesting) but also delivers in the current market environment.
📊 Performance Snapshots
- YTD (2026):
+41.87% - Last 12 months (live):
+125.46%
The drivers in February:
- Western Digital ($WDC$):
+12.19% – Momentum is really kicking in here. - Micron Technology ($MU$):
-0.14% – A brief lull after the strong rally.
🛠 Backtest vs. Reality
I do track the rolling 5-year returns (currently theoretical 107.75%), but I’m aware that this is partly backtest data. It simply serves as a compassto see if the current market phase is historically “normal.” The real story lies in the YTD performance and my account balance, which is steadily approaching the €50,000 mark .
🔄 Setup for March
The ranking is ruthless and filters out the current leaders. My pool is reshuffled monthly:
Current top rankings:
Western Digital ($WDC$): 193.44% Score 🥇
Micron Technology ($MU$): 164.21% score 🥈
Teradyne: 146.63%
Seagate: 109.22%
Albemarle 93.25%
👉 Decision: No changes in March. I’m sticking with the two strongest stocks WDC and MU .
A brief outlook for March: Given the events surrounding Iran, March could turn out to be rather negative and become a month dominated by commodities. However, if this trend persists, it should also have a positive impact on the “commodity” stocks in my portfolio, such as $NEM (-1,7%) and $XOM (+0,37%) , and propel them further up in the rankings.
3434
13 Comentários
7Mês
Very good! We are waiting for the certificate... ⏰
•
33
•
8Mês·
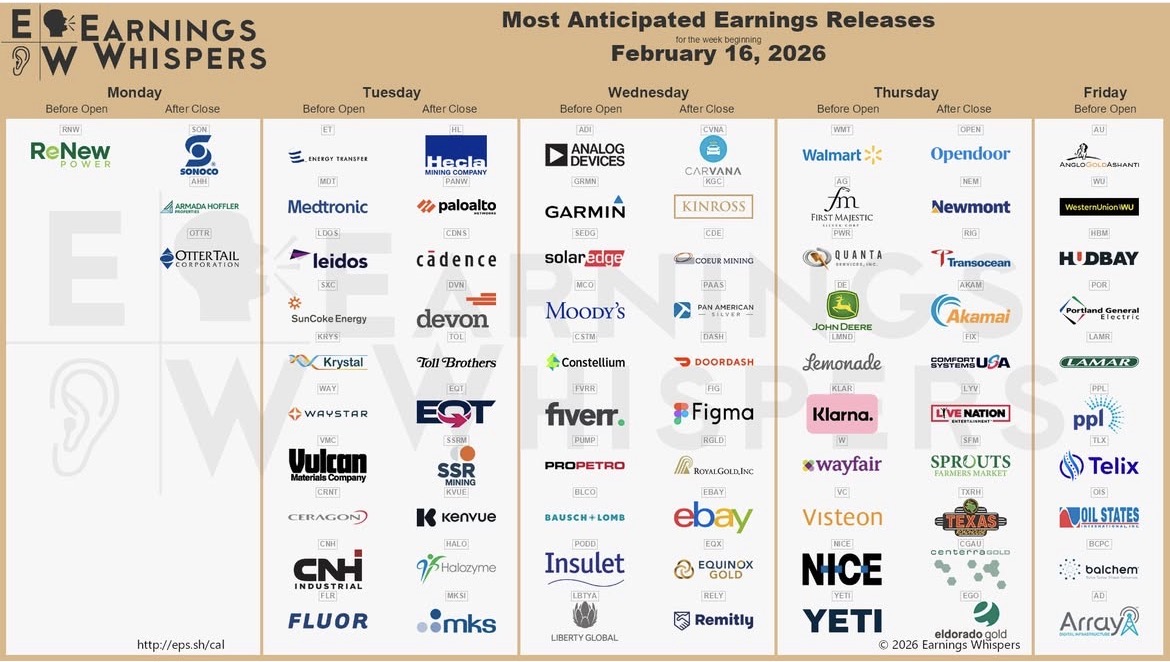
A little quieter next week
$SON (-1,55%)
$MDT (+3,9%)
$LDOS (+4,5%)
$PANW (+1,67%)
$CDNS (-5,62%)
$KRYS (-0,47%)
$HL (-7,08%)
$TOL (+5,32%)
$KVUE (+3,83%)
$DEVON
$ADI (-5,02%)
$GRMN (+1,74%)
$SEDG (-0,68%)
$MCO (+0,58%)
$FVRR (+1,14%)
$PODD (+4,65%)
$CVNA (-0,88%)
$DASH (+1,23%)
$FIGX
$EBAY (-0,53%)
$RELY
$WMT (+3,21%)
$PWR (-8,88%)
$DE (+0,65%)
$LMND (+0,52%)
$KLAR (+1,54%)
$W (+0,45%)
$NICE
$YETI (+2,89%)
$OPEN (+4,34%)
$NEM (-1,7%)
$AKAM (+0,34%)
$SFM (+5,36%)
$TXRH (+3,08%)
$BCPC (+1,38%)
$BKNG (+2,17%)
88
11 Comentários
I hope the suffering has now come to an end
•
55
•Títulos em alta
Principais criadores desta semana
Dados tempo real da LSX · Dados financeiros e EOD da FactSet