
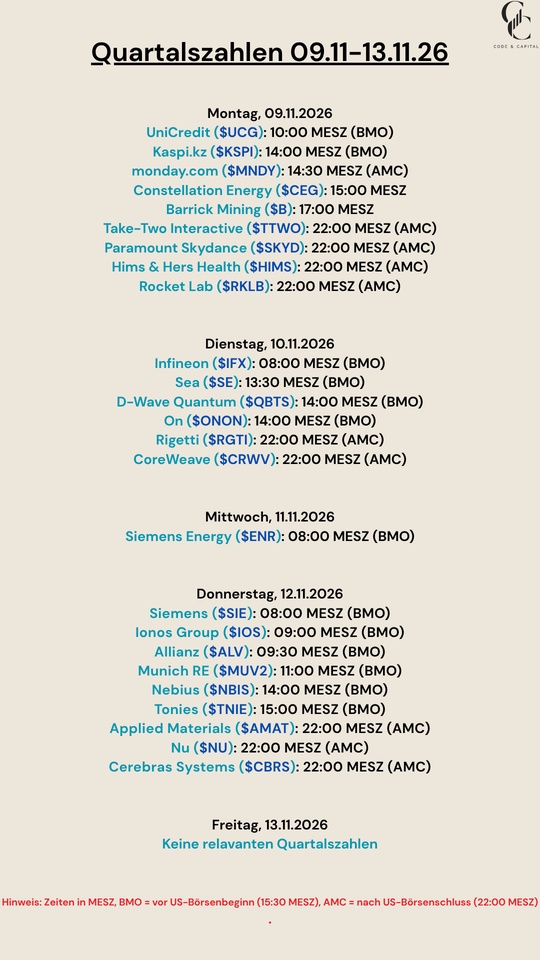
$UCG (-0,69%)
$KSPI (+2,78%)
$MNDY (+0%)
$CEG (+1,37%)
$ABX (+0,44%)
$TTWO (+1,85%)
$PARA (+0,6%)
$HIMS (+0,64%)
$RKLB (-0,17%)
$IFX (-1,13%)
$SE (+0,15%)
$QBTS (+0,43%)
$ONON (-0,32%)
$RGTI (-0,03%)
$CRWV (-0,65%)
$ENR (+0%)
$SIE (-1,11%)
$iOS$ALV (+1,14%)
$MUV2 (+1,33%)
$NBIS (-2,56%)
$TNIE (-2,07%)
$AMAT (-0,77%)
$NU (+3,08%)
$CBRS

Uni Credit
Ação
Ação
ISIN: IT0005239360
Ticker: UCG
IT0005239360
UCG
Price
Discussão sobre UCG
Postos
645D·
Quarterly Results Nov. 9–13, 26
1919
1Semana·
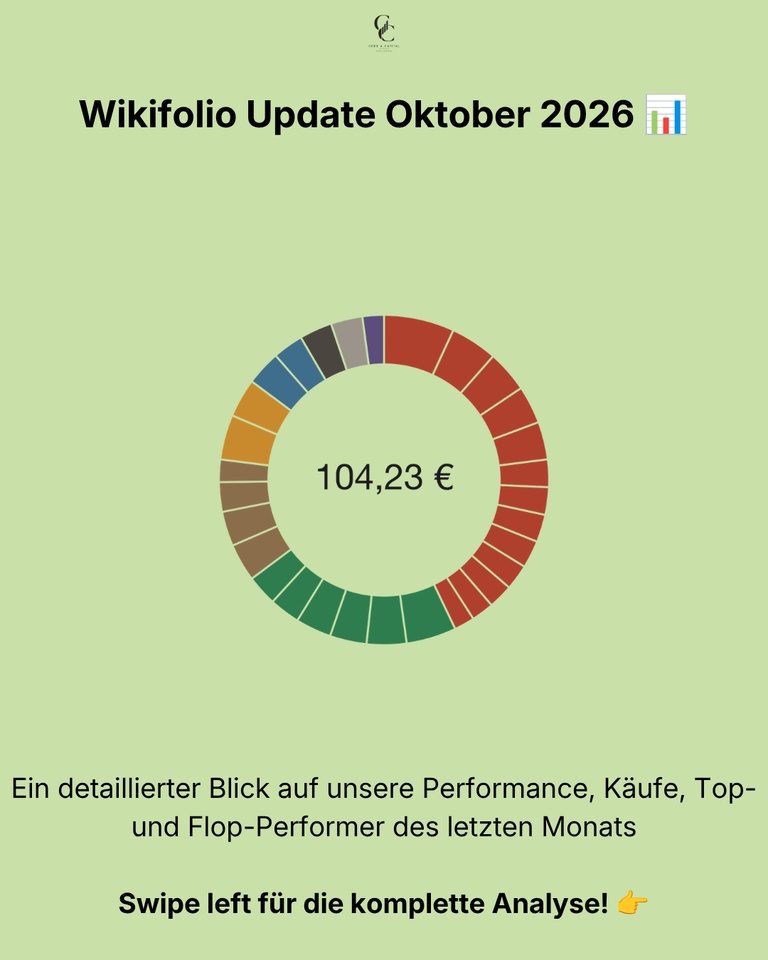
Wikifolio Update October 2026: Tech Stocks Fall, Pharmaceuticals and Oil Rise.
On October 1, the model replaced 18 of its 30 positions. One month later, all six of the month’s top-performing stocks are new additions resulting from that very rebalancing. However, three of the six worst-performing stocks are as well. The Wikifolio ended October down 11.64 percent, its weakest month since its launch in March.
October was not a good month for tech stocks. Concerns about AI spending by the major cloud companies have resurfaced; the SOX semiconductor index lost 15.4 percent over the month, and the Nasdaq fell 5.3 percent. That was its weakest month since March 2025. Quarterly earnings reports came out last week. Seagate and Teradyne beat expectations but still saw their shares fall. On October 30, $INTC (-1,4%) l issued a weak outlook for the fourth quarter and plummeted 28.6 percent in a single day. SanDisk $SNDK (-1,76%) , Marvell $MRVL (-0,98%) and $AMD (-1,37%) also saw double-digit declines. In the meantime, on October 28, the Fed kept interest rates at 3.75 to 4.00 percent; two members would have preferred to raise them already.
For a portfolio that, after rebalancing, is invested nearly half in semiconductors and memory
, this was the worst possible month:
📊 Monthly performance: −11.64%
📊 Price as of October 30: €104.23
📊 Performance since inception (March 13): +4.2%
📊 Largest loss since inception: −18.6% (previously −14.6%)
📊 Next rebalancing: Early January 2027
Performance & Comparison 🚀
The Nasdaq fell, the broad indices held steady, and the DAX even gained ground. The model clearly lagged behind this time, falling more than twice as far behind as the Nasdaq.
Performance Comparison (September 30–October 30, 2026, end of day, all as euro-denominated ETFs):
Global Quant 6-Factor: −11.64%
NASDAQ 100: −5.27%
FTSE All-World: −0.52%
S&P 500: +0.25%
DAX: +2.43%
The Wikifolio is now 17.5% below its high of €126.30 on June 22.
Buys & Sales 💶
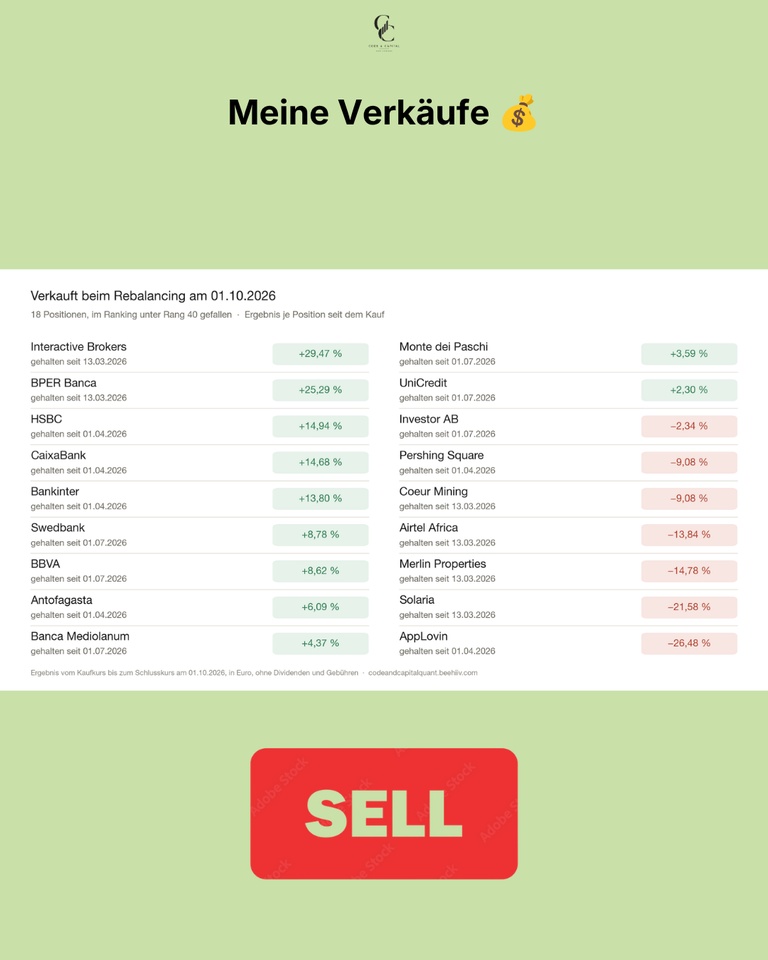
On October 1, the third rebalancing took place—the largest one yet. 18 stocks out, 18 in, 12 remained.
The model sold all nine banks: Bankinter $BKT (-0,32%) , Swedbank $SWED A (+0,69%) , UniCredit $UCG (-0,69%) , CaixaBank $CABK (-0,16%) , BBVA $BBVA (+0,04%) , BPER $BPE (-0,19%) , Monte dei Paschi $BMPS (+0,26%) , Banca Mediolanum $BMED (-0,09%) and HSBC $HSBA (+0,13%) . Also, Interactive Brokers $IBKR (+0,24%) , Antofagasta $ANTO (+0,03%) , Coeur Mining $CDE (-0,33%) , AppLovin $APP (+0,04%) , Airtel Africa $AAF (+0,61%) , Merlin Properties $MRL (+0,68%) , Solaria $SLR (-2,43%) , Investor AB $INVE B (-0,93%) and Pershing Square $PS (+0,44%) . All were ranked below 40th place. You can see the returns on each position since the purchase on the slides.
It bought six healthcare stocks (Eli Lilly $LLY (+0,13%) , Bristol-Myers Squibb $BMY (+0,65%) , Vertex $VRTX (+0,74%) , Incyte $INCY (+0,41%) , Illumina $ILMN (+0,19%) , WuXi AppTec $603259 ) and five semiconductor companies (Seagate $STX (+0,41%) , Marvell $MRVL (-0,98%) , Applied Materials $AMAT (-0,77%) , Teradyne $TER (-0,76%) , KLA $KLAC (-1,61%) ). Also included is Fortinet $FTNT (+1,71%) , CF Industries $CF (-0,64%) , Marathon Petroleum $MPC (+0,03%) , APA $APA (+0,29%) , Pop Mart, the Hong Kong Stock Exchange $HKXCY , and Lion Finance $BGEO (+0,6%) . Applied Materials and KLA had been sold by the model in July; now they’re back in the portfolio.
After the reshuffle, twelve of the thirty positions were semiconductor and memory stocks, accounting for a combined 44.8% of the portfolio.
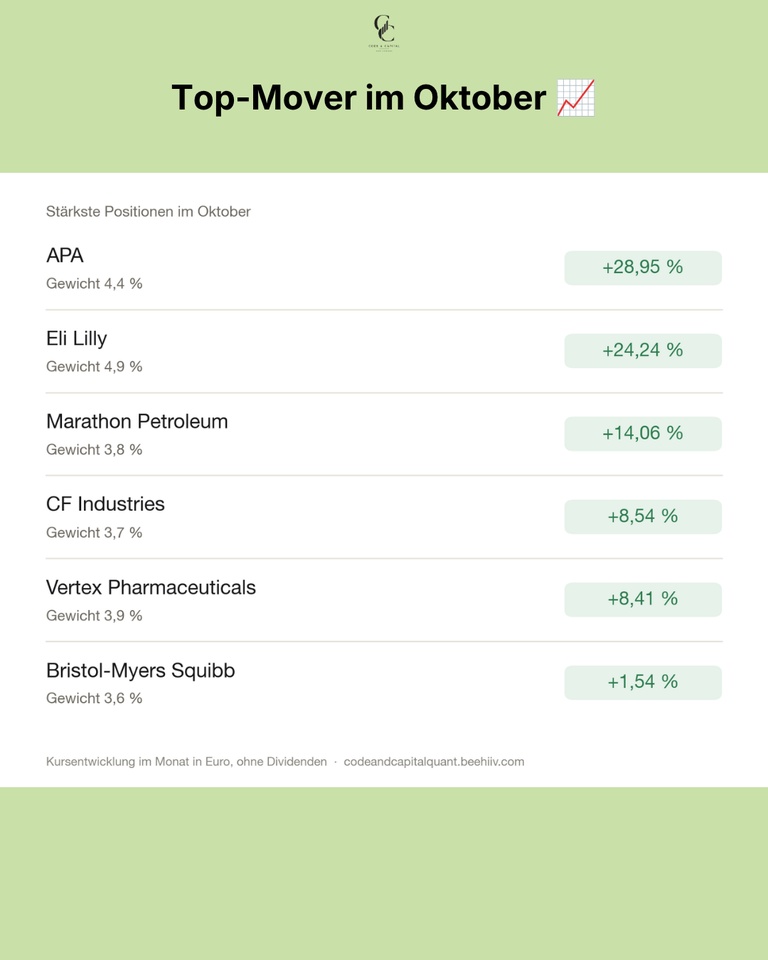
Top Movers in October 🟢
The sectors that gained were those unrelated to AI. APA topped the list with +28.95%. The oil company reported preliminary third-quarter results on October 7 and repurchased 10.5 million of its own shares. Eli Lilly rose +24.24%. Third-quarter revenue rose 39 percent to $24.4 billion, driven by Mounjaro and Zepbound, and Lilly raised its full-year revenue forecast to $91 billion to $92 billion.
Marathon Petroleum gained +14.06%, even though the stock fell 7.4% on October 27 along with other refiners. CF Industries rose by +8.54%, Vertex by +8.41%, and Bristol-Myers Squibb by +1.54%. All six have been in the portfolio since October 1.
October’s Worst Performers 🔴
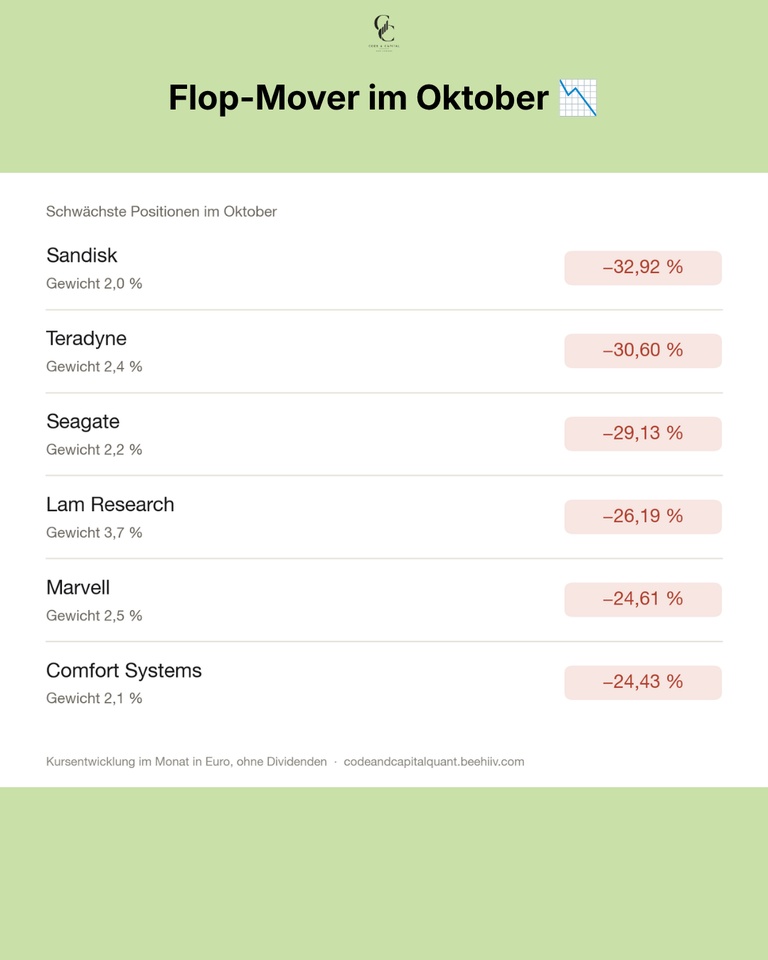
This list consists almost entirely of chip stocks. SanDisk saw the biggest loss at −32.92%; on October 30 alone, it fell by 13.5%. Teradyne dropped −30.60%. The earnings report on October 28 beat expectations, as did the outlook, yet the stock still fell. Seagate (−29.13%) saw the same pattern following its earnings report on October 27. Lam Research fell −26.19%, Marvell by −24.61%. Comfort Systems lost −24.43%. It’s not a chip stock, but the company manufactures climate control and electrical systems for data centers and is thus tied to the same sector. On October 23, following the quarterly earnings report—which did not include a 2027 outlook—the stock dropped about 8 percent in a single day.
Teradyne, Seagate, and Marvell were added to the portfolio on October 1. SanDisk, Lam Research, and Comfort Systems $FIX (+0,1%) were already in the portfolio and were still among the gainers in September.
What’s in the portfolio now 🔍
Stock prices have fallen. The companies’ financial results look different so far. Key metrics for the 30 positions, each showing the median value as of October 31:
P/E ratio: 24.6
Revenue growth: +21.2%
Earnings per share growth: +48.8%
Net margin: 39.0%
Return on equity: 39.4%
Debt-to-equity ratio: 0.2
With a P/E ratio of 24.6, this portfolio isn’t exactly cheap. However, revenue is growing by one-fifth per year, and debt plays virtually no role. The next earnings season will show whether these figures hold up.
Conclusion 💡
October showed what a 44.8% gain means in this sector. When the sector turns, the entire portfolio turns with it. The pharmaceutical and oil stocks added during the rebalancing performed well, but they couldn’t keep up with the chip stocks. A few weeks ago, I calculated a sector limit. At 20 percent, it reduced the maximum drawdown by 2.1 points, but I haven’t implemented it yet. I don’t tinker with the rules in the middle of a drawdown.
What I want to look into is the timing. Rebalancing always takes place just before earnings season, and this time the earnings reports came out right in the first few weeks after the purchase. I’ll run the numbers to see if this is a real disadvantage or if it just happened to look that way this time before I make any changes.
❓ Question for the community
How did October go for you? Did you also have chips in your portfolio, and did you buy more, sell, or just sit it out?
👇 Share your thoughts in the comments!
➡️ Every month, you’ll find the complete Wikifolio update here—even in bad months—along with research from the model.
🗞️ Newsletter: codeandcapitalquant.beehiiv.com
📈 Wikifolio: https://www.wikifolio.com/de/de/w/wf0gquant6
+ 2
66
13 ComentáriosSolitair@Solitair
1Semana
•
33
•Mostrar resposta
1Mês·
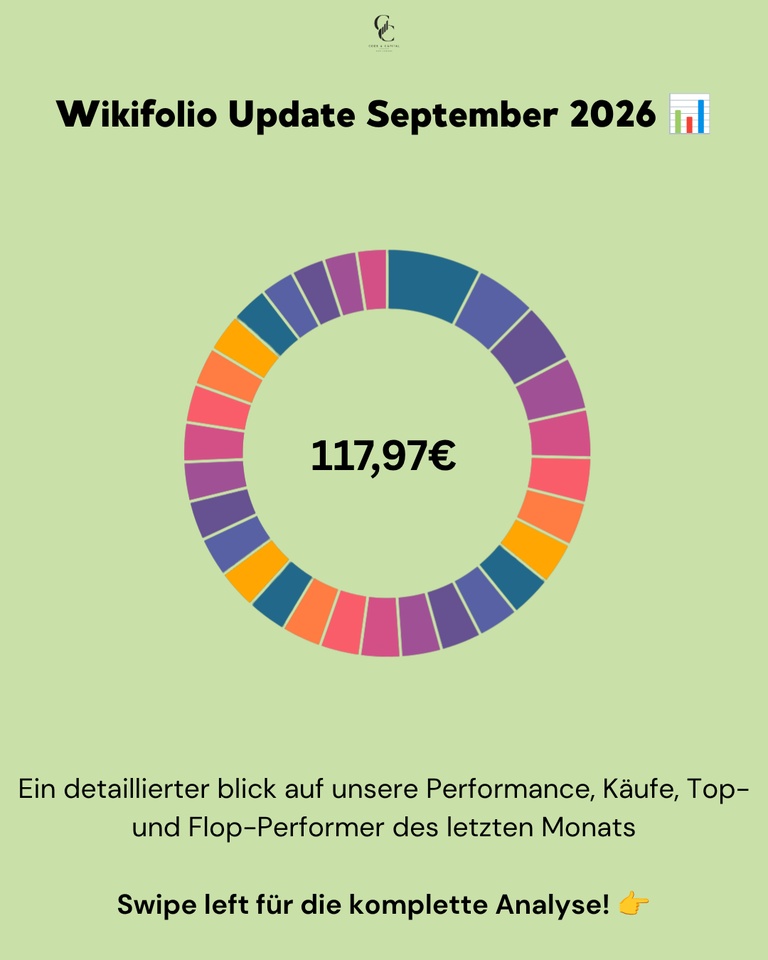
📊 Wikifolio Update September 2026: up 1.03%, tech stocks up, mining stocks down, and 18 of 30 positions swapped on October 1
In August, gold mines were the market's top performers. In September, they were the most expensive. Fresnillo
$FRES (+0,58%) down 15 percent, Micron
$MU (+0,01%) up 17. At the end of the month, the Wikifolio was up 1.03 percent, and one day later, I swapped out 18 of 30 positions.
September was all about interest rates and oil. Brent rose above $100 in the second week and, following a Saudi pipeline outage, briefly hit $110. U.S. inflation stood at 3.4 percent in August. On September 16, the Fed raised the benchmark interest rate by a quarter point to 3.75 to 4.00 percent, for the first time since July 2023. The 10-year U.S. yield subsequently climbed to 5.19 percent, a level last seen in 2007. This hardly bothered tech stocks. The Nasdaq hit a record high on September 21, and AMD has been worth one trillion dollars ever since. The situation was different in Europe. German inflation jumped to 3.3 percent, and the DAX lost about four percent over the month.
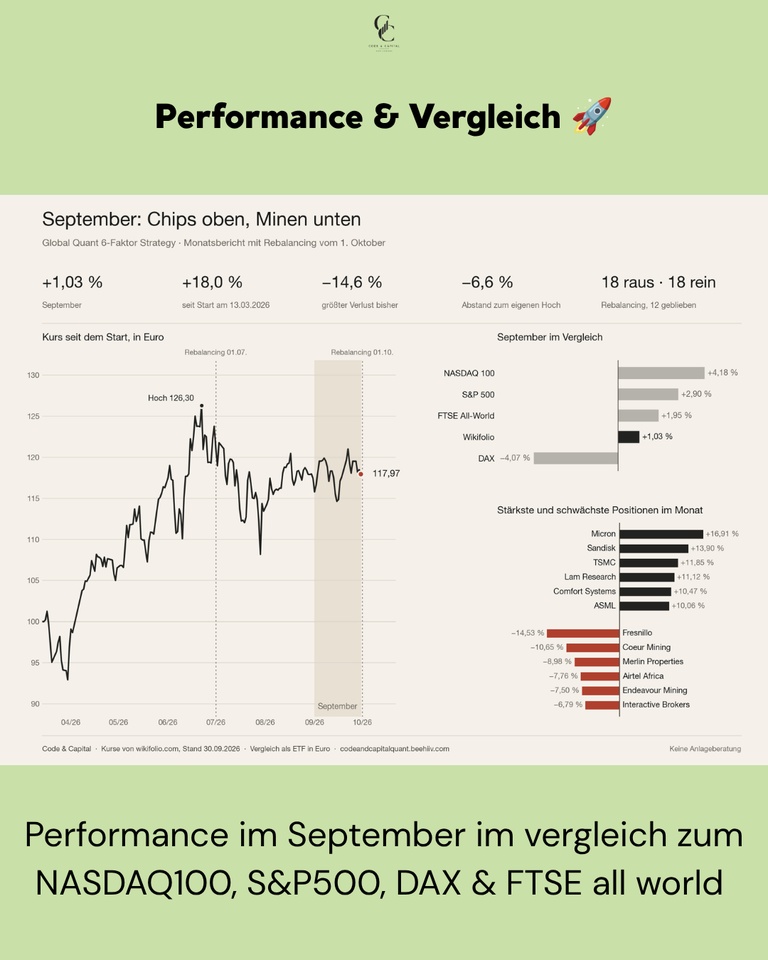
📊 Monthly performance: +1.03%
📊 Price as of September 30: €117.97
📊 Largest loss since inception: −14.6%
📊 Max performance: +18% (since March 13, 26)
Next rebalancing: Early January 2027
Performance & Comparison 🚀
The U.S. indices posted clear gains when calculated in euros, with the Nasdaq leading the way. The Wikifolio did not keep pace. It lagged behind the Nasdaq, S&P 500, and FTSE All-World, and outperformed only the DAX.
Performance Comparison (September 1–30, 2026, end of day):
Global Quant 6-Factor: +1.03%
NASDAQ 100: +4.18%
S&P 500: +2.90%
FTSE All-World: +1.95%
DAX: −4.07%
You can see what caused this in the two lists below. Tech stocks delivered, while mining stocks and a few individual stocks ate up a good chunk of those gains.
Purchases & Sales 💶
None in September itself. The model trades only on four dates per year, and the third was on October 1. What happened then is detailed in its own section below.
Top Movers in September 🟢
The month belonged to semiconductors and memory stocks. Midway through the month, Intel’s CEO said the company could currently only meet about half of the demand for processors. After that, the entire industry picked up steam. Micron
$MU (+0,01%) topped the list with +16.91%, followed by SanDisk
$SNDK (-1,76%) at +13.90% and TSMC
$2330 at +11.85%. Lam Research
$LRCX (-0,69%) rose +11.12%, ASML
$ASML (-0,24%) +10.06%. In between is Comfort Systems $FIX (+0,1%) , a stock that has nothing to do with chips, up 10.47%. In August, Comfort Systems was still among the losers.
September’s Big Losers 🔴
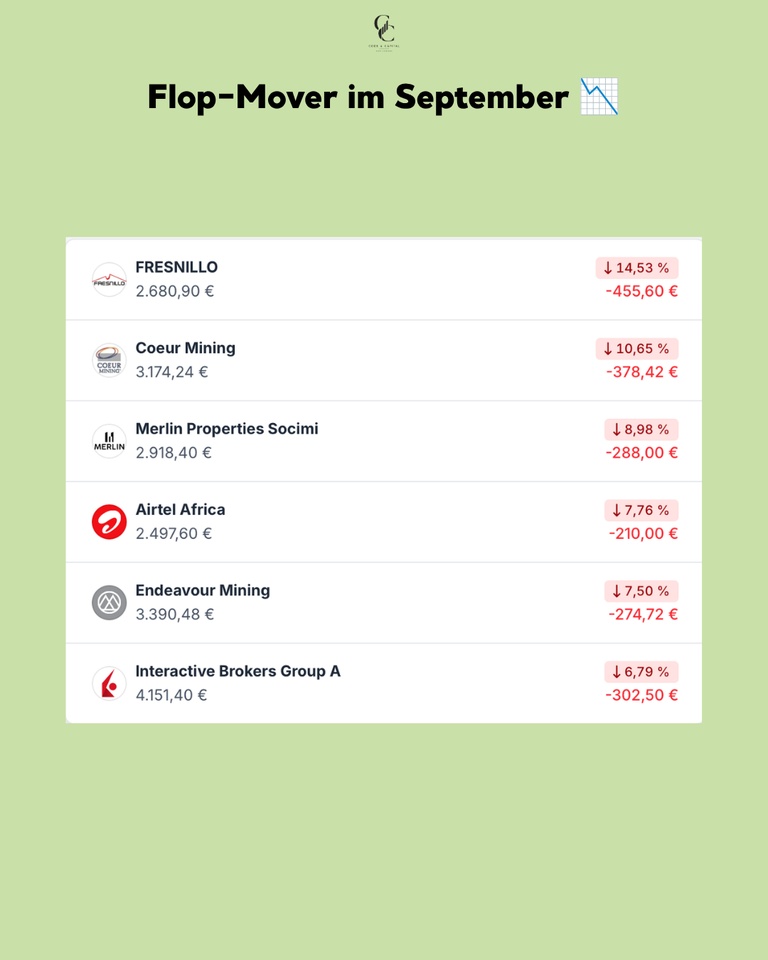
Gold and silver declined in September, with silver falling much more sharply. Rising yields and a stronger dollar weighed on prices. Mining stocks followed suit. Fresnillo
$FRES (+0,58%) lost −14.53%, Coeur Mining
$CDE (-0,33%) −10.65%, and Endeavour Mining $EDV (-0,43%) -7.50%. In August, all three were still on the other list with gains of over 25 percent. Merlin Properties fell −8.98%, Airtel Africa
$AAF (+0,61%) down 7.76%, and Interactive Brokers
$IBKR (+0,24%) fell by 6.79%.
Rebalancing on October 1 🔄
On October 1, the third rebalancing since the start took place. I swapped out 18 of 30 positions—more than ever before. In July, it was nine.
All nine banks are out: Bankinter
$BKT (-0,32%) , CaixaBank
$CABK (-0,16%) , BBVA
$BBVA (-0,21%) , UniCredit
$UCG (-0,69%) , BPER
$BPE (-0,19%) , Monte dei Paschi $BMPS (+0,26%) , Banca Mediolanum
$BMED (-0,09%) , Swedbank$SWED A (+0,69%) and HSBC
$HSBA (+0,13%) . In addition, Interactive Brokers $IBKR (+0,24%) , Antofagasta $ANTO (+0,03%) , Coeur Mining
$CDE (-0,33%) , AppLovin
$APP (+0,04%) , Airtel Africa
$AAF (+0,61%) , Merlin Properties and Solaria
$SLR (-2,43%) . Investor AB
$INVE B (-0,93%) and Pershing Square
$PSH (+0,42%) are also no longer in the portfolio. So four of the six underperformers listed above are no longer in the portfolio.
Six stocks from the healthcare sector were added: Eli Lilly
$LLY (+0,13%) , Bristol-Myers
Squibb
$BMY (+0,65%) , Vertex $VRTX , Incyte
$INCY (+0,41%) , Illumina
$ILMN (+0,19%) and WuXi AppTec
$603259 . Five are from the semiconductor and storage sectors: Seagate
$STX (+0,41%) , Marvell
$MRVL (-0,98%) , Applied
Materials
$AMAT (-0,77%), Teradyne
$TER (-0,76%) and KLA
$KLAC (-1,61%) . The rest is split among Fortinet
$FTNT (+1,71%) , CF Industries
$CF (-0,64%) , Marathon Petroleum
$MPC (+0,03%) , APA
$APA (+0,29%) , Pop Mart $9992 (-0,61%) , Hong Kong Exchanges
$388 (-0,77%) and Lion Finance
$BGEO (+0,6%) .
Twelve remain: SanDisk, Micron, Western Digital, Nvidia, Lam Research, TSMC, ASML, Alphabet, Comfort Systems, Fresnillo, Endeavour and Newmont. All six of September’s top movers are included.
Two names stand out. Applied Materials and KLA I sold on July 1, up 92 and a gain of 90 percent. Now both are back in my portfolio. The model doesn’t remember what it has sold in the past. It only looks at where a stock stands in the ranking today.
Conclusion 💡
The portfolio looks different after October 1 than it did before. In September, about 41 percent was still in financial stocks; now there are two positions out of 30. Instead, 12 out of 30 are in semiconductors and memory, and six are in the healthcare sector. There’s no sector limit; the model sorts by score, not by industry. Trading won’t resume until early January.
How was your September? And did you hold onto your stocks after the pullback, or did you sell them? 👇
➡️ Every month, you’ll find the complete Wikifolio update here, along with research in between.
📈 Wikifolio $DE000LS9V052 (+0,07%)

+ 1
88
8 Comentários
1Mês
What are the CAGR and Sharpe ratio of your strategy?
•
11
•
1Mês·
🏦 New Position Opened: UniCredit
Yesterday, I opened a long position in $UCG (-0,69%) and added it to my Blue Chip Fibonacci Portfolio.
UniCredit is one of Europe's leading banking and financial services stocks, serving millions of customers across Italy, Germany, and other European markets.
From a valuation perspective, the stock still appears reasonably priced compared to many other sectors, despite its strong performance over the past few years. While the banking sector remains sensitive to economic conditions and interest rates, I believe high-quality banks can continue to create value over the long term.
I'm looking forward to seeing how this investment performs over the coming months and years.
#trading
#long
#ucg
#unicredit
#stocks
#banking
#financials
#europeanbanks
#bluechipfibonacci
#italy
#mikeupegui
44
5 Comentárioscould you post your portfolio?
••
2Mês·
🕖 Six Months of Global Quant 6-Factor
The strategy was launched on March 13. It has been tradable as a certificate since June 9. Today, it’s up 18.3 percent, and that number doesn’t tell the whole story.
📊 Where the strategy stands today
Up 18.3 percent since launch, up 7.5 percent over the last three months, and up 1.8 percent over the last month. The largest intraday loss was 14.6 percent. A total of 4,259 euros is invested across 44 watchlist entries. One number is almost never included in such overviews: the strategy’s highest level was 126 points; it currently stands at 118.3. So the strategy is a good six percent away from its own high. The 18.3 percent gain mentioned above isn’t a record high, but rather a recovery. What sounds like a quiet half-year actually had a pretty rough summer.
📉 July
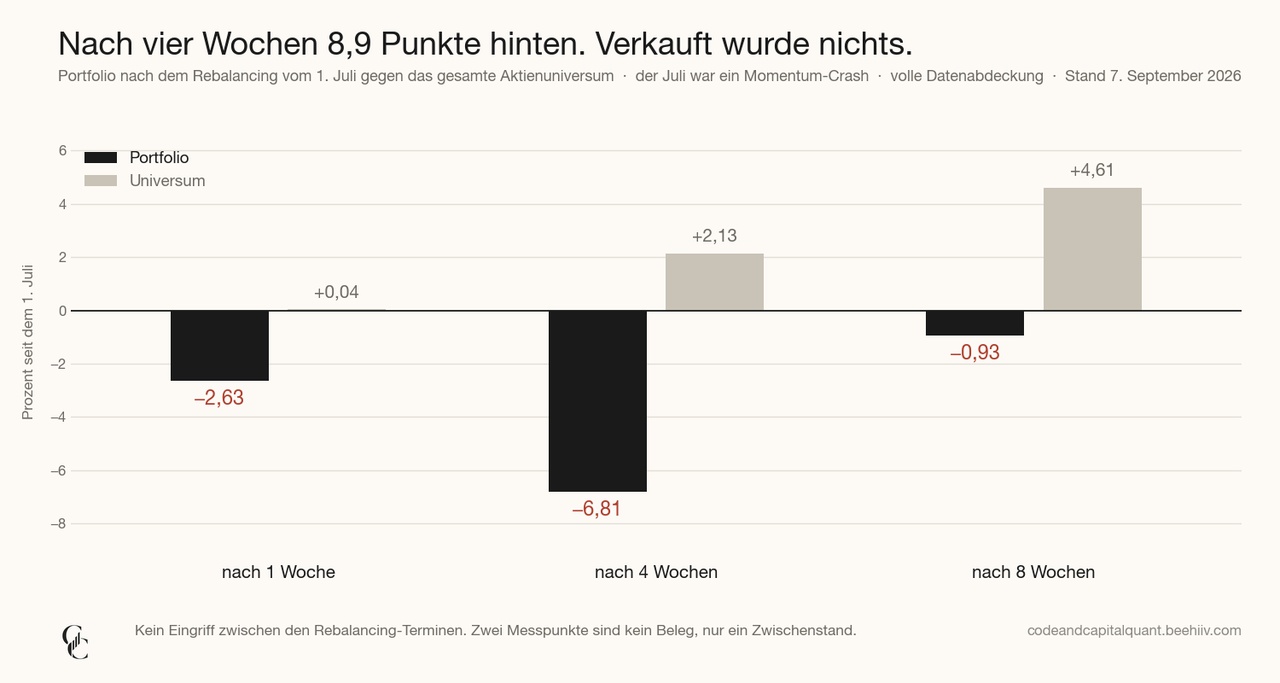
In July, I realized for the first time what the difference is between a backtest and real money. The second rebalancing took place on July 1. After that, the portfolio went down. I track how the purchased portfolio performs against all 843 stocks in my universe, equally weighted. After four weeks, the portfolio was down 6.81 percent. The benchmark stood at plus 2.13. A lag of nearly nine points in four weeks.
That was the momentum crash. What had been performing well before suffered the sharpest decline. Momentum is one of my six factors. A portfolio selected based on this factor is bound to underperform an equally weighted benchmark during such a phase. In backtesting, I’ve seen such stretches multiple times. Still, reading about them is quite different from watching them unfold every morning for four weeks.
I did nothing. Not because I’m disciplined, but because the rule doesn’t call for any intervention. Nothing happens between two scheduled reviews, no matter what’s in the portfolio. After eight weeks, the shortfall had shrunk to 5.5 points. The recovery came when the market turned. If I had sold at the end of July, the loss would have been locked in, and the recovery would have passed me by.
💶 The portfolio after six months
Of the 30 positions, 14 are still from the first day in March. Seven were added in April, and nine in July. Two rebalancings, and nearly half remains unchanged. By weight, about 41 percent is in financials, just under 30 percent in semiconductors and memory, and just under 13 percent in mining stocks. I didn’t set any of these limits myself. The model doesn’t target specific sectors. They’re included because they currently combine favorable valuations with strong momentum. In July, the portfolio rotated out of chip stocks—which had become expensive—into European banks. For the chips, earnings were no longer keeping pace with the stock price; for the banks, it was the other way around. Bankinter $BKT (-0,32%) , CaixaBank $CABK (-0,16%) , BPER $BPE (-0,19%) , Monte dei Paschi $BMPS (+0,26%) and Swedbank $SWED A (+0,69%) are now all side by side in my portfolio. I never had a strong opinion on European banks.
🔁 Let the winners run
Micron $MU (+0,01%) is the perfect example of how this strategy works. I bought it with a 3.3 percent weighting; today it’s at 6.6 percent. I don’t rebalance between trading sessions. Winners stay big; losers get smaller. Compared to a strategy that resets every position to the same weight, this approach yielded 1.86 points last quarter. One quarter isn’t much, but the trend aligns with what the backtest shows.
🔄 On October 1
In the third rebalancing, about half the portfolio changes—15 stocks out and 15 in. Significantly more than last time. The mining stocks are almost entirely out—namely, Antofagasta $ANTO (+0,03%) , Coeur $CDE (-0,33%) , Endeavour $EDV (-0,43%) and Newmont $NEM (+0,83%) . Gold and copper have performed strongly since the spring, and that’s exactly what’s making the stocks in the model expensive. The main additions are refiners and semiconductor companies. I’ll list the exact stocks after the rebalancing. I find it more interesting to see what’s happening with the banks. In July, the model rotated out of expensive chip stocks into European banks. Now it’s rotating back into some of them—Bankinter $BKT (-0,32%) , Swedbank $SWED A (+0,69%) and UniCredit $UCG (-0,69%) are on the sell list. Not because they’ve underperformed—all three are in the black. They’ve risen and thus become more expensive, and that’s enough for the model. This is where a system like this seems least intuitive. It doesn’t sell because something is performing poorly. It sells because something is no longer cheap.
💡 What Six Months Don’t Tell You
Two rebalancings are two data points. The third comes on October 1—only then does a trend even begin. The backtest over six and a half years tells one thing; six months of live trading tell another—and I don’t know today just how far apart those two will diverge.
What I’ve learned after half a year is more valuable than any return figure. A rule set in advance takes the decision out of your hands at the very moment when you’d be least capable of making it.
❓ Did you stick with your strategy in July, or did you rebalance? And do you work with fixed rules, or do you decide on a case-by-case basis?
👇 Let us know in the comments!
➡️ Every month, you’ll find the full Wikifolio update here, along with research from the model in between.
🗞️ Newsletter: codeandcapitalquant.beehiiv.com
📈 Wikifolio: https://www.wikifolio.com/de/de/w/wf0gquant6
Not investment advice; our own research. Past performance is not indicative of future results.
66
3Mês·
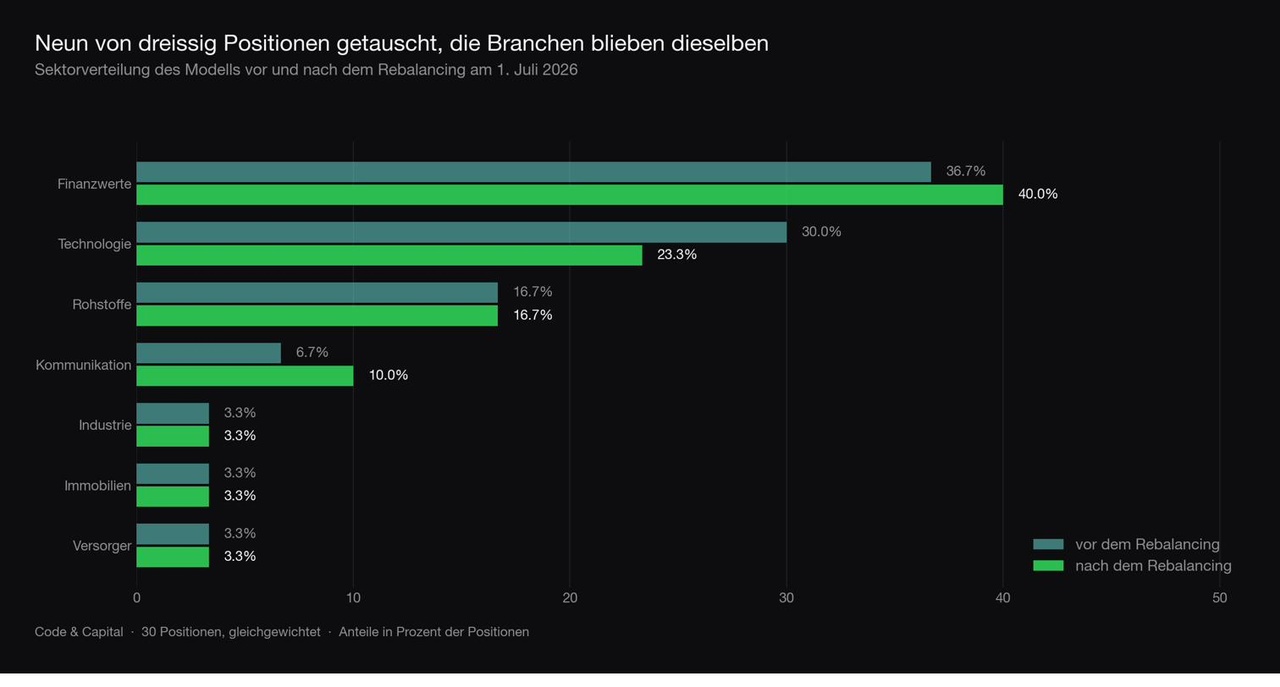
Nine out of thirty positions have changed—and the sector picture has hardly changed at all
On July 1, the second rebalancing of my Wikifolio took place—a rule-based portfolio with 30 equally weighted positions that has been running since March 13. Nine positions out, nine in. I had expected this to shift the structure. When I checked the numbers, almost everything was the same as before.
A quick note on how it works
A Python scanner evaluates approximately 845 stocks from 14 indices daily based on six factors. Those that make it into the top 25 are purchased. Those that fall below rank 40 are removed. Quarterly adjustments, no sector allocation, no discretion.
What was dropped:
- 4 tech stocks: Applied Materials $AMAT (-0,77%) (+92%), KLA-Tencor $KLAC (-1,61%) (+90%), Broadcom $AVGO (-1,82%) , Amphenol $APH (-0,82%). Not because of earnings, but because the valuation could no longer keep up with the share price and the stock’s ranking plummeted.
- 5x Finance: ING $ING (-0,33%), Jyske Bank $JYSK (+0,07%), Unicaja $UNI (-0,23%), Baader Bank $BWB (-0,29%), Nu Holdings $NU (+3,08%).
New additions:
- ASML $ASML (-0,24%), Alphabet $GOOG (+1,04%), SanDisk $SNDK (-1,76%), Investor AB $INVE B (-0,93%), BBVA $BBVA (+0,04%), UniCredit $UCG (-0,69%), Monte dei Paschi $BMPS (+0,26%), Banca Mediolanum $BMED (-0,09%), Swedbank $SWED A (+0,69%).
The interesting part
Micron $MU (+0,01%) stayed in the portfolio, up over 100 percent. The score held, and the ranking remained higher. A system that sells based on profit would have kicked Micron out first. The model treated these three big winners completely differently because it doesn’t know the purchase price at all.
And on the other hand:
SanDisk $SNDK (-1,76%) was added that same evening, at 1,820 euros. The stock had already been on the buy list in April but wasn’t tradable at the time. Today, the position is down about 50 percent. The timing could hardly have been worse.
The sector breakdown before and after
Technology fell from 30 to 23.3 percent, financials rose from 36.7 to 40. Materials remained at 16.7.
A factor model does not distinguish between sectors. It sorts by score, and stocks in the same sector often receive similar scores because they are influenced by the same drivers. If one falls below rank 40, there is a high probability that another from the same sector is ready to take its place in the top 25. The model captures gains and returns to the same sector, just with different names.
My Conclusion
One quarter doesn’t prove anything. I don’t have a sector cap in the model because my backtest doesn’t have one either.
Next rebalancing: October 1.
Who among you uses a rule-based approach and has a sector cap in place?
I’m curious to know what percentage cap you use.
44
2 ComentáriosHello, may I ask what factors are used to calculate the ranking and how you select the stocks from the indices before analyzing them? I generally find the momentum strategies discussed on the platform very interesting.
•
11
•3Mês·
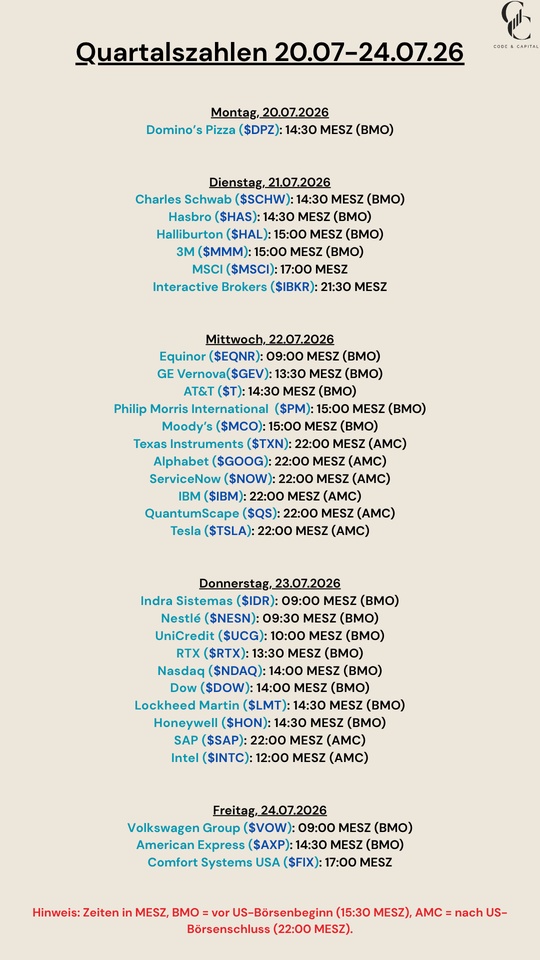
Quarterly Results: July 20–24, 2026
$DPZ (+1,49%)
$SCHW (-0,23%)
$HAS (-0,4%)
$HAL (+1,07%)
$MMM (+0,12%)
$MSCI (-0,03%)
$IBKR (+0,24%)
$EQNR (+0,04%)
$GEV (+1,63%)
$T (+0,67%)
$PM (+0,31%)
$MCO (+0%)
$TXN (-0,53%)
$GOOG (+1,04%)
$NOW (+0,7%)
$IBM (-0,11%)
$QS (+0,28%)
$TSLA (+1,17%)
$IDR (+1,05%)
$NESN (+0,55%)
$UCG (-0,69%)
$RTX (+0,53%)
$NDAQ (+0,2%)
$DOW (+0,37%)
$LMT (+0,24%)
$HON (+0,1%)
$SAP (+1,19%)
$INTC (-1,4%)
$VOW (-0,22%)
$AXP (+0,83%)
$FIX (+0,1%)
1010

4Mês·
Why should I care about what I said yesterday?
70 percent of my portfolio is $NVDA (+2,36%) —I’ve never really cared about that before. “I’ll hold onto this at least until 2030” was my motto. Because I consider it one of the best stocks in the world.
And what did I do yesterday? I sold 20 percent of the position and added three new stocks to my portfolio: $SAP (+1,19%)
$UCG (-0,69%)
$MUFG (-0,5%)
Why?
Because I think the risk is too high that meme stocks like SpaceX will first suck up all the money and then cause the bubble (which we’ve identified) to burst in a way that drags down fundamentally sound stocks as well.
And because I’m too old for that kind of crap: diversify.
Sure, the concentration is still huge, but it’s a start. If the madness on the stock market continues to drive the herd, I’ll keep selling off NVIDIA, but not everything. I’ll keep 40 percent.
I actually wanted to pick up something in the healthcare sector, but couldn’t find anything attractive.

2020
9 Comentários
A very good decision. And right away, large sums were reinvested in a few strong companies. That's the way to do it!
In the healthcare sector, maybe Stryker. It's a good compounder. And it's currently relatively undervalued.
In the healthcare sector, maybe Stryker. It's a good compounder. And it's currently relatively undervalued.
•
55
•
6Mês·
Offer to convert Commerzbank for Uni Credit from ING
Hello everyone.
My girlfriend still owns some $CBK (+0,2%) shares.
She has now been offered an exchange for $UCG (-0,69%) shares from ING.
However, the letter offers an exchange ratio of 1 to 0.485.
If I now apply my rudimentary knowledge of calculators, the exchange factor should be 1 to 0.521.
Since the ING offer gives you fewer shares of $UCG (-0,69%) this would be a minus transaction in purely mathematical terms if my friend were to convert.
Or am I making a blatant error in my thinking?
Regards Carsten
11
9 Comentários
The provider just wants to record something. It's almost certain that it's not Unicredit directly behind the offer, but someone else....
•
11
•6Mês·
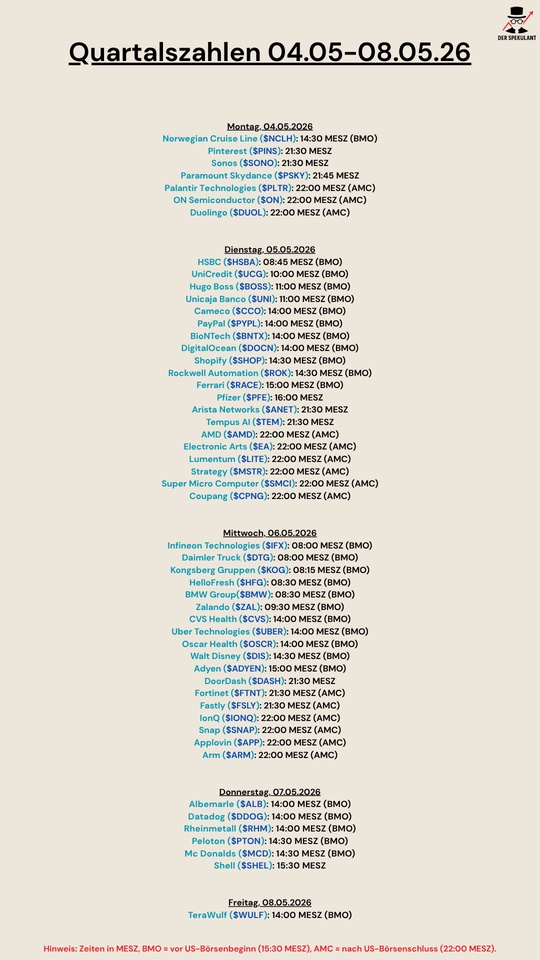
Quarterly figures 04.05-08.05.26
$NCLH (-0,57%)
$PINS (+0,29%)
$SONO (+0,34%)
$PARA (+0,6%)
$PLTR (+0,48%)
$DUOL
$HSBA (+0,13%)
$UCG (-0,69%)
$BOSS (+1,51%)
$UNI (-0,23%)
$CCO (+1,02%)
$PYPL (-0,52%)
$BNTX (-0,87%)
$DOCN (+0,26%)
$SHOP (+0,79%)
$ROK (+0,53%)
$RACE (+0,12%)
$PFE (+0,06%)
$ANET (-0,09%)
$TEM (+0,95%)
$AMD (-1,37%)
$EA
$LITE (-0,51%)
$MSTR (-1,01%)
$SMCI (-0,12%)
$CPNG (+0,6%)
$IFX (-1,13%)
$DTG (+0,85%)
$KOG (-1,09%)
$HFG (+3,41%)
$BMW (+1,14%)
$ZAL (+1,34%)
$CVS (+0,75%)
$UBER (-0,18%)
$OSCR (+1,89%)
$DIS (+0,52%)
$ADYEN (-0,28%)
$DASH (+0,54%)
$FTNT (+1,71%)
$FSLY (+2,72%)
$IONQ (-0,93%)
$SNAP (+0,05%)
$APP (+0,04%)
$ARM (-0,61%)
$ALB (+0,29%)
$DDOG (+2,05%)
$RHM (-1,82%)
$PTON (-0,39%)
$MCD (-0,1%)
$SHEL (+1,17%)
$WULF (-0,72%)
1212
Títulos em alta
Principais criadores desta semana
Dados tempo real da LSX · Dados financeiros e EOD da FactSet