

(This is not investment advice!)
$AAPL (+5,08%)
$MSFT (+6,14%)
$NVDA (-4,21%)
$AMZN (+5,68%)
$GOOGL (+2,55%)
$META (+0,32%)
$TSM (-6,12%)
$GEV (-12,18%)

Postos
1.426(This is not investment advice!)
$AAPL (+5,08%)
$MSFT (+6,14%)
$NVDA (-4,21%)
$AMZN (+5,68%)
$GOOGL (+2,55%)
$META (+0,32%)
$TSM (-6,12%)
$GEV (-12,18%)

Hey,
It feels like I wrote the last report just yesterday. But October is actually already over. The vet bill is paid, my birthday is over, and now we’re heading toward Christmas.
📈 Performance:
S&P 500: +0.27%
MSCI World: +0.05%
DAX: +2.46%
Dividend portfolio: +5.25%
My top and bottom performers in October were (Top 3/Bottom 3):
🟢 ($IMB (+0,66%) ) Imperial Brands +23.27%
🟢 ($LLY (+1,57%) ) Eli Lilly +21.79%
🟢 ($AMT (+3,73%) ) American Tower +18.29%
🔴 ($2768 (+0,43%) ) Sojitz -9.08%
🔴 ($ADM (+0,3%) ) Archer Daniels Midlands -10.53%
🔴 ($RIO (+3,24%) ) Rio Tinto -11.70%
Dividends:
October 2026: €151.60
October 2025: €96.89
Change: +56.47%
Sales:
🟥 None
Purchases:
🟩 ($Z74 (+1,53%) ) Singapore Telecommunications (€1,014)
🟩 ($DTE (+4,23%) ) Deutsche Telekom (€239)
Investment plans:
($MSFT (+6,14%) ) Microsoft (€25)
What else happened?
Apart from the vet and my birthday, nothing. October was actually very quiet, so I took the time to get my finances up to date and, most importantly, do some calculations for the future to figure out what I need to save or pay, when, where, and how. There’s nothing like good financial planning.
🥅 Goals for 2026:
I’m trying to reach €85,000 in my dividend portfolio this year. Currently, I’m at around €86,140. I’m expecting about €364 in net dividends this year (according to getquin).
So I’ve already hit my goal.
I’m curious to see how things will go from here and am keeping one eye on the €90,000 mark.
If you enjoyed this post and would like to read more like it, feel free to follow me;
if you’re not interested, feel free to scroll past or use the block feature.

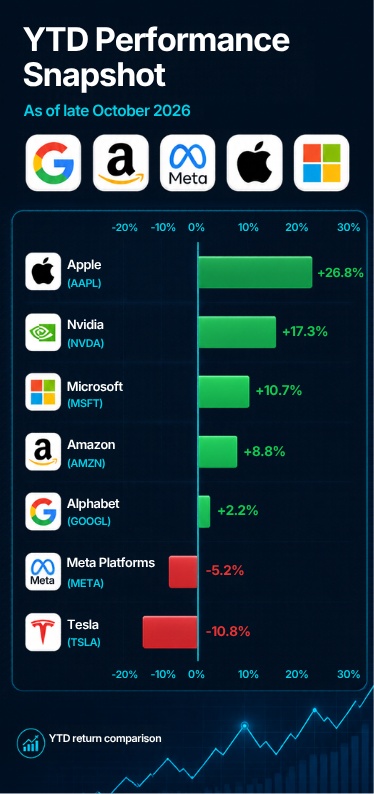
Mag7 in stock market 2026 • $AAPL (+5,08%) , $NVDA (-4,21%) , $MSFT (+6,14%) , $AMZN (+5,68%) , $GOOG (+2,56%) , $META (+0,32%) , $TSLA (-5,71%) still makes more high return performance to get large market cap. Its a reason they have cycle frame time for market position and many time to get split stock season makes be better performance every years.
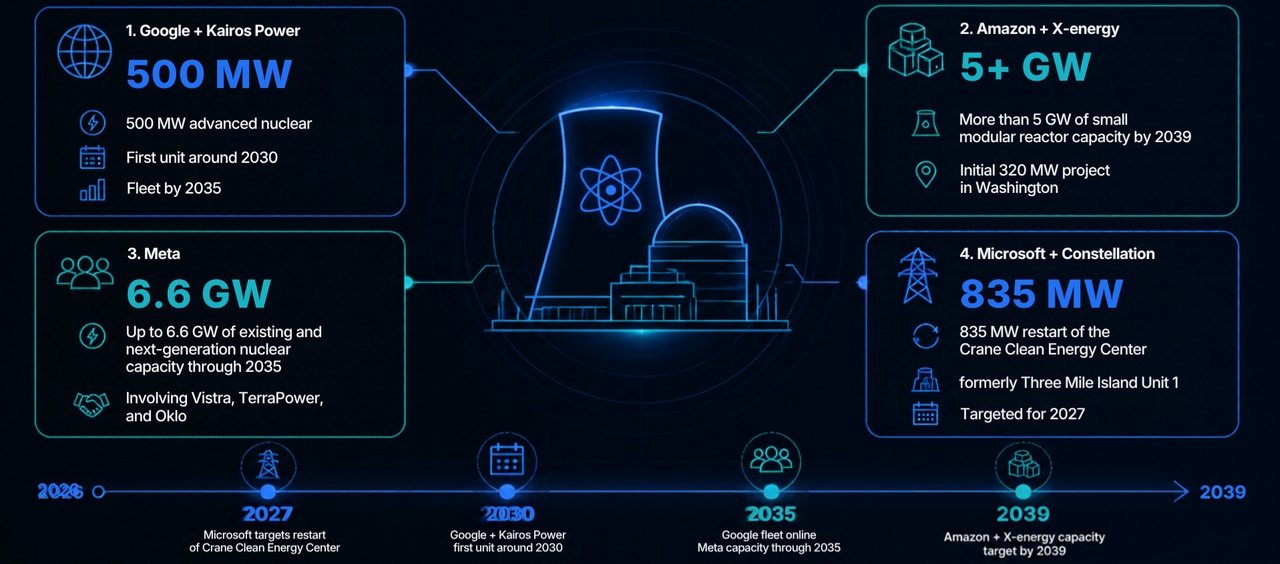
• Energy power and Data center get additional part in new projection for strategy in market business.
• ✅️ check point for S&P 500 market index run to 10,000 high price in position (2.400 point) from now around 7,600. Its momentum get to fast with market trends ■ 2027-2028-2029.
Software-as-a-Service
AI Agents
Moats
Data Platforms
Cloud Infrastructure
Earnings & Revenue
Valuation & Market Sentiment
Adobe $ADBE (+1,01%)
IBM $IBM (+1,84%)
Microsoft $MSFT (+6,14%)
Nemetschek $NEM (+3,04%)
Palo Alto $PANW (-0,37%)
Salesforce $CRM (+2,61%)
SAP $SAP (+3,64%)
TeamViewer $TMV (+2,91%)
Atea Provides the IT Infrastructure for Scandinavia's Digital Transformation and Benefits from AI and Defense Spending
We were once again exploring Scandinavia as part of our stock search.
While getting together with friends and neighbors here in Denmark, the conversation turned to companies from the North that don’t get much attention on the stock market, even though there’s a lot going on in their businesses.
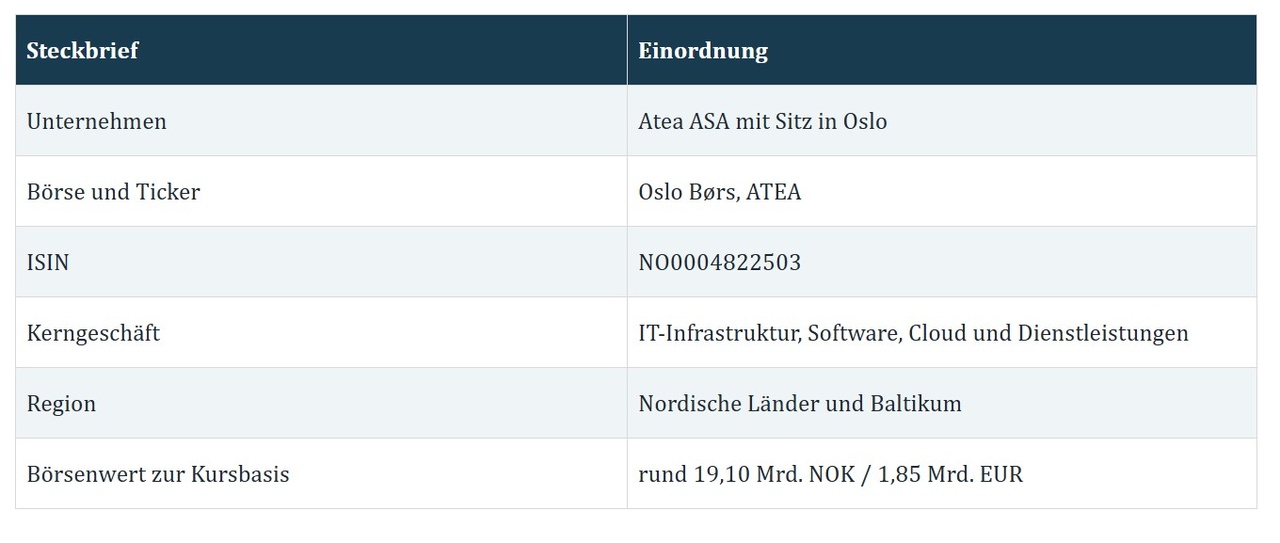
One name came up that I’d barely noticed before: Atea. $ATEA (+2,06%)
After taking a look at the company and its figures from October 22, I thought to myself: We should take a closer look at this candidate.
Atea makes its money from the IT that companies, government agencies, and—increasingly—defense organizations actually need.
It’s precisely the combination of AI infrastructure, IT security, and regular dividends is what I find particularly exciting.
Whether this turns out to be a good buy, however, depends on the margins, cash flow, and entry price.
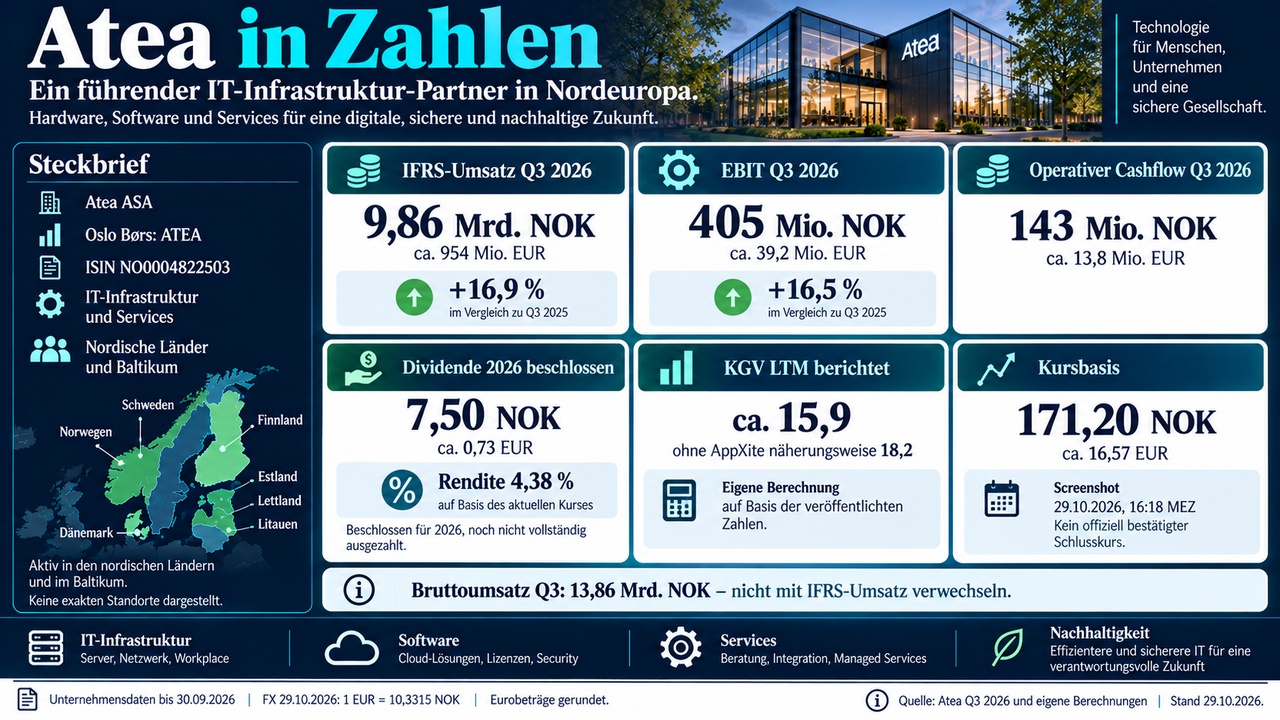
Data as of October 29, 2026. Price basis for the calculations: 171.20 NOK, approximately 16.57 EUR. Sources are listed at the end and in the respective sections.
1 Business Model and History
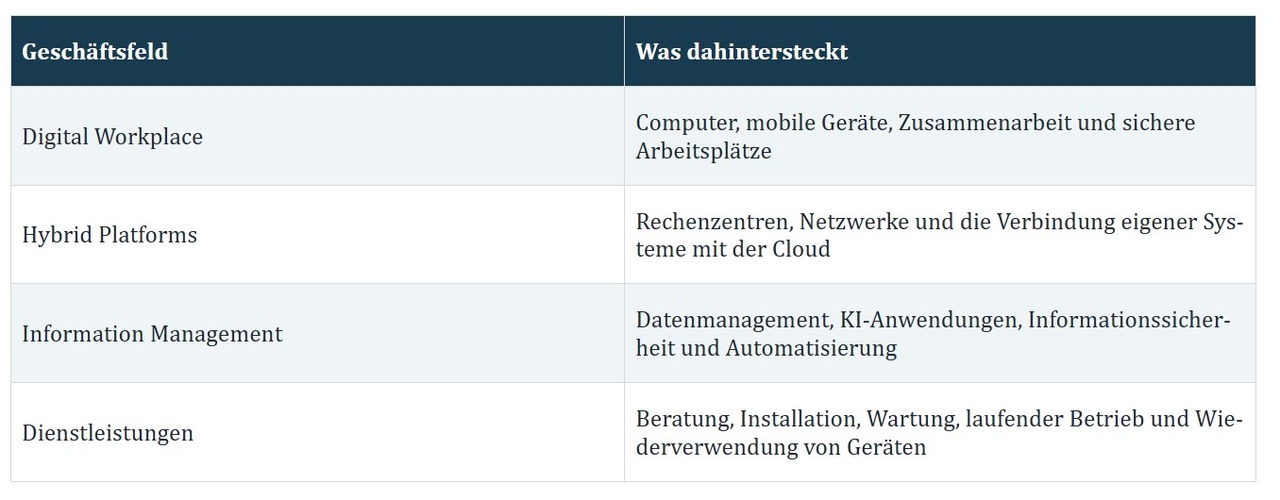
When a government agency sets up new workstations, a hospital upgrades its IT, or a company needs to integrate servers, networks, and data security, Atea can handle the planning, procurement, installation, and operation.
The technology comes primarily from manufacturers such as Microsoft $MSFT (+6,14%) , Cisco $CSCO (-0,63%) , HP $HPQB34 , HPE, Dell $DELL (-12,22%) , Lenovo, or Apple $AAPL (+5,08%) .
Atea generates revenue by selecting the right products, integrating them, and providing support throughout their lifecycle.
Its roots date back to 1968. That was when Merkantildata was founded in Norway.
The early IT provider evolved into a larger infrastructure and services group, which went public on the Oslo Stock Exchange in 1985. In the 1990s, the company grew through numerous acquisitions. In 2003, Merkantildata and the Eterra and Ementor divisions were merged under the name Ementor.
Today’s Atea took shape primarily in 2006:
Ementor merged with the Danish IT provider Top Nordic and subsequently acquired the Swedish company Atea. In 2007, the Baltic Sonex Group was added.
Since 2009, the group has been known collectively as Atea. More than 50 additional acquisitions strengthened the network in the core markets.
This explains why Atea maintains such a strong local presence to this day. The group combines long-standing customer relationships in individual countries with shared procurement, logistics, and expertise. Today, it has a presence in 88 cities and employs more than 8,000 people.
The leadership has also been familiar with the business for a long time:
Steinar Sønsteby joined the company in 1997, led the Norwegian and Swedish operations, among others, and has been CEO since 2014. A single, romantic “founder’s story” would therefore not do justice to Atea’s origins. Above all, it is the story of several regional IT companies that have gradually grown together.
2 Market Position and Moat
Atea describes itself as the leading IT infrastructure provider in the Nordic and Baltic countries and cites a market share of around 20 percent. This is a figure provided by the company; it does not represent a share of the global IT market.
This scale is an advantage in procurement and complex bidding processes. Local expertise and experience with existing customer systems also cannot be replaced overnight.
According to the company, about 70 percent of sales go to the public sector.
This creates long-term demand but also makes Atea dependent on budget decisions and procurement processes.
A broad public customer base does not mean that a single customer accounts for 70 percent. Reliable figures for the top 5 or top 10 customers are not reported in the reviewed documents.
My assessment: a strong regional position with practical competitive advantages.
However, manufacturers retain significant control over products, terms, and distribution.
The bidding process for the next contract remains competitive.
3 Core Quality Formula
The formula links revenue growth and operating margin. For Atea, one must use the same definition of revenue: IFRS revenue for both growth and margin. Combining the higher currency-adjusted gross revenue growth with an IFRS margin would be methodologically flawed.
This is a steadily growing IT service provider with a retail business and a narrow profit margin. The formula also shows why I wouldn’t equate Atea with a high-margin software company. Gross profit rose by only 2.0 percent in Q3. So, selling more hardware does not automatically mean a corresponding increase in the company’s own value creation.
The nine-month margin is based on 1,049 million NOK in adjusted EBIT.
The reported 1,201 million NOK additionally includes 152 million NOK from AppXite. Own calculations based on the quarterly report.
4 Cash Flow Quality Formula
This is where I see the most important area for improvement. Profits are encouraging; in the long term, they must translate into freely available cash. In Atea’s business, inventory and the payment terms of customers and suppliers temporarily tie up significant amounts of capital.
Operating cash flow for the last twelve months amounts to approximately 91.47 million EUR, while simple FCF is approximately 48.30 million EUR.
The company’s FCF is higher because Atea includes proceeds from asset sales in its net investments.
Business sales are not included in these FCF figures.
The simple cash conversion ratio is thus only about 41 percent: 499 million NOK in FCF divided by 1,219 million NOK in reported net income for the last twelve months.
This profit also includes the AppXite effect. After an additional NOK 431 million in lease payments, only about NOK 68 million
remained on paper—approximately EUR 6.58 million. This is an additional internal cash analysis, not an official FCF metric.
The fourth quarter is particularly important from a seasonal perspective. In 2025, it alone generated nearly 1.98 billion NOK in operating cash flow. A recovery is therefore plausible, but not yet warranted. In addition, Atea sells receivables through a securitization program; as of September, these totaled 1.88 billion NOK. This financing must also be taken into account when assessing cash flow quality. My assessment remains cautious here.
5 Dividend Filters
The approved dividend for 2026 totals 7.50 NOK per share, or about 0.73 EUR. Half was paid in May, and the other half is scheduled for November. Based on the current share price, this results in a gross yield of 4.38 percent.
From 2021 through the scheduled 2026 distribution, this corresponds to approximately 8.4 percent annual growth. This sequence includes four increases and one year with no change; the 2026 dividend has not yet been paid in full. The longer history has not been consistently upward: in 2019, 6.50 NOK was paid, and in 2020, only 5.00 NOK.
Atea generally aims for a payout of about 70 to 100 percent of net income. The 7.50 NOK corresponds to approximately 95 percent of the undiluted earnings per share for 2025. At the same time, actual cash payments over the past twelve months—totaling approximately 808 million NOK—exceeded the company’s free cash flow (FCF) of 526 million NOK, representing about 154 percent. An attractive track record is no substitute for a coverage analysis in this context.
For Norwegian tax purposes, Atea classifies the distribution as a repayment of paid-in capital. This does not imply blanket tax exemption for investors in other countries. My verdict: a welcome distribution, but with a limited earnings buffer and currently weak cash coverage.
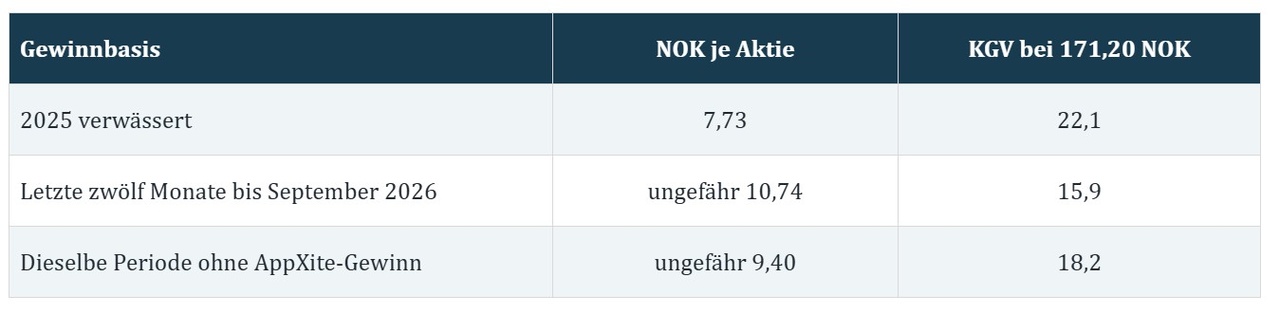
6 P/E
The last line is my own estimate: The tax-free AppXite profit of 152 million NOK is calculated per share using the diluted average number of shares for the nine-month period. Different weighted share counts also make the rolling EPS calculation slightly imprecise.
An adjusted P/E ratio of 18 is reasonable for an established company with growth and dividends. I don’t yet see this as an obvious bargain. In any case, I wouldn’t report the lower P/E ratio of about 16 without accounting for the one-time effect.
7 P/B
Calculation on a twelve-month basis Earnings
Market capitalization approx. 19.10 billion NOK / operating cash flow 945 million NOK = KCV 20.2
Market capitalization / company FCF 526 million NOK = Price-to-FCF ratio 36.3
Company FCF / Market Capitalization = FCF yield 2.75%
The KCV is the ratio to operating cash flow. The ratio to free cash flow is a different metric and is therefore reported separately. Both indicate that, based on the most recent actual cash inflows, the stock is valued at a higher premium than it would be based on reported earnings. A strong Q4 cash flow recovery could improve this picture. Until then, it remains an expectation.
9 P/B Ratio and Balance Sheet
Key figure as of September 30, 2026 / Value
Equity: 4.14 billion NOK / 400.33 million EUR
P/B ratio based on share price = 4.62
Net debt as defined by the credit agreement = 1.35 billion NOK / 130.57 million EUR
Net debt to pro forma EBITDA under the covenant = 0.6
At first glance, the debt ratio appears comfortable. However, the company’s definition excludes additional IFRS 16 lease liabilities of approximately 1.42 billion NOK. It therefore does not provide a complete picture of all financial obligations.
Equity is also not a solid safety buffer: The goodwill of 4.22 billion NOK already slightly exceeds total reported equity. While this can occur after numerous acquisitions, it makes the book value less useful as a valuation anchor. The liquidity reserve of NOK 4.76 billion cited by Atea is primarily an accounting measure of debt capacity up to the covenant limit and does not represent an actual cash balance in the account.
10 Current Figures and Catalysts
The announcement on October 22, 2026 shows a positive operational trend.
Demand for data center hardware is particularly important.
Gross revenue reflects the larger volume of business sold. For parts of the software and services business, Atea recognizes only its own brokerage services as revenue under IFRS. Therefore, the figures of 13.86 and 9.86 billion NOK are not contradictory.
Defense IT: During the earnings call, management cited currency-adjusted growth of nearly 40 percent in this customer segment. As early as November 2025, an NCIA contract with an estimated total value of approximately 130 million EUR over four years was announced. The current report states that this major service contract will begin in Q4 2026 and run through 2029. The contract value does not represent annual revenue or a guaranteed profit amount.
AI: Atea sees rising demand for servers, storage, and networks, as well as for consulting and operations. The company does not report separate AI revenue. The area is thus part of its business operations, but its exact contribution to earnings remains unclear.
For the full year, management expects EBIT of 1.710 to 1.745 billion NOK, or approximately 165.51 to 168.90 million EUR. This figure includes 152 million NOK in AppXite profit. Excluding this amount, the calculated range is NOK 1.558 to 1.593 billion. Slower currency-adjusted revenue growth is expected for Q4; management remains confident for 2027. According to the published financial calendar, the next annual results are scheduled for February 9, 2027 .
11 Competition and Risks
In my view, the risks lie particularly in the narrow margins, the financing of working capital, and the high dividends. While rising hardware prices increase revenue, they can strain customer budgets and squeeze margins under fixed-price contracts. According to management, approximately half of the hardware growth in Q3 was attributable to higher prices.
Public-sector customers mitigate some cyclical risks but can postpone purchases. Added to this are dependencies on major manufacturers and the NOK currency for euro investors. The company’s history also includes the 2018 conviction of its Danish subsidiary for past corruption. Atea subsequently implemented a self-cleaning program in accordance with EU public procurement law. This is not evidence of a new case in 2026, but it does highlight how important compliance is in public procurement.
When it comes to AI, I see primarily opportunities for additional infrastructure contracts. At the same time, automation can change billable consulting and operational services. Manufacturers can deliver more directly, and customers can handle some tasks themselves. For the next three to five years, I view this as a business risk to monitor; AI revenue alone would not be proof of a lasting moat.
12 Future Outlooks and Scenarios
My positive thesis is: More computing power must be procured, installed, secured, and operated. Atea has the customer access and skilled personnel to do this.
To generate good returns for shareholders, the company must also increase its value creation and free cash flow.
My own scenarios for 2027 to 2028:
- Positive scenario: With sustainable earnings per share of 12.50 to 13 NOK and a P/E ratio of 17 to 18, this results in a potential share price range of approximately 213 to 234 NOK, or 20.62 to 22.65 EUR.
- Mixed scenario: With earnings per share of 11 to 12 NOK and a P/E ratio of 16, this results in a potential share price range of approximately 176 to 192 NOK, or 17.04 to 18.58 EUR.
- Negative Scenario: With earnings per share of 9 NOK and a P/E ratio of 14, this results in a potential share price range of approximately 126 NOK or 12.20 EUR.
These scenarios are our own conditional calculations and do not include the profit from the AppXite sale. They are neither company forecasts nor guaranteed fair values. Any dividends are not included. Exchange rate fluctuations may affect the euro return.
13 Technical Analysis
The weekly chart takes precedence for long-term analysis.
As of October 29, the stock is trading at 171.20 NOK, above the 50-week EMA of 160 NOK and the 200-week EMA of 144 NOK.
The overall trend is therefore positive. The weekly RSI stands at approximately 57. The weekly MACD is still below its signal line, although the most recent price movement has improved.
On the daily chart, Atea has recovered from the most recent correction. The 50-day EMA is around 165.22 NOK, and the 200-day EMA is at 161.57 NOK. The daily MACD has turned upward, and the RSI is also near 57. A short-term pause may occur at the upper Bollinger Band around 172.82 NOK. However, touching the band alone is not a sell signal.
Technical reference levels from the charts as of October 29, 2026:
- First pullback zone: 165 to 167 NOK, or approximately 15.97 to 16.16 EUR.
- Lower support zone: 160 to 162 NOK, or approximately 15.49 to 15.68 EUR.
- Notable recent low: approximately 157 NOK, or around 15.20 EUR.
- Major resistance: approximately 179 to 180 NOK, or around 17.33 to 17.42 EUR.
These levels are snapshots. A sustained weekly close below 157 NOK would call the recent recovery into question and suggest another test of that level. However, this alone does not yet indicate a fundamental breakdown.
14. BARGAIN HUNTERS LIST
Technical monitoring plans for approximately three to nine months:
- Current price basis: Entry at 171.20 NOK, first target at 179 NOK, and risk level at 157 NOK. This results in a risk-reward ratio of 0.55 : 1.
- Pullback with stabilization: Entry at 165 NOK, first target at 179 NOK, and stop-loss at 157 NOK. This results in a risk-reward ratio of 1.75 : 1.
- Deeper pullback with stabilization: Enter at 160 NOK, first target at 179 NOK, and stop-loss at 153 NOK. This results in a risk-reward ratio of 2.71 : 1.
- Confirmed breakout: Entry at 181 NOK, first target at 190 NOK, and stop-loss at 173 NOK. This results in a risk-reward ratio of 1.13 : 1.
Euro equivalents for the price levels mentioned:
- 153 NOK is approximately 14.81 EUR.
- 157 NOK is approximately 15.20 EUR.
- 160 NOK is approximately 15.49 EUR.
- 165 NOK is approximately 15.97 EUR.
- 171.20 NOK is approximately 16.57 EUR.
- 173 NOK is approximately 16.74 EUR.
- 179 NOK is approximately 17.33 EUR.
- 181 NOK is approximately 17.52 EUR.
- 190 NOK is approximately 18.39 EUR.
The ratio should always be interpreted as opportunity : risk.
Calculation: potential profit divided by potential loss.
Example for an entry at 160 NOK: (179 − 160) / (160 − 153) = 2.71.
The 153 NOK level serves as a risk buffer below the most recent low; it is not a precise historical support level. The 190 NOK is a preliminary projection target following a successful breakout. To confirm this, a convincing closing price above 180 NOK would be important first. A standard buy-stop order does not check the closing price.
These plans do not constitute a long-term company valuation. Risk levels do not guarantee an execution price; price gaps, slippage, and fees can worsen the actual outcome. The calculated risk-reward ratio says nothing about the probability of occurrence.
15 My Personal Conclusion
For me, Atea is a company worth keeping an eye on.
The group has been in business for decades and can address specific customer needs in digitalization, AI infrastructure, and defense IT.
The dividend makes the overall package even more attractive.
However, my enthusiasm ends where high hardware revenue is automatically equated with high earnings quality. The adjusted valuation metric is less favorable than the reported P/E ratio, and cash flow coverage needs to improve.
That’s precisely why the fourth quarter would be the next crucial checkpoint for me.
My overall verdict: an interesting Scandinavian IT stock; for now, it’s best to watch it or wait for a more favorable pullback.
For long-term investors, the story becomes more compelling if growth reliably generates more free cash flow per share.
What do you think of Atea? Have you had this name on your radar, or have you so far been focusing on the large, well-known companies in AI and defense?
Sources and Calculation Basis
The four valuation ratios are based on 171.20 NOK and approximately 111.56 million outstanding shares, excluding treasury shares, as of September 30. No subsequent changes in the number of shares are assumed. Twelve-month figures were calculated as the full year 2025 plus nine months of 2026 minus nine months of 2025. The price-to-FCF ratio is separate from the P/E ratio. Figures are rounded.
Q3 2026 Originalbericht, insbesondere Seiten 3, 10–17, 23, 26–28 und 33–34
Q3 2026 Präsentation und Ausblick
Offizielle Ergebnismeldung vom 22. Oktober 2026
Managementgespräch vom 22. Oktober 2026
Unternehmensprofil und Geschichte
Steinar Sønsteby und sein beruflicher Werdegang
Dividendenpolitik und Zahlungshistorie
Offizielle Meldung zum NCIA-Auftrag vom 25. November 2025
Veröffentlichter Finanzkalender
Historische Einordnung durch Store norske leksikon
Historische Compliance-Meldung von 2018
Dustin Unternehmensprofil, Bechtle Geschäftsmodell and Computacenter Investor Relations
EZB-Referenzkurse, abgerufen für 29. Oktober 2026
and, of course, everyone else :)
+ 6
I received something quite interesting from a colleague today.
The exact source remains confidential for security reasons, and I’m only sharing a redacted version:
I’d like to show you the stock recommendation list from one of Switzerland’s largest universal banks and hear your thoughts on it:
THIS DOES NOT CONSTITUTE INVESTMENT ADVICE AND IS FOR INFORMATIONAL PURPOSES ONLY.
International growth stocks:
Technology (Top 3 – BUY):
$GOOGL (+2,55%): BUY – Price target at 584.55 USD – Revenue growth 15.2%, net profit margin 32.8%
$MSFT (+6,14%): BUY – Price target of 810 USD – Revenue growth 14.93%, net profit margin 36.15%
$NVDA (-4,21%): BUY - Price target of 542 USD - Revenue growth 114.2%, net profit margin 55.85%
Consumer Staples (BUY):
$LISN (+3,87%) Lindt & Sprüngli: BUY - Price target of 12,500 CHF - Revenue growth of 8.18%, net margin of 12.29%
Consumer Discretionary (BUY):
$AMZN (+5,68%) Amazon: BUY - Price target at $405 - Revenue 12.38%, net margin 10.83%
$MELI (-3,72%) Mercado Libre: BUY - Price target of 3,487 USD - Revenue 39%, net margin 6.9%
Also a BUY: $MC (+4,41%)
LVMH and $CFR (+4,82%) Richemont
Note:
Please keep in mind that this is a snapshot. The rating could change from BUY to SELL by the next day without being updated in this post.
If you find this post interesting, I may share something similar again in the future.
I find all the stocks mentioned here very interesting and have already given them some thought myself.
Just for fun, I opened a test portfolio and bought each of the mentioned positions at the current price for about CHF 1,000. Depending on the situation, I’ll sell them when they reach the stated price targets.
Let’s see what happens...
Let’s get rich... or something like that...
Feel free to save this post for later!
$MSFT (+6,14%)
Accelerated Azure growth and strong AI monetization are driving a new wave of price target increases
⠀
The key takeaway: Wall Street remains clearly bullish. Microsoft exceeded expectations on key metrics, Azure accelerated to 48% growth, and management is forecasting further acceleration for the next quarter.
⠀
Average price target: $644
Upside potential from the current price of $539.39: ~19%
⠀
Current analyst estimates:
• Wells Fargo: Overweight, $750 from $725 (+39%)
• Bernstein: Outperform, $722 from $662 (+34%)
• Stifel: Buy, $650 from $575 (+21%)
• Morgan Stanley: Overweight, $650 from $600 (+21%)
• Piper Sandler: Overweight, $650 from $610 (+21%)
• Raymond James: Outperform, $650 from $630 (+21%)
• KeyBanc: Overweight, $630 from $600 (+17%)
• Citizens: Market Outperform, $625 from $550 (+16%)
• Oppenheimer: Outperform, $625 unchanged (+16%)
• Barclays: Overweight, $610 from $600 (+13%)
• BMO: Outperform, $610 from $600 (+13%)
• Deutsche Bank: Buy, $600 unchanged (+11%)
• Guggenheim: Buy, $595 from $586 (+10%)
⠀
What analysts liked:
• Q1 revenue of $92.3 billion vs. ~$90.6 billion expected, +19% YoY
• Adjusted EPS of $4.89 vs. ~$4.73 consensus
• Azure growth accelerated to 48% on a constant-currency basis vs. ~45% expected
• Q2 guidance anticipates further Azure acceleration to 49–50%
• M365 Commercial Cloud accelerated to 18%; ~19% is expected for Q2
• Operating income reached $45.9 billion, up 21% year-over-year
• Free cash flow of $18.6 billion was significantly above the consensus estimate of ~$8.3 billion
⠀
The AI Story: Microsoft is increasingly demonstrating concrete monetization across the entire AI stack. Foundry revenue has more than tripled YoY, open-source model revenue increased tenfold, Copilot daily active users grew by about 50% QoQ, and the number of customers with usage-based credits grew by more than 75%.
⠀
Why Azure Is Crucial: Demand continues to exceed available capacity. Nevertheless, Microsoft is tapping into additional revenue potential through more efficient GPU and CPU utilization, higher revenue per token, and better infrastructure utilization. Analysts increasingly see this as evidence that the massive AI investments are delivering measurable returns.
⠀
The remaining risks:
• Portions of external data center capacity have been deferred to the second half of FY27
• Cash Capex remains extremely high and is expected to accelerate again
• Cloud gross margins remain under pressure due to the infrastructure-heavy AI mix
• Windows OEM and Devices remain weak, with another significant decline expected in the next quarter
⠀
Conclusion: Microsoft delivered exactly what investors want to see from an AI hyperscaler: faster cloud growth, stronger monetization, operational leverage, and positive free cash flow despite massive infrastructure investments. The key question now is no longer whether AI generates revenue, but how long Microsoft can sustain Azure growth of nearly 50% at this scale.
$MSFT (+6,14%) delivered a strong quarter. Revenue rose 19% to $92.3 billion, and adjusted EPS rose 18% to $4.89. Azure, in particular, significantly exceeded expectations.
Here’s my take on the five key watchouts I mentioned earlier in my pre-post:
Another notable point: Business is not growing at the same rate across all segments: While the Agents and Infra segment grew by 25%, revenue in the Devices and Consumer segment declined by 3%. Windows OEM and Devices, in particular, were weaker.
Furthermore, caution is warranted when comparing profits. Reported GAAP EPS rose by 32%, while adjusted EPS rose by 18%. This discrepancy is due, among other things, to differing effects from $MSFT (+6,14%) the OpenAI investment. The adjusted comparison is therefore more helpful for assessing operating performance.
My conclusion: $MSFT (+6,14%) delivers a strong quarter. I remain invested and see my long-term thesis fundamentally confirmed by this quarter. Azure is growing faster than expected, the order backlog is rising significantly, and operating income is also trending positively. This fulfills my key expectations for the cloud business. My biggest concern remains the profitability of the AI boom. Revenue is growing strongly, but at the same time, investments are rising massively and free cash flow is coming under pressure. With Copilot, I also still lack a clear, separate metric for monetization. For the coming quarters, I’d especially like to see Microsoft generate not only growth but also sustainably rising free cash flow from its high pace of investment.
~ Not investment advice ~
$MSFT (+6,14%) The company will release its first-quarter results for fiscal year 2027 today after the U.S. stock market closes. I hold the stock in my portfolio and am convinced of the company’s long-term quality. Still, it will be interesting to see how much growth $MSFT (+6,14%) with AI, and how quickly will the necessary investments pay for themselves?
My Key Watchouts:
My Conclusion: $MSFT (+6,14%) combines a strong cloud business, established enterprise software, and enormous opportunities in the AI market. For me, the key question is now less whether AI is growing, but rather whether $MSFT (+6,14%) can generate attractive returns on invested capital from this over the long term. At the same time, I want to see that revenue growth, monetization, and cash flow keep pace with rising investments over the long term.
~ Not investment advice ~
📊 𝐑𝐞𝐬𝐮𝐥𝐭𝐬
• Adj. EPS: $4.89 (Est. $4.72) ✅, +18% YoY.
• Revenue: $92.28B (Est. $90.74B) ✅, +19% YoY.
• GAAP EPS: $4.92, +32% YoY.
• Operating Income: $45.92B, +21% YoY.
• Adj. Net Income: $36.42B, +18% YoY.
• Operating Cash Flow: $58.0B, +29% YoY.
• Capital Expenditures: $39.37B, +103% YoY.
⠀
📌 𝐊𝐞𝐲 𝐓𝐚𝐤𝐞𝐚𝐰𝐚𝐲𝐬
• Q1 Adj. EPS beat consensus by ~3.6%, while revenue exceeded estimates by ~1.7%.
• Azure revenue surged 48% YoY to $33.17B.
• Microsoft Cloud revenue increased 30% to $63.9B.
• Commercial remaining performance obligations surged 73% to $677B.
• Agents and Infra revenue grew 25% to $76.8B, with operating income reaching $40.6B.
• Microsoft 365 Commercial Cloud revenue increased 17%, or 18% on an adjusted basis.
• Devices and Consumer revenue declined 3% to $15.5B, with Windows OEM and Devices down 22%.
• Capital expenditures more than doubled to $39.4B, reflecting substantial infrastructure investment.
• Microsoft returned $10.2B to shareholders through dividends and buybacks.
• OpenAI investments contributed $0.03 to GAAP EPS, compared with a $0.41 negative impact a year earlier.
⠀
💬 𝐌𝐚𝐧𝐚𝐠𝐞𝐦𝐞𝐧𝐭 𝐂𝐨𝐦𝐦𝐞𝐧𝐭𝐚𝐫𝐲
“We delivered a strong start to the fiscal year with Microsoft Cloud revenue of $63.9 billion, with growth accelerating to 30% (up 31% in constant currency) year-over-year.”
Principais criadores desta semana


