
📉 Cisco Systems and Coherent both fell despite Cisco CEO Chuck Robbins saying "all areas of our business have tailwinds right now."

Cisco Systems
Ação
Ação
Ticker: CSCO
CSCO
Price
Discussão sobre CSCO
Postos
158
2Mês·
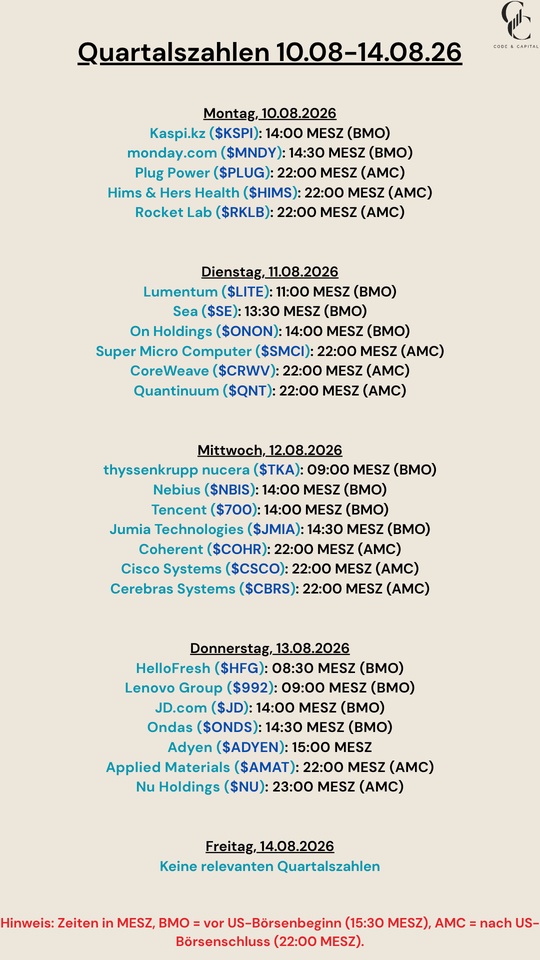
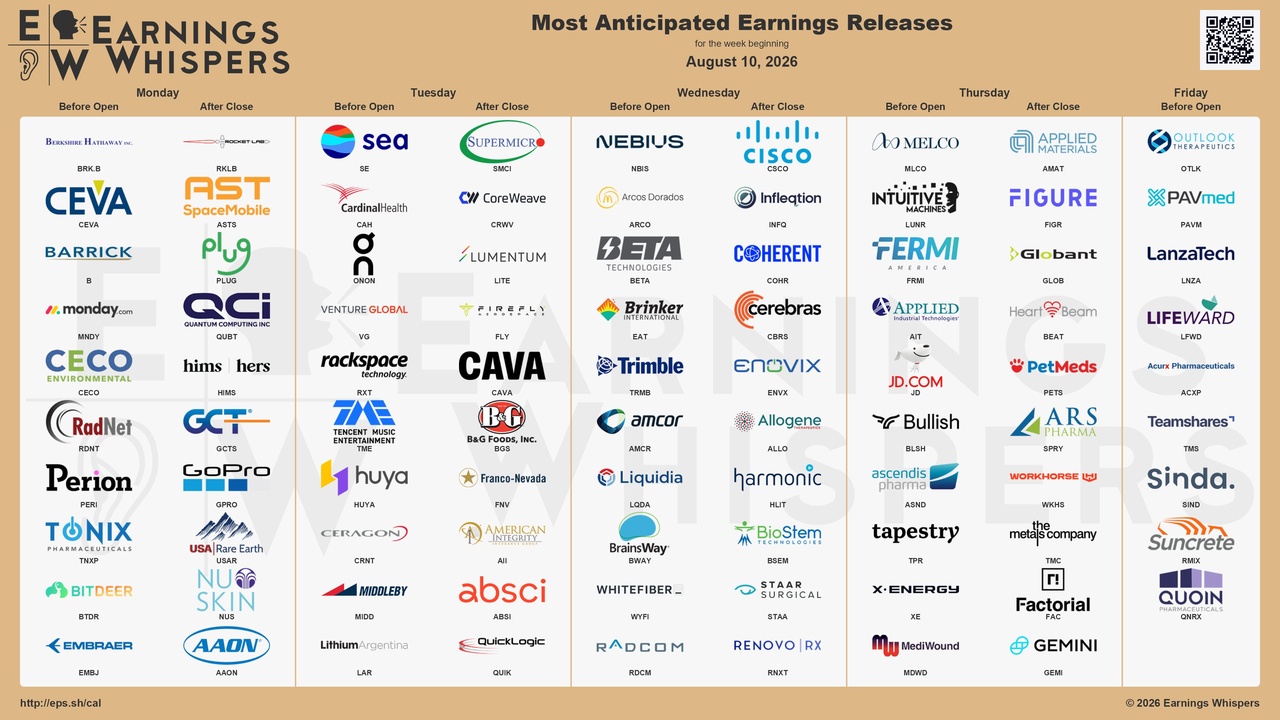
Quarterly Results: August 10–14, 26
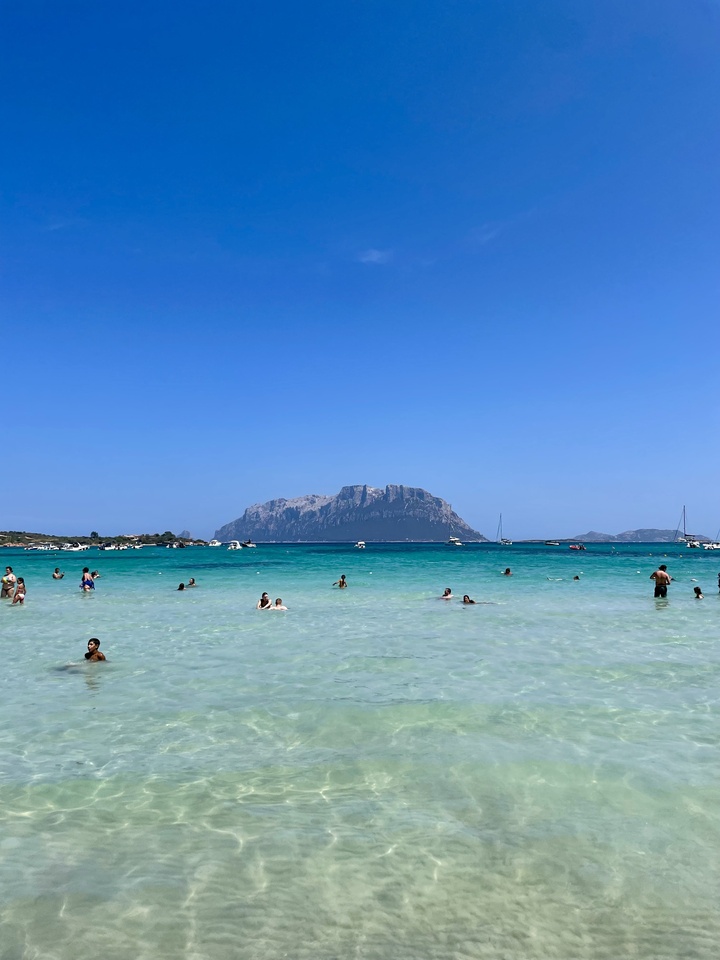
I'd also like to send warm greetings from my vacation in Sardinia ☀️🏝️
$KSPI (-0,59%)
$MNDY (+7,74%)
$PLUG (+2,31%)
$HIMS (+4,71%)
$RKLB (+0,66%)
$LITE (-2,65%)
$ONON (-1,28%)
$SMCI (-2,34%)
$CRWV (+5,04%)
$QNT (+10,91%)
$TKA (+1,85%)
$NBIS (+0,44%)
$700 (-0,47%)
$JMIA (+5,01%)
$COHR (-5,36%)
$CSCO (-4,35%)
$CBRS
$HFG (+5,5%)
$992 (-9,18%)
$JD (+2,09%)
$ONDS (+2,72%)
$ADYEN (+3,07%)
$AMAT (-4,16%)
$NU (-1,27%)
2020
4 Comentários
HoldTheMike@HoldTheMike
2Mês
•
55
•Mostrar resposta


2Mês·
What's Ahead This Week 📅
Monday, Aug. 10
1:50 a.m. | Japan: Current Account and Trade Balance (June)
10:30 a.m. | EU: Sentix Investor Confidence (August)
Tuesday, Aug. 11
4:00 p.m. | U.S.: Existing Home Sales (July)
Wednesday, August 12
2:30 p.m. | U.S.: Consumer Price Index / Inflation (July) 🌶
Thursday, August 13
8:00 a.m. | UK: Gross Domestic Product (Q2, preliminary)
11:00 a.m. | EU: Industrial Production (June)
2:30 p.m. | US: Producer Price Index / PPI (July) 🌶
Friday, Aug. 14
11:00 a.m. | EU: Gross Domestic Product (Q2, preliminary)
2:30 p.m. | U.S.: Retail Sales (July) 🌶
4:00 p.m. | U.S.: University of Michigan Consumer Sentiment (August, preliminary)
4:00 p.m. | U.S.: Business Inventories (June)
$NBIS (+0,44%)
$ASTS (+4,52%)
$CBRS$CSCO (-4,35%)
$AMAT (-4,16%)
$CRWV (+5,04%)
$CAVA
$ABX (+3,58%)
$JD (+2,09%)
$9618 (+1,6%)
99


2Mês·
A Look Back at July 2026
Hey,
July is over, and it’ll be time for gingerbread again soon. Not much has happened on the investment front. At least that’s something—after all, not much else has been going on these past few months. Well, at least not when it comes to stock investments. Instead, I’ve been investing in a solar power system.
But let’s take a look at the performance first, as usual.
📈 Performance:
S&P 500: -1.24%
MSCI World: -1.01%
DAX: +2.53%
Dividend portfolio: +3.35%
My top and bottom performers in July were (Top 3/Bottom 3):
🟢 ($CTAS (+1,55%) ) Cintas +20.64%
🟢 ($MSFT (+0,19%) ) Microsoft +19.27%
🟢 ($2318 (+1,03%) ) Ping An 17.37%
🔴 ($CSCO (-4,35%) ) Cisco -4.95%
🔴 ($LLY (+2,64%) ) Eli Lilly -5.15%
🔴 ($HD (+3,64%) ) Home Depot -6.11%
Dividends:
July 2026: €191.06
July 2025: €66.91
Change: +192.55%
This increase is primarily due to the fact that PingAn paid its dividend in July this year. Last year, it paid it in June.
Sales:
🟥 None
Purchases:
🟩 ($TSCO (+1,95%) ) Tractor Supply (~€400)
Savings plans:
($CTAS (+1,55%) ) Cintas (€50)
($MSFT (+0,19%) ) Microsoft (€25)
What else has been going on?
The main topic of discussion was, of course, still the solar panel system. A lot has been sorted out in the meantime, though not everything yet. What I do know now is that the pump broke down. It was replaced, and then I was at least able to take a warm shower again using the heating element. However, the next day the heating element stopped working as well. It was probably due to a valve that was also defective. The exhaust fan was broken, too. I then contacted the manufacturer’s customer service, and they’ve already been here. They replaced the changeover valve. Funnily enough, they did it as a gesture of goodwill, since the broken part was an older model and such parts are simply replaced when they fail. After that, it turned out that the exhaust fan was broken. This wasn’t new information to me, but it was to the technician. It’s a good thing I explained everything in great detail when scheduling the appointment and also mentioned that the fan was broken. Now a new appointment has been scheduled for mid-August. Interestingly, according to the estimate, the fan will also be replaced free of charge. For whatever reason.
I’m not sure yet whether I think that’s a good or bad thing. After all, it’ll naturally be difficult to explain to the solar company—as a gesture of goodwill—that they’re to blame for the whole situation. Well, at least they won’t send me a new bill until everything’s sorted out. Very accommodating.
Let’s see if everything gets sorted out by the appointment in August. Maybe more problems will crop up after the fan is replaced. But we won’t know for sure until the fan is actually replaced. At least I’ve had hot water again since the first appointment. Even though it’s summer, cold showers are really a pain.
Toward the end of the month, the next cost estimate arrived. The cat went to the vet and has broken teeth (FORL). The surgery, including a heart ultrasound and all that jazz, is expected to cost €1,500. Give or take… depending on how many teeth are actually affected. They’re estimating six teeth here. The appointment is set for October. We’ll see—maybe by then all his teeth will be broken anyway, in which case we can skip the surgery, since he won’t be in any pain anymore. We’ll see.
🥅 Goals for 2026:
I’m trying to reach €85,000 in my dividend portfolio this year. I’m currently at around €80,122, so at least in theory, it’s still possible. That said, the market’s performance has definitely helped here. Right now, I still have about €1,300 left to invest, and the dividends will be added to that. I’m expecting about €746 in net dividends this year (according to getquin). That means the goal is still within reach.
If you enjoyed this post and would like to read more like it, feel free to follow me;
if you’re not interested, feel free to scroll past or use the block feature.


3Mês·
A smooth glide instead of wild swings in value: My June 2026 Portfolio and Cash Flow Review 🪂
A quick note before we begin: I’ve significantly shortened the entire post to make it easier to read. Going forward, you’ll only be able to find some of the key metrics in my YouTube video or on Instagram. I’ve also completely removed the outlook section and the narrative text in between.
I hope you like the shorter version. 😊
I’ve had an eventful month! While things were relatively quiet on the markets, I was able to celebrate some real milestones in my passive income. My financial journey has been solid, calm, and steadily upward, just like hiking in Saxon Switzerland. When the foundation is right and your habits are in place, the daily market noise loses all its fear.
Here are the hard facts and all the key metrics from June:
Portfolio Performance: Stable Returns & Beat the Benchmark 📈
Total performance (TTWROR):
+0.57% for the reporting month (96.80% since inception)
Internal Rate of Return (IRR):
+0.79% (+12.29% since inception)
Delta: A hefty gain of +778.41 €
Benchmark comparison with the TTWROR of the following ETFs:
$VWRL (-0,25%) : -0.33%
$VUSA (-0,22%) : -0.41%
$IMEU (+0,93%) : +3.22%
Largest individual stock positions by volume as a percentage of the total portfolio:
$AVGO (-1,2%) : 2.78%
$WMT (+0,99%) : 1.62%
$GOOGL (-0,22%) : 1.54%
$CSCO (-4,35%) : 1.50%
$FAST (-4,42%) : 1.42%
Smallest individual stock positions by volume as a percentage of the total portfolio:
$GIS (+1,95%) : 0.43%
$NKE (+4,89%) : 0.43%
$NOVO B (+2,74%) : 0.49%
$CPB (+3,69%) : 0.49%
$BATS (+2,08%) : 0.57%
Top-performing individual stocks
$AVGO (-1,2%) : +332.73%
$GOOGL (-0,22%) : +134.74%
$CSCO (-4,35%) : +115.98%
$WMT (+0,99%) : +94.59%
$OHI (+0,42%) : +88.06%
Worst-Performing Individual Stocks
$NKE (+4,89%) : -50.39%
$GIS (+1,95%) : -47.00%
$CPB (+3,69%) : -36.10%
$NOVO B (+2,74%) : -20.48%
$DHR (+2,38%) : -18.41%
Asset Allocation
ETFs and stocks are not quite balanced yet.
ETFs: 43.7% (previous month: 43.4%)
Stocks: 56.3% (previous month: 56.6%)
Investments and Additional Purchases
Planned savings plan amount from fixed net salary: €1,080
Savings rate of the savings plans as a percentage of fixed net salary: 50.60%
Planned savings plan amount from fixed net salary, including reinvested dividends based on plan size: 1,200 €
Additional purchases from various sources: €392.83. This is offset by sales of €286.36 this month (portfolio rebalancing $FDXF (+0,95%) into $FDX (+0,48%) ).
Passive income from dividends and ETF distributions
Dividends and ETF distributions: €174.33 (€152.30 in the same month last year
Change from the same month last year: +14.46%
YTD dividends and ETF distributions: €1,088.83
Annual target: €2,100
Target achievement: 51.85% (Target: 50.00%)
Risk Metrics
Maximum drawdown in the reporting month: 1.15%, since inception: 17.17%
Maximum drawdown duration in the reporting month: 10 days; since inception: 702 days
Volatility in the reporting month: 1.72%; since inception: 28.79%
Sharpe Ratio, for the reporting month: 5.53, since inception: 0.42
Semivolatility, for the reporting month: 1.01%, since inception: 21.33%
Thank you for reading. 🚀
Now please leave me a comment. Is this summary helpful? Is there anything you think is missing? Let me know.
👉 This review is also available as a YouTube video and as Instagram carousel posts, which will be published as follows:
July 8, 2026: Portfolio review on Instagram (performance metrics, stock performance, allocation, sectors, additional purchases, and performance comparisons)
July 9, 2026: Budget review on Instagram (income, expenses, cash flow, ratios, budget adherence, and basic income check)
July 10, 2026: Cash flow review on Instagram (overview, YTD, and actual vs. target comparison for passive income, my top dividend payers, FIRE number, and capital reach)
Sometime during Week 28: Consolidated monthly review on YouTube
📲 You can find regular videos, Shorts, Reels, and carousel posts on the topics of frugalism, mindset, and investing at @frugalfreisein on Instagram and YouTube.
Please pay close attention to the spelling of my alias. Unfortunately, there are too many fake and phishing accounts on social media. I’ve already been “copied” several times.
2222
3Mês·
Analysis of AI Infrastructure Stocks 📈
- Global data center capacity
- Market for liquid cooling in data centers
- Cashing in on the AI gold rush
- "Old industry" as the winner
- ABB $ABBN (-2,08%)
- Cisco $CSCO (-4,35%)
- Hochtief $HOT (-2,79%)
- Nokia $NOKIA (+1,19%)
- Schneider Electric $SU (-1,67%)
- Siemens $SIE (-1,12%)
- Siemens Energy $ENR (-0,98%)
22

3Mês·
AI Infrastructure: The Second Wave of the Boom
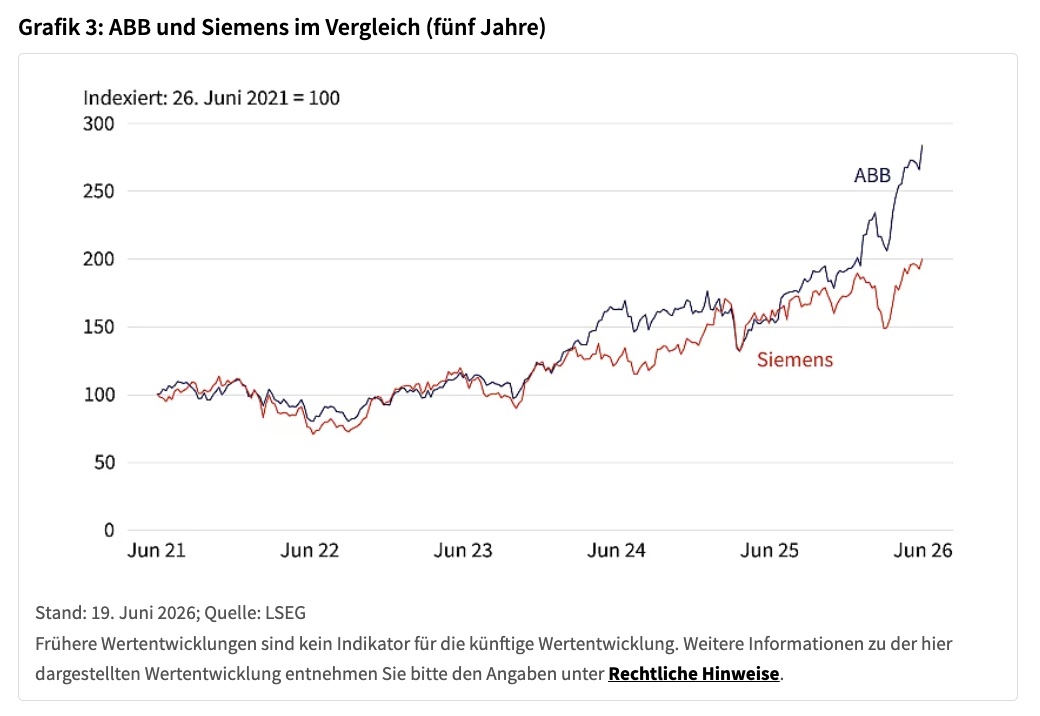
The AI boom is usually discussed in terms of chips and software, but the market that’s actually larger lies beneath: data centers, power grids, and cooling systems. According to Gartner, AI infrastructure is expected to grow to over 1.4 trillion U.S. dollars by 2026, accounting for a good 45% of all AI spending. McKinsey even estimates that up to 7 trillion U.S. dollars in investment will be needed by 2030.
And it’s not just the big-name tech companies that are benefiting from this.$ANET (-5,25%) And $CSCO (-4,35%) supply the high-performance networks, $VRT (-4,37%) and the cooling technology for data centers. What’s particularly exciting is that “traditional industry” is also playing a major role.
$ABBN (-2,08%) and $SIE (-1,12%) are seeing double-digit growth in the data center business; $SiemensEnergy provides the power connection, and $HOT (-2,79%) has more than doubled its data center orders within twelve months—result: promotion to the DAX.
Anyone looking for the AI story only among chip manufacturers is overlooking the more exciting part of the physical infrastructure behind it.
👉 The full analysis with all the numbers and charts is available in verlinkten Artikel.
#KI
#Rechenzentren
#Infrastruktur
#Marktausblick
This article is part of an advertising partnership with Société Générale
99
1 Comentar
3Mês
•
22
•
4Mês·
New Long term Positions
$NOK is not a direct AI winner like $NVDA (-2,34%)
$AMD (-2,13%) or $TSM (-2,59%) but has several ways to benefit from the next AI Infrastructure wave
The long term thesis today has shifted from telecom equipment to a combination of
1. AI networking
2. Optical infrastructure
3. Data center connectivity
4. Private wireless networks
5. Industrial & Physical AI connectivity
Where $NOK (+1,79%) fits
1. Data Center Networking
Nokia's IP networking division sells:
High-speed Ethernet switches
Optical transport systems
Data center interconnect solutions
As hyperscalers expand AI campuses they need
-Fiber optics
-Routing
-Switching
-Network management
This is good for $CSCO (-4,35%)
$ANET (-5,25%) $NOK
AI Data centers are creating huge demand for Connectivity
This is also good for $LITE (-2,65%) & $NOK (which is why you've been seeing Whales load the shit out of both on Leaps all April, May, and June so far)
Nvidia also partnered with $NOK in October 2026 and took a 3% or $1B stake in it
NOK does have a history of lower revenue growth & weaker margins. There is better competition like $AVGO (-1,2%)
$MRVL (-2,04%)
$ANET (-5,25%) but the R/R setup entirely is very very good
$NOK could be one of those very beat down names that can come alive like $INTC
Targeting $20+ or about 50%+ move upside from 12-13s
BOUGHT 2000+ NOK @ 13.55🎯🎯
33
4Mês·
Review of May 2026
Hey,
The fifth month of the year is already over. Once again, a lot has happened that’s throwing my finances into disarray. I’m starting to worry that I won’t be able to reach my goal—and that I might even be stagnating. But more on that later. Let’s take a look at the performance, as usual.
📈 Performance:
S&P 500: +9.50%
MSCI World: +8.00%
DAX: +7.10%
Dividend portfolio: +3.94%
My top and bottom performers in May were (Top/Flop 3):
🟢 ($CSCO (-4,35%) ) Cisco Systems +32.18%
🟢 ($LLY (+2,64%) ) Eli Lilly +18.93%
🟢 ($TXN (-1,8%) ) Texas Instruments +12.84
🔴 ($PEP (-1,21%) ) Pepsi -8.31%
🔴 ($TSCO (+1,95%) ) Tractor Supply -9.25%
🔴 ($PETR4 (+0,78%) ) Petroleo Brasileiro -12.25%
Dividends:
May 2026: €348.79
May 2025: €369.70
Change: -5.66%
E.On’s dividend was paid out in April this year, and I also paid capital gains tax on the Allianz dividend. That’s how this difference came about. On a gross basis, there was a 3.54% increase compared to the previous year.
Sales:
🟥 None
Purchases:
🟩 3 shares of Procter & Gamble ($PG (-0,21%) )
Savings plans:
($CTAS (+1,55%) ) Cintas (€50)
($MC (+3,4%) ) LVMH (€50)
($MSFT (+0,19%) ) Microsoft (€25)
What else has been going on?
As I mentioned at the beginning, quite a bit happened in May that’s throwing my financial planning into disarray. First off, the first bill for the solar panel system came in, and it needs to be paid. That was planned, though. So far, so good.
My laptop broke, so I had to get a new one. That wasn’t planned and is another blow.
For the building insurance, the new construction discounts are gradually being phased out, which is why the premium here is also €120 higher than usual. But I didn’t just miscalculate that—I also didn’t anticipate the payment being debited at all. Well, that’s just how it goes with debits that only come once a year.
Furthermore, the tax return has been filed, and we now have to pay an additional €1,200 (income from my wife’s self-employment).
On the other hand, the solar panel system won’t be connected until the end of June, which is why the final bill will likely arrive in July. So maybe I’ll manage to pay for the system without having to dip into the money set aside for the loan payoff. Everything will work out, and I’m not worried that anything might go wrong. The money is there, I just don’t want to touch it. But as is often the case, something like this really throws the finances into disarray, and with the additional expenses (home insurance and a laptop), I’ll have to save up that money again. My hope of investing fully again starting in April was already gone anyway. But now I’ll probably be busy building up my emergency fund again for the whole year, which will cost me another year of investing. So I don’t know how much more I’ll be able to invest at all.
My pension portfolio has currently been reduced from €650 to €500. This is also something I didn’t want to do, but it’s now unavoidable. However, the €500 will definitely continue to be invested.
🥅 Goals for 2026:
I’m aiming to reach €85,000 in my dividend portfolio this year. I’m currently at around €78,500, so at least theoretically, anything is still possible. I still have the dividends to reinvest. A pure price increase would now require an 8% rise. So that’s a bit unrealistic. But with the reinvestment of dividends plus price appreciation, it’s definitely doable.
If you enjoyed this post and would like to read more like it, feel free to follow me;
if you’re not interested, feel free to scroll past or use the block feature.
3939
17 Comentários
Everyday worries in the financial bubble
Account at zero but the portfolio grows and grows
Account at zero but the portfolio grows and grows
•
2222
•4Mês·
From Saxon savings roots to record cash flow: my review for May 2026
Step by step upwards! With an all-time high in passive income, the foundation for financial freedom is rock solid. 📈🏰
May proved how important stability is. Just like the historic walls of Albrechtsburg Castle in Meissen, which I visited, my portfolio is in a solid position after the recent rollercoaster ride, with the overall portfolio recording a solid gain of 2.42%.
On the markets, AI continues to drive tech stocks, while $CSCO (-4,35%) the strong old economy backbone.
The 397 steps of the Spitzhaus staircase in Radebeul near Dresden are a perfect symbol of wealth accumulation. It takes perseverance and consistency. But investors are rewarded with a steadily increasing cash flow. Time for a look back!
DISCLAIMER/RISK WARNING
Please remember that this article is for entertainment purposes only. At no point is it a buy or sell recommendation or professional legal, tax or investment advice. Don't just copy anything I do. I am merely describing what is happening in my portfolios, but in no way guarantee that it is up-to-date, correct or complete.
Investing in the capital market is always associated with risks such as loss of invested capital, price fluctuations, liquidation risks or market risks. In accordance with the current guidelines of ESMA and BaFin, I expressly point out that this review serves exclusively to document my personal investment strategy and does not constitute investment advice within the meaning of the WpIG. The securities presented by me are expressly not to be understood as investment advicebut are merely components of my personal portfolio at the time of reporting. Please also bear in mind that there is a conflict of interest, as I naturally hold the securities mentioned myself.
If necessary, seek professional advice and do your own research.
Despite great care, there may be errors in the text or in the figures.
Overall performance
My key performance indicators for my overall portfolio at a glance:
- TTWROR (month under review): + 2.42 % (previous month: + 5.29 %)
- TTWROR (since inception): +95,36 %
- IZF (month under review): +32.45 % (previous month: +87.17 %)
- IZF (since inception): +12,39 %
- Delta: +2,426.37 €
- Absolute change: € +3,506.37
Data shown as "since inception" is valid since 31.05.2020
Performance & volume
The merry month of May had little impact on my tops and flops. They all moved a little, but hardly with recognizable strong trends. It is rather stocks from the solid middle that stand out with a stronger positive development, such as $CSCO (-4,35%) , $QCOM (+2,32%) or $TXN (-1,8%) . All tech somewhere, but not the tech that we all think of first and foremost.
My problem children remain problem children, but they are all improving somehow. We are reducing the minus, especially with $NKE (+4,89%) ; $CPB (+3,69%) , $NOVO B (+2,74%) and $DHR (+2,38%) . I cannot see any clear reason other than a general recovery.
Largest single stock positions by volume in the overall portfolio:
Share (%) of total portfolio (and associated portfolio):
$AVGO (-1,2%) 3.39 % (main share portfolio)
$GOOGL (-0,22%) 1.67 % (main share portfolio)
$WMT (+0,99%) 1.61 % (main share portfolio)
$CSCO (-4,35%) 1.51 % (main share portfolio)
$FAST (-4,42%) 1.32 % (main share portfolio)
Smallest individual share positions by volume in the overall portfolio:
Share (%) of the total portfolio (and associated securities account):
$GIS (+1,95%) 0.39 % (main share portfolio)
$NOVO B (+2,74%) 0.45 % (main share portfolio)
$EDM2 (-1,04%) 0.45 % (main share portfolio)
$NKE (+4,89%) 0.47 % (main share portfolio)
$DHR 0.56 % (main share portfolio)
Top-performing individual stocks
Shares with performance since initial purchase (%) (and the respective portfolio):
$AVGO (-1,2%) : +450.94 % (main share portfolio)
$GOOGL (-0,22%) +153.04 % (main share portfolio)
$CSCO (-4,35%) +116.83 % (main share portfolio)
$WMT (+0,99%) +91.59 % (main share portfolio)
$OHI (+0,42%) +81.69 % (main share portfolio)
Flop performer individual stocks
Shares with performance since initial purchase (%) (and the respective portfolio):
$GIS (+1,95%) : -46.94 % (main share portfolio)
$NKE (+4,89%) -46.64 % (main share portfolio)
$CPB (+3,69%) -40.13 % (main share portfolio)
$NOVO B (+2,74%) -26.23 % (main share portfolio)
$DHR (+2,38%) -24.28 % (main share portfolio)
Sector allocation of my individual stocks
My top 6 sectors are:
Consumer goods: 16.30% (previous month: 17.62%)
Technology: 16.09% [excluding information technology] (previous month: 16.60%)
Miscellaneous: 15.56 % (previous month: 16.60 %)
Financial sector: 11.30% (previous month: 11.39%)
Transportation: 9.67% (previous month: 9.13%)
Trade: 8.18 % (previous month: 7.50 %)
Asset allocation
Equities and ETFs currently determine my asset allocation, with ETFs growing steadily in recent months, which may be due to additional purchases.
ETFs: 43.4 % (previous month: 42.8 %)
Equities: 56.6 % (previous month: 57.2 %)
Investments and additional purchases
I have invested the following sums in savings plans:
Planned savings plan amount from the fixed net salary: € 1,080
Savings ratio of savings plans to fixed net salary: 50.60
Planned savings plan amount from the fixed net salary, incl. reinvested dividends according to plan size: € 1,200
In addition, there were the following additional investments from returns, refunds, cashback, etc. as one-off savings plans/repurchases:
Subsequent purchases/one-off savings plans as cashback annuities from refunds: € 0.00
Subsequent purchases/one-off savings plans as cashback annuities from bonuses: € 0.00
Subsequent purchases from other surpluses: € 185.21
Automatically reinvested dividends by the broker: € 5.47 (Function is only activated for an old custody account, as I otherwise prefer to control the reinvestment myself)
Number of unscheduled additional purchases: 5
Passive income from dividends and ETF distributions
Passive income in the month under review
I received € 272.14 in dividends and ETF distributions in the month under review (€ 163.38 in the same month of the previous year). This corresponds to a change of +66.57 % compared to the same month of the previous year.
Number of dividend payments and ETF distributions: 28
Number of payment days: 15 days
Average dividend per payment: € 9.72
average dividend per payment day: € 18.14
Passive income YTD
YTD I have received distributions in the amount of € 914.50. If you put this in relation to my annual dividend target of € 2,100, the target achievement of the distribution is 43.5 % (target 41.7 %). This means that after several months I am now back above the target, which also shows that we are now facing stronger months again.
The three calculation methods result in the following distribution yields:
YTD distribution yields: 0.98 %
Distribution yields since inception: 4.97 %
Distribution yields YoY: 2.31 %
The distribution yield YoY increased by 0.93%, while the relative fluctuation was 29.54%. This shows that the distribution is growing slightly, but nevertheless from a lower momentum, as the relative fluctuation was always lower in the previous months. We are therefore dealing with a surge, which traditionally characterizes May for me.
My top payers
The top 6 payers in the month under review were:
FIRE Number & Runway
Even though I don't want to sell shares later, I also calculate my FIRE number for comparability with investors who run an exclusively accumulating strategy.
My FIRE figure based on my 12-month spending (TTM) of €12,219.62 was €305,490.50 (previous month: €303,921.50).
That's the minimum amount my portfolio would need to reach to theoretically cover the expenses via a 4% withdrawal. And this figure has risen slightly.
Of course, this figure fluctuates every month. But it's not the only metric to determine how long my assets could support me in an emergency (without taking taxes into account).
The rolling spending range (runway) expresses how long I could live off my assets.
On an annual basis, this is currently 8.16 years (previous month 7.92 years). Compared to the previous month, it has fallen by 0.24 years increased. So I am effectively about quarter of a year more "free" due to the recovery from the current global political events.
Compared to the same month last year, this is an increase of 2.33 years years. I am still 16.84 years away from my runway target (25 years), which corresponds to the FIRE multiplier. 16.84 years away. So there is still a long way to go to financial freedom, assuming that everything continues as before.
The runway stability of 97.49% indicates that my system is solid despite the market turbulence. The proximity to 100% proves that the core of my strategy remains unaffected by the market.
Performance comparison: portfolio vs. benchmarks
To see where I really stand, I regularly compare my portfolio with the major market ETFs. This allows me to see immediately how well my performance (TTWROR) has done in the current month and since the start compared to the overall market.
My portfolio: +2.42 %
$VWRL: +5,97 %
$VUSA: +6.43 %
$IQQY: +3.22 %
I am lagging behind...
Risk figures
Here are my risk figures for the month under review:
Maximum drawdown:
In the month under review: 0.78
since start: 17.17 %
Maximum drawdown duration:
In the month under review: 8 days
since start: 702 days
Volatility:
In the month under review: 2.07
since inception: 28.74 %
Sharpe Ratio:
In the month under review: 13.77
since inception: 0.43
Semi-volatility:
In the month under review: 1.28
since inception: 21.31 %
The maximum drawdown in May of just 0.78 % shows that the dust has settled. While the previous months were still characterized by corrections, the impact in May remains minimal. The Sharpe ratio of a strong 13.77 underlines the excellent risk-adjusted performance in this growth phase.
With a volatility of 2.07% and a semi-volatility of 1.28%, the fluctuations are far below the historical average. This confirms once again that my system is stable. While the long-term values hardly move, I use the calm for my foundation. The focus remains on cash flow, while the risks remain absolutely controlled.
Outlook
I look back on the merry month of May with real satisfaction. Fresh capital flowed directly into the market, the foundation for passive income continues to grow and May delivered a new all-time high: EUR 272.14 in dividends and distributions show in black and white that perseverance pays off.
Privately, May was a real month of pleasure. The trips to Albrechtsburg Castle in Meissen and Wackerbarth Castle, including the Spitzhaustreppe in Radebeul near Dresden, were absolute highlights. The 397 steps of the Spitzhaustreppe made me realize something that I have long known from investing: it always goes up step by step. My running sessions and workouts are now so automated that my strength and endurance grow almost automatically, without any motivational debates.
I conclude this review with real serenity. When the foundation is right and the habits are in place, the market noise loses all its terror. If you build your foundation like a castle, you will not be distracted by any wind.
Thank you for reading. Onwards to June and upwards step by step! 🚀
👉 The review is also available as a YouTube video and as Instagram Carousel posts, which are published as follows:
06.06.2026: Depot review on Instagram (key performance indicators, share performance, allocation, sectors, additional purchases and performance comparisons)
07.06.2026: Budget review on Instagram (income, expenses, cash flow, ratios, budget compliance and citizen money check)
08.06.2026: Cash flow review on Instagram (general, YTD and actual vs. target comparison for passive income, my top spenders, FIRE figure and capital reach)
09.06.2026: consolidated monthly review on YouTube
📲 There are regular videos, shorts, reels and carousel posts on the topics of frugalism, mindset and investing under @frugalfreisein on Instagram and YouTube.
Please pay close attention to the spelling of my alias. Unfortunately, there are too many fake and phishing accounts on social media. I have already been "copied" several times.

Títulos em alta
Principais criadores desta semana
Dados tempo real da LSX · Dados financeiros e EOD da FactSet