Top Movers
- $KLAC (-2,44%) + 14.5%
- $HILS (-1,64%) + 11 %
- $QCOM (+3,02%) + 11%
- $ASML (+0,03%) + 10%
- $BTC (-0,1%) + 9%
Top Loosers
- $PAYX (+1,87%) -20%
- $GIS (+2,15%) -20%
- $AOF (+2,63%) -18%
- $BX (+2,29%) - 18%
- $TXRH (+1,87%) -18%

Postos
72Top Movers
Top Loosers
$GIS (+2,15%)
General Mills remains a solid, defensive dividend stock in a period of transition. The shift toward greater innovation and the $3 billion cost-cutting program are the right steps to counter weak consumer spending. For patient investors, the stock offers a stable foundation with an attractive dividend.
Source: Goldesel app

I think my money is better off somewhere else right now. But I struggled with the decision for a long time 😬
Since I also $NESN (+2,69%) & $KO (-0,33%) in my portfolio…the stock’s performance was just too much for me.

A quick note before we begin: I’ve significantly shortened the entire post to make it easier to read. Going forward, you’ll only be able to find some of the key metrics in my YouTube video or on Instagram. I’ve also completely removed the outlook section and the narrative text in between.
I hope you like the shorter version. 😊
I’ve had an eventful month! While things were relatively quiet on the markets, I was able to celebrate some real milestones in my passive income. My financial journey has been solid, calm, and steadily upward, just like hiking in Saxon Switzerland. When the foundation is right and your habits are in place, the daily market noise loses all its fear.
Here are the hard facts and all the key metrics from June:
Portfolio Performance: Stable Returns & Beat the Benchmark 📈
Total performance (TTWROR):
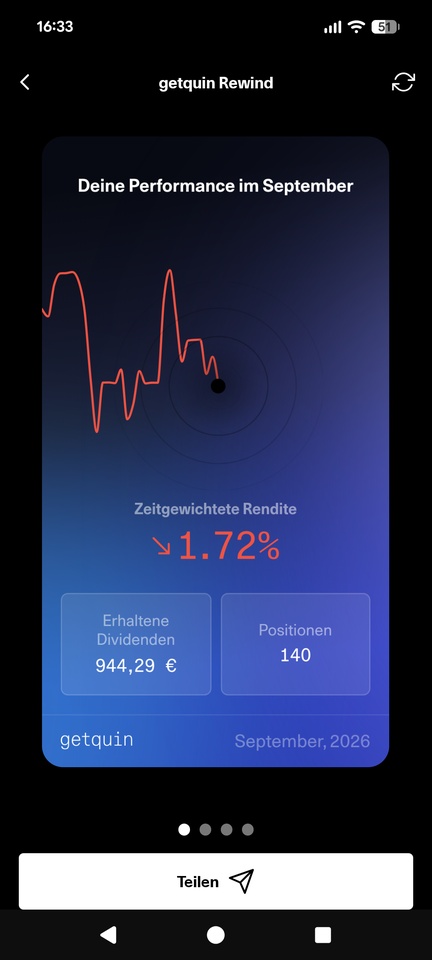
+0.57% for the reporting month (96.80% since inception)
Internal Rate of Return (IRR):
+0.79% (+12.29% since inception)
Delta: A hefty gain of +778.41 €
Benchmark comparison with the TTWROR of the following ETFs:
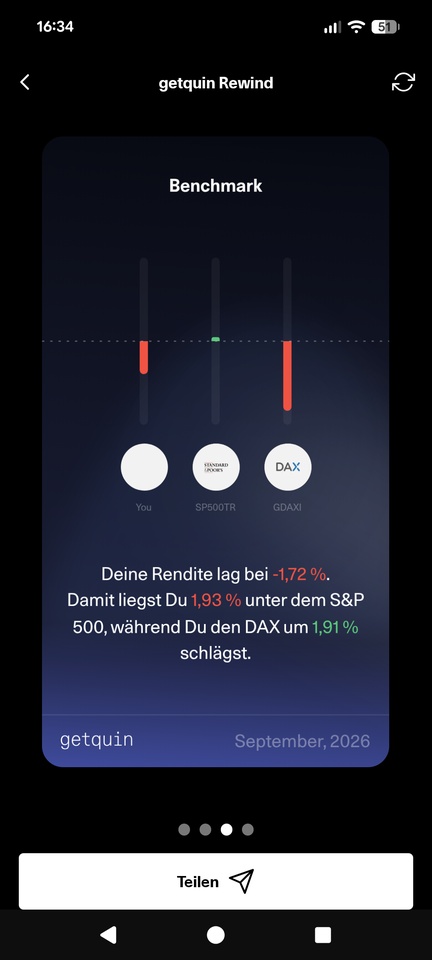
$VWRL (-0,02%) : -0.33%
$VUSA (+0%) : -0.41%
$IMEU (+0,93%) : +3.22%
Largest individual stock positions by volume as a percentage of the total portfolio:
$AVGO (-0,84%) : 2.78%
$WMT (+0,69%) : 1.62%
$GOOGL (-0,15%) : 1.54%
$CSCO (-4,2%) : 1.50%
$FAST (-3,46%) : 1.42%
Smallest individual stock positions by volume as a percentage of the total portfolio:
$GIS (+2,15%) : 0.43%
$NKE (+5,03%) : 0.43%
$NOVO B (+3,05%) : 0.49%
$CPB (+3,69%) : 0.49%
$BATS (+2,16%) : 0.57%
Top-performing individual stocks
$AVGO (-0,84%) : +332.73%
$GOOGL (-0,15%) : +134.74%
$CSCO (-4,2%) : +115.98%
$WMT (+0,69%) : +94.59%
$OHI (+0,42%) : +88.06%
Worst-Performing Individual Stocks
$NKE (+5,03%) : -50.39%
$GIS (+2,15%) : -47.00%
$CPB (+3,69%) : -36.10%
$NOVO B (+3,05%) : -20.48%
$DHR (+2,63%) : -18.41%
Asset Allocation
ETFs and stocks are not quite balanced yet.
ETFs: 43.7% (previous month: 43.4%)
Stocks: 56.3% (previous month: 56.6%)
Investments and Additional Purchases
Planned savings plan amount from fixed net salary: €1,080
Savings rate of the savings plans as a percentage of fixed net salary: 50.60%
Planned savings plan amount from fixed net salary, including reinvested dividends based on plan size: 1,200 €
Additional purchases from various sources: €392.83. This is offset by sales of €286.36 this month (portfolio rebalancing $FDXF (+0,96%) into $FDX (+1,07%) ).
Passive income from dividends and ETF distributions
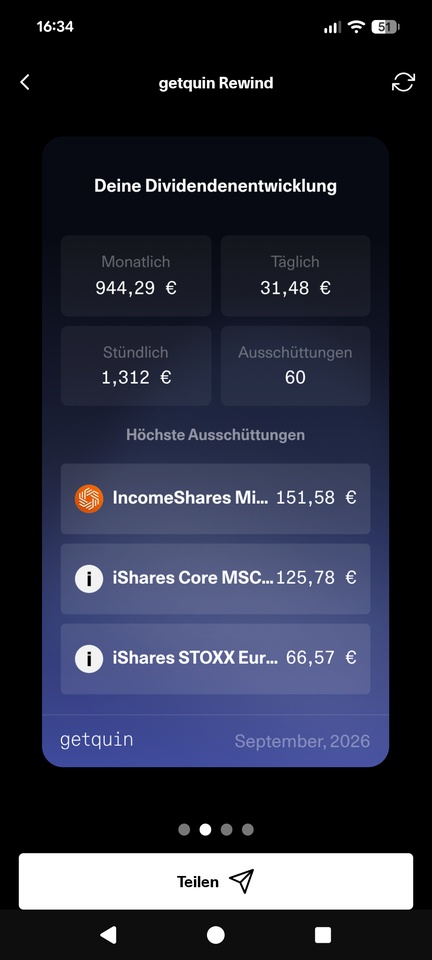
Dividends and ETF distributions: €174.33 (€152.30 in the same month last year
Change from the same month last year: +14.46%
YTD dividends and ETF distributions: €1,088.83
Annual target: €2,100
Target achievement: 51.85% (Target: 50.00%)
Risk Metrics
Maximum drawdown in the reporting month: 1.15%, since inception: 17.17%
Maximum drawdown duration in the reporting month: 10 days; since inception: 702 days
Volatility in the reporting month: 1.72%; since inception: 28.79%
Sharpe Ratio, for the reporting month: 5.53, since inception: 0.42
Semivolatility, for the reporting month: 1.01%, since inception: 21.33%
Thank you for reading. 🚀
Now please leave me a comment. Is this summary helpful? Is there anything you think is missing? Let me know.
👉 This review is also available as a YouTube video and as Instagram carousel posts, which will be published as follows:
July 8, 2026: Portfolio review on Instagram (performance metrics, stock performance, allocation, sectors, additional purchases, and performance comparisons)
July 9, 2026: Budget review on Instagram (income, expenses, cash flow, ratios, budget adherence, and basic income check)
July 10, 2026: Cash flow review on Instagram (overview, YTD, and actual vs. target comparison for passive income, my top dividend payers, FIRE number, and capital reach)
Sometime during Week 28: Consolidated monthly review on YouTube
📲 You can find regular videos, Shorts, Reels, and carousel posts on the topics of frugalism, mindset, and investing at @frugalfreisein on Instagram and YouTube.
Please pay close attention to the spelling of my alias. Unfortunately, there are too many fake and phishing accounts on social media. I’ve already been “copied” several times.
Poor Dad actually just wanted a cheeseburger, but there were a few extras😄
All of us have, had, and will eventually go through a “quick cheeseburger phase”… and before you know it, you’re standing in front of the drive-thru. McDonald’s is awesome… I had to use my tax refund from yesterday to $GIS (+2,15%) sale of McDonald’s shares… and I even drove through the McDonald’s drive-thru… No joke😂😂
If you want to see a real $MCD (+1,34%) dividend, then you have to check out @opathomas . Mine is a joke in comparison :D
Do you have $MCD (+1,34%) in your portfolio?


Since I'm an amateur botanist, I'm getting rid of the weeds… At least I was able to offset the emotional toll with the tax refund from the loss and the dividends I received.
Bye $GIS (+2,15%) , hello $ELO (-3,92%)
Step by step upwards! With an all-time high in passive income, the foundation for financial freedom is rock solid. 📈🏰
May proved how important stability is. Just like the historic walls of Albrechtsburg Castle in Meissen, which I visited, my portfolio is in a solid position after the recent rollercoaster ride, with the overall portfolio recording a solid gain of 2.42%.
On the markets, AI continues to drive tech stocks, while $CSCO (-4,2%) the strong old economy backbone.
The 397 steps of the Spitzhaus staircase in Radebeul near Dresden are a perfect symbol of wealth accumulation. It takes perseverance and consistency. But investors are rewarded with a steadily increasing cash flow. Time for a look back!
DISCLAIMER/RISK WARNING
Please remember that this article is for entertainment purposes only. At no point is it a buy or sell recommendation or professional legal, tax or investment advice. Don't just copy anything I do. I am merely describing what is happening in my portfolios, but in no way guarantee that it is up-to-date, correct or complete.
Investing in the capital market is always associated with risks such as loss of invested capital, price fluctuations, liquidation risks or market risks. In accordance with the current guidelines of ESMA and BaFin, I expressly point out that this review serves exclusively to document my personal investment strategy and does not constitute investment advice within the meaning of the WpIG. The securities presented by me are expressly not to be understood as investment advicebut are merely components of my personal portfolio at the time of reporting. Please also bear in mind that there is a conflict of interest, as I naturally hold the securities mentioned myself.
If necessary, seek professional advice and do your own research.
Despite great care, there may be errors in the text or in the figures.
Overall performance
My key performance indicators for my overall portfolio at a glance:
Data shown as "since inception" is valid since 31.05.2020
Performance & volume
The merry month of May had little impact on my tops and flops. They all moved a little, but hardly with recognizable strong trends. It is rather stocks from the solid middle that stand out with a stronger positive development, such as $CSCO (-4,2%) , $QCOM (+3,02%) or $TXN (-1,57%) . All tech somewhere, but not the tech that we all think of first and foremost.
My problem children remain problem children, but they are all improving somehow. We are reducing the minus, especially with $NKE (+5,03%) ; $CPB (+3,69%) , $NOVO B (+3,05%) and $DHR (+2,63%) . I cannot see any clear reason other than a general recovery.
Largest single stock positions by volume in the overall portfolio:
Share (%) of total portfolio (and associated portfolio):
$AVGO (-0,84%) 3.39 % (main share portfolio)
$GOOGL (-0,15%) 1.67 % (main share portfolio)
$WMT (+0,69%) 1.61 % (main share portfolio)
$CSCO (-4,2%) 1.51 % (main share portfolio)
$FAST (-3,46%) 1.32 % (main share portfolio)
Smallest individual share positions by volume in the overall portfolio:
Share (%) of the total portfolio (and associated securities account):
$GIS (+2,15%) 0.39 % (main share portfolio)
$NOVO B (+3,05%) 0.45 % (main share portfolio)
$EDM2 (-1,05%) 0.45 % (main share portfolio)
$NKE (+5,03%) 0.47 % (main share portfolio)
$DHR 0.56 % (main share portfolio)
Top-performing individual stocks
Shares with performance since initial purchase (%) (and the respective portfolio):
$AVGO (-0,84%) : +450.94 % (main share portfolio)
$GOOGL (-0,15%) +153.04 % (main share portfolio)
$CSCO (-4,2%) +116.83 % (main share portfolio)
$WMT (+0,69%) +91.59 % (main share portfolio)
$OHI (+0,42%) +81.69 % (main share portfolio)
Flop performer individual stocks
Shares with performance since initial purchase (%) (and the respective portfolio):
$GIS (+2,15%) : -46.94 % (main share portfolio)
$NKE (+5,03%) -46.64 % (main share portfolio)
$CPB (+3,69%) -40.13 % (main share portfolio)
$NOVO B (+3,05%) -26.23 % (main share portfolio)
$DHR (+2,63%) -24.28 % (main share portfolio)
Sector allocation of my individual stocks
My top 6 sectors are:
Consumer goods: 16.30% (previous month: 17.62%)
Technology: 16.09% [excluding information technology] (previous month: 16.60%)
Miscellaneous: 15.56 % (previous month: 16.60 %)
Financial sector: 11.30% (previous month: 11.39%)
Transportation: 9.67% (previous month: 9.13%)
Trade: 8.18 % (previous month: 7.50 %)
Asset allocation
Equities and ETFs currently determine my asset allocation, with ETFs growing steadily in recent months, which may be due to additional purchases.
ETFs: 43.4 % (previous month: 42.8 %)
Equities: 56.6 % (previous month: 57.2 %)
Investments and additional purchases
I have invested the following sums in savings plans:
Planned savings plan amount from the fixed net salary: € 1,080
Savings ratio of savings plans to fixed net salary: 50.60
Planned savings plan amount from the fixed net salary, incl. reinvested dividends according to plan size: € 1,200
In addition, there were the following additional investments from returns, refunds, cashback, etc. as one-off savings plans/repurchases:
Subsequent purchases/one-off savings plans as cashback annuities from refunds: € 0.00
Subsequent purchases/one-off savings plans as cashback annuities from bonuses: € 0.00
Subsequent purchases from other surpluses: € 185.21
Automatically reinvested dividends by the broker: € 5.47 (Function is only activated for an old custody account, as I otherwise prefer to control the reinvestment myself)
Number of unscheduled additional purchases: 5
Passive income from dividends and ETF distributions
Passive income in the month under review
I received € 272.14 in dividends and ETF distributions in the month under review (€ 163.38 in the same month of the previous year). This corresponds to a change of +66.57 % compared to the same month of the previous year.
Number of dividend payments and ETF distributions: 28
Number of payment days: 15 days
Average dividend per payment: € 9.72
average dividend per payment day: € 18.14
Passive income YTD
YTD I have received distributions in the amount of € 914.50. If you put this in relation to my annual dividend target of € 2,100, the target achievement of the distribution is 43.5 % (target 41.7 %). This means that after several months I am now back above the target, which also shows that we are now facing stronger months again.
The three calculation methods result in the following distribution yields:
YTD distribution yields: 0.98 %
Distribution yields since inception: 4.97 %
Distribution yields YoY: 2.31 %
The distribution yield YoY increased by 0.93%, while the relative fluctuation was 29.54%. This shows that the distribution is growing slightly, but nevertheless from a lower momentum, as the relative fluctuation was always lower in the previous months. We are therefore dealing with a surge, which traditionally characterizes May for me.
My top payers
The top 6 payers in the month under review were:
FIRE Number & Runway
Even though I don't want to sell shares later, I also calculate my FIRE number for comparability with investors who run an exclusively accumulating strategy.
My FIRE figure based on my 12-month spending (TTM) of €12,219.62 was €305,490.50 (previous month: €303,921.50).
That's the minimum amount my portfolio would need to reach to theoretically cover the expenses via a 4% withdrawal. And this figure has risen slightly.
Of course, this figure fluctuates every month. But it's not the only metric to determine how long my assets could support me in an emergency (without taking taxes into account).
The rolling spending range (runway) expresses how long I could live off my assets.
On an annual basis, this is currently 8.16 years (previous month 7.92 years). Compared to the previous month, it has fallen by 0.24 years increased. So I am effectively about quarter of a year more "free" due to the recovery from the current global political events.
Compared to the same month last year, this is an increase of 2.33 years years. I am still 16.84 years away from my runway target (25 years), which corresponds to the FIRE multiplier. 16.84 years away. So there is still a long way to go to financial freedom, assuming that everything continues as before.
The runway stability of 97.49% indicates that my system is solid despite the market turbulence. The proximity to 100% proves that the core of my strategy remains unaffected by the market.
Performance comparison: portfolio vs. benchmarks
To see where I really stand, I regularly compare my portfolio with the major market ETFs. This allows me to see immediately how well my performance (TTWROR) has done in the current month and since the start compared to the overall market.
My portfolio: +2.42 %
$VWRL: +5,97 %
$VUSA: +6.43 %
$IQQY: +3.22 %
I am lagging behind...
Risk figures
Here are my risk figures for the month under review:
Maximum drawdown:
In the month under review: 0.78
since start: 17.17 %
Maximum drawdown duration:
In the month under review: 8 days
since start: 702 days
Volatility:
In the month under review: 2.07
since inception: 28.74 %
Sharpe Ratio:
In the month under review: 13.77
since inception: 0.43
Semi-volatility:
In the month under review: 1.28
since inception: 21.31 %
The maximum drawdown in May of just 0.78 % shows that the dust has settled. While the previous months were still characterized by corrections, the impact in May remains minimal. The Sharpe ratio of a strong 13.77 underlines the excellent risk-adjusted performance in this growth phase.
With a volatility of 2.07% and a semi-volatility of 1.28%, the fluctuations are far below the historical average. This confirms once again that my system is stable. While the long-term values hardly move, I use the calm for my foundation. The focus remains on cash flow, while the risks remain absolutely controlled.
Outlook
I look back on the merry month of May with real satisfaction. Fresh capital flowed directly into the market, the foundation for passive income continues to grow and May delivered a new all-time high: EUR 272.14 in dividends and distributions show in black and white that perseverance pays off.
Privately, May was a real month of pleasure. The trips to Albrechtsburg Castle in Meissen and Wackerbarth Castle, including the Spitzhaustreppe in Radebeul near Dresden, were absolute highlights. The 397 steps of the Spitzhaustreppe made me realize something that I have long known from investing: it always goes up step by step. My running sessions and workouts are now so automated that my strength and endurance grow almost automatically, without any motivational debates.
I conclude this review with real serenity. When the foundation is right and the habits are in place, the market noise loses all its terror. If you build your foundation like a castle, you will not be distracted by any wind.
Thank you for reading. Onwards to June and upwards step by step! 🚀
👉 The review is also available as a YouTube video and as Instagram Carousel posts, which are published as follows:
06.06.2026: Depot review on Instagram (key performance indicators, share performance, allocation, sectors, additional purchases and performance comparisons)
07.06.2026: Budget review on Instagram (income, expenses, cash flow, ratios, budget compliance and citizen money check)
08.06.2026: Cash flow review on Instagram (general, YTD and actual vs. target comparison for passive income, my top spenders, FIRE figure and capital reach)
09.06.2026: consolidated monthly review on YouTube
📲 There are regular videos, shorts, reels and carousel posts on the topics of frugalism, mindset and investing under @frugalfreisein on Instagram and YouTube.
Please pay close attention to the spelling of my alias. Unfortunately, there are too many fake and phishing accounts on social media. I have already been "copied" several times.
I can take it.
Let me know what you think.
Lately I've:
$MPW (+1,87%) (+-0%)
$OHI (+0,42%) (with +40% including dividend)
out of my portfolio, simply because I want to focus more on growth.
$GIS (+2,15%) will probably be the next to go.
I have cybersecurity $CRWD (-2,63%) and $PANW (-1,6%) on the watch list.
Otherwise:

Interesting article on "fallen angels" with high dividends that could make a comeback.
Among other things, the article writes about:
$VRTS (+0%) Virtus Investment Partners
$ALX (-0,95%) Alexanders
$CAG (+2,34%) ConAgra Brands
$WU (+2,56%) Western Union
$PSEC Prospect Capital
Also Kraft Heinz $KHC (+1,89%) Campbell's Soup $CPB (+3,69%) and General Mills $GIS (+2,15%) are also mentioned
https://www.forbes.com/sites/brettowens/2026/05/17/the-most-hated-high-yields-on-wall-street/
Principais criadores desta semana