First, I’d like to officially @Tenbagger2024 officially welcome back from the sidelines! 🫡 It’s great to have you back!
I hope you were able to enjoy your time off, recharge your batteries 🪫, and return with new energy 🔋 and your usual strength 💪. The community has definitely missed a familiar name—without your insights and analyses, things here were almost a little too quiet. 🙇♂️
And what can I say: Your comeback came even faster than that of the German national soccer team after their latest setbacks—so the bar wasn’t set too high. 😂⚽
With that in mind: Welcome back, my friend! I’m excited to see which companies you’ll pull out of your sleeve this time and which candidates will once again be scrutinized mercilessly. 💀
————————————————————————-
While the market focuses its attention on the usual suspects, there are always companies that fly largely under the radar. One such candidate has been on my watchlist for quite some time and is now on the verge of making the leap into my portfolio.
Today, I’d like to show you why I consider this company (another stock from Japan) to be an extremely exciting investment candidate.
Today’s focus is on Hoya Corp $7741 (+4,81%)
HOYA Corp.: The Invisible Monopoly of the Optics & Chip World
While the stock market is fixated on $ASML (-1,16%) ASML’s EUV lithography machines or the mass production of wafers by $2330 , a Japanese heavyweight has established itself in the shadow of the tech giants—one without which not a single sub-3nm processor can be manufactured in the age of AI and semiconductors: HOYA Corporation. $7741 (+4,81%)
HOYA $7741 (+4,81%) does not manufacture finished microchips or hospital diagnostic devices. HOYA $7741 (+4,81%) supplies the physically perfect, high-precision materials upon which all global progress in the chip industry and medical technology is built.
The difference from ordinary suppliers is enormous: HOYA $7741 (+4,81%) combines the explosive, high-margin growth of the AI and semiconductor sectors with the crisis resilience of a global medical technology monopoly.
1. The Business Model: The Highly Profitable Dual Engine ⚙️👁️
HOYA $7741 (+4,81%) scales through a perfectly balanced two-pillar model that hedges the cyclical dynamics of the tech world with defensive healthcare cash flows:
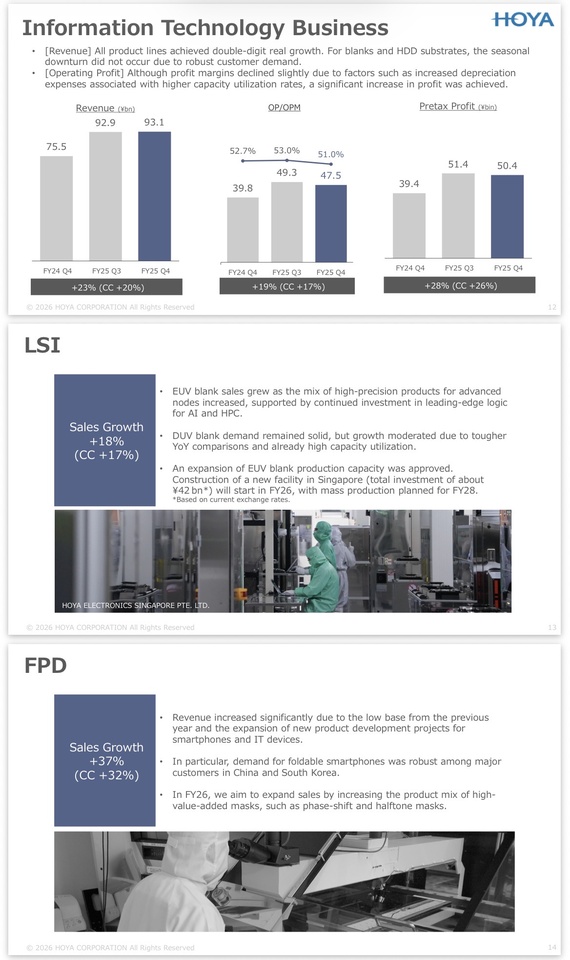
① Information Technology (IT) Segment (~46–48% of revenue):
- EUV Photomask Blanks: High-purity quartz glass blanks that serve as photomasks for the most advanced chip manufacturers (sub-3nm, high-NA EUV). HOYA $7741 (+4,81%) holds a virtual global monopoly in this sector (>80% market share).
- HDD Glass Substrates: Ultra-flat glass substrates for high-capacity hard disk drives in data centers. Glass enables higher storage densities than aluminum—essential for the data deluge generated by AI hyperscalers.
- Operating Margin: A staggering ~54.1%! This segment is a true money-making machine that benefits directly from the AI and semiconductor boom.
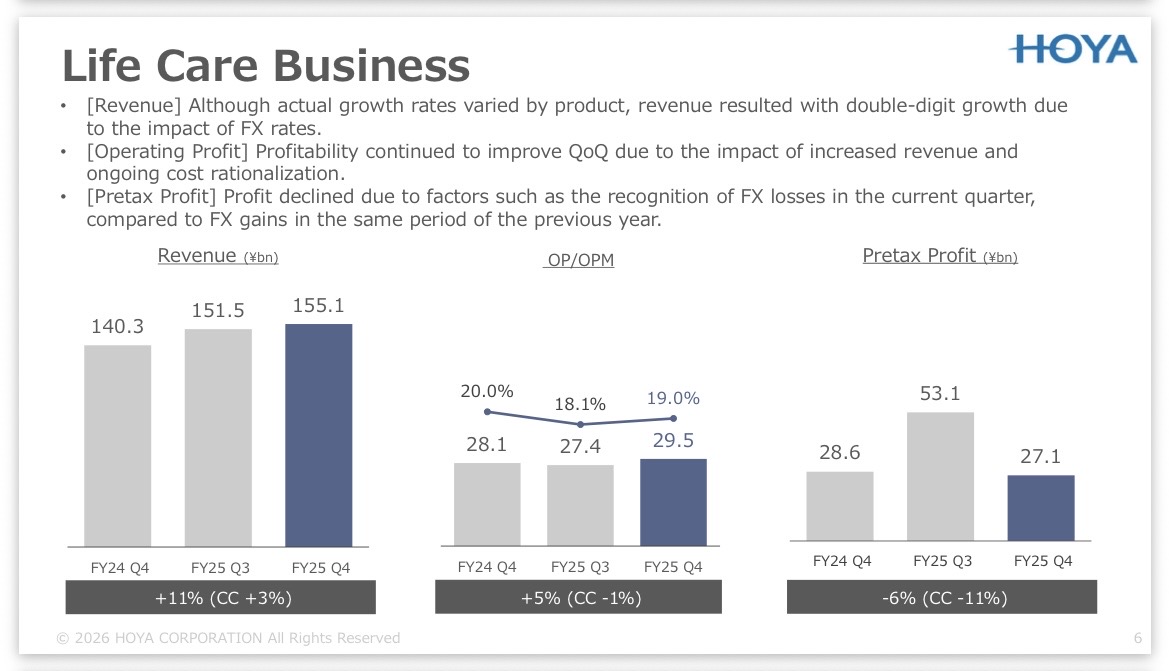
② Life Care Segment (~52–54% of revenue):
- Products: Optometry (eyeglass lenses, contact lenses) and MedTech (PENTAX endoscopes, intraocular lenses for cataracts).
- Operating Margin: Extremely solid ~18.1%.
- Competitive advantage: Provides a crisis-resistant, non-cyclical foundation. Even if the semiconductor industry stagnates, people will still undergo eye surgeries and purchase vision aids.
2. The Technology: Why Sub-3nm & AI Data Centers Would Fail Without HOYA
HOYA’s unique physical selling point $7741 (+4,81%) lies in its its mastery of glass and materials science at the nanometer scale. Two key drivers make HOYA $7741 (+4,81%) indispensable:
- EUV lithography & high-NA EUV: When exposing state-of-the-art chips with extreme ultraviolet (EUV) light, the photomask must be free of any molecular deviations. A tiny defect on the mask can ruin millions of chips. HOYA’s blank materials offer a defect density close to zero. Without HOYA, $7741 (+4,81%) , there would be no yield for $AAPL (-2,89%) Apple Silicon, $NVDA (+2,15%) Nvidia GPUs, or $AMD (-2,55%) AMD processors.
- HDD glass substrates for AI data centers: Cloud storage space is growing exponentially. Conventional aluminum platters in hard drives bend under extremely high rotational speeds and multiple layers. HOYA’s specialty glass is stiffer, flatter, and enables significantly higher storage capacities per hard drive.
The Validation Moat: Just as with tooling suppliers, the approval of a new mask blank or glass substrate at TSMC $2330 , Samsung $005930 or Intel $INTC (-2,75%) is a multi-year qualification process. The switching costs for chip manufacturers are immense.
3. Geographic Distribution: Global Players with Little Home Bias 🌍
HOYA $7741 (+4,81%) is listed in Tokyo, but generates just under 85–88% of its revenue abroad. This provides protection against Japan’s domestic demographic trends and yields massive currency advantages when the yen is weak:
REGION :
🇹🇼🇰🇷🇨🇳ASIA/China
Revenue share: ~35%–38%
Key drivers: semiconductor foundries (TSMC, $2330 Samsung $005930 ) IT packaging hubs
🇪🇺Europe
~28%–30%
Strong life care medtech business (eyewear & endoscopes)
🇺🇸North America
~20%–22%
Data center hyperscalers & U.S. chip design (EUV/HDDS)
🇯🇵Japan
~12%–14%
Medtech sales & optical R&D/manufacturing sites
4. Key Financial Metrics (Fundamental Analysis & Financial DNA) 📊
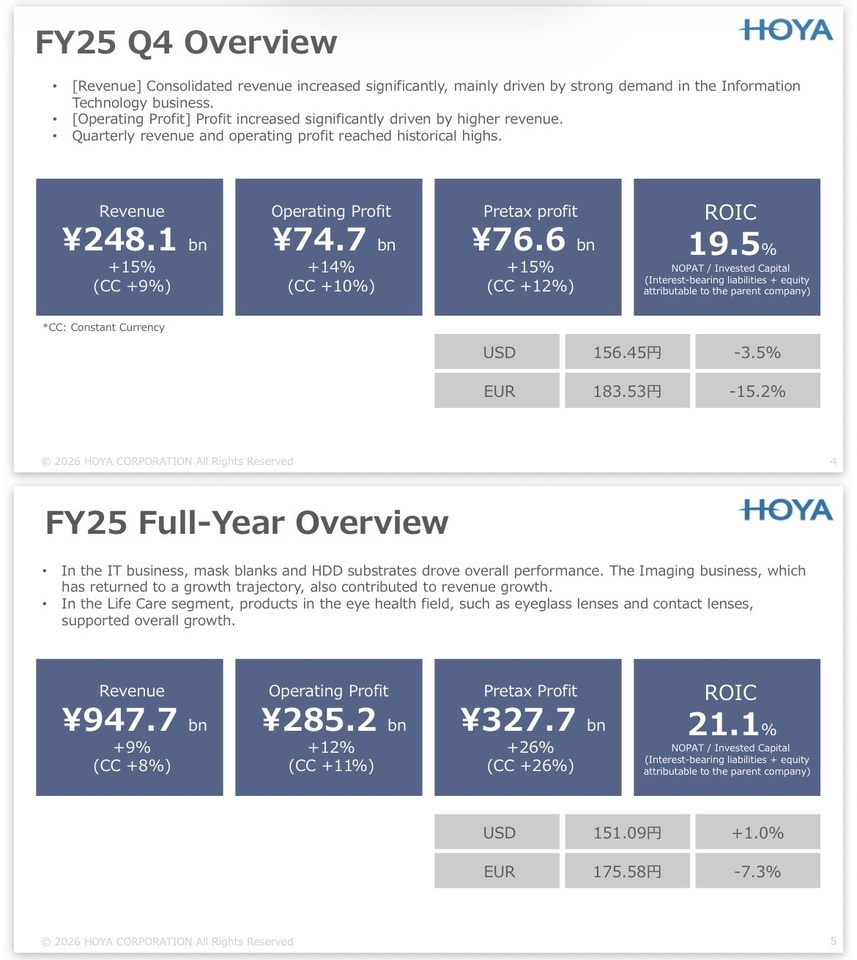
- Market Capitalization: ~6.8 to 7.2 trillion JPY (approx. 42–45 billion EUR) – A true global tech/medtech mega-cap on the Tokyo Stock Exchange.
- Revenue Growth (Segment Dynamics):
- IT segment:
+36% YoY (strongly driven by EUV blanks and AI-driven HDD demand). - Life Care Segment:
+9% YoY (stable, non-cyclical anchor). - Consolidated EBIT margin:
~35–38% – Due to the IT division’s high profit contribution (54.1% margin), the overall performance is on par with the software sector. - Return on Invested Capital (ROIC):
>22% – Indicates excellent opportunities for reinvestment and high capital efficiency. - Free Cash Flow Margin:
>22% – HOYA $7741 (+4,81%) consistently converts operating profits into true FCF. - Balance Sheet Strength: Net debt/EBITDA is negative (net cash). HOYA $7741 (+4,81%) has an extremely large cash reserve and faces absolutely no refinancing risk.
5. Why is this stock exciting? 🚀
The undisputed “hockey stick” segment (EUV boom): As the chip industry switches to high-NA EUV machines from ASML, the demand for even more precise mask blanks is rising dramatically. HOYA $7741 (+4,81%) benefits from every technological leap in the semiconductor industry.
Defensive safety net: If the semiconductor market enters a cyclical correction, the defensive MedTech segment (Life Care) cushions the valuation and ensures rock-solid cash flows.
At the heart of the AI infrastructure hub: HOYA $7741 (+4,81%) benefits twice when it comes to AI: once through the production of logic chips (EUV) and once through the storage of massive amounts of AI data (HDD glass substrates).
6. Risks ⚠️
- Geopolitics in East Asia: Since the majority of the IT business is handled by foundries in Taiwan 🇹🇼 and South Korea 🇰🇷, there is a significant concentration risk in the event of a China-Taiwan conflict.
- U.S. Export Restrictions: Tighter U.S. sanctions against the Chinese chip industry could dampen shipments of high-end substrates and blanks.
- Exchange rate sensitivity (JPY): As a highly export-oriented company (85–88% of revenue from overseas), a sudden appreciation of the yen leads to foreign exchange losses on the balance sheet.
🎯 EARNINGS PREP: What to watch for in the next earnings report?
The upcoming quarterly results (Q1 of fiscal year 2027) from HOYA Corp. are just around the corner:
📅 Date:
Thursday, July 30, 2026 (or July 31, depending on the time zone)
⏱ Time: HOYA typically publishes $7741 (+4,81%) releases its results around 1:30 p.m. JST (approx. 6:30 a.m. German time).
📊 Reporting Period: Just-ended first quarter (3 months ending June 30, 2026).
💡 Analyst expectations (consensus)
Revenue: ~$1.55 to $1.57 billion (driven largely by continued demand in the IT/EUV segment).
Earnings per Share (EPS): ~$1.15
For the upcoming earnings update, the key metrics will primarily focus on the IT division and margin trends. The following points should be on your radar:
1.🎭 EUV & High-NA Blank Volume: Will the strong year-over-year growth in the IT segment (+36%) be confirmed? Pay attention to statements regarding the ramp-up of high-NA EUV photomasks at TSMC and Intel.
2.🏭 HDD Glass Substrate Demand (Hyperscaler Capex): Will call-off volumes for glass substrates continue to rise due to AI data center expansion? This is the second major driver in the IT sector.
3. 🤖Margin Stability in the IT Segment: Can the operating margin in the IT sector hold at the extremely high level of >54% , or will R&D costs for the next sub-2nm generations put pressure on profitability in the short term?
4.🩺 Life Care Stability Check: Will the MedTech segment maintain its steady currency-adjusted growth of ~8–9% YoY with an operating margin of just under ~18%? (Any deviation would indicate weaknesses in the end-consumer market for eyeglass lenses).
5. 💴Yen Effect (FX Tailwinds/Headwinds): To what extent does the exchange rate distort the reported JPY figures compared to organic growth abroad (85–88% of revenue generated overseas)?
My Personal Conclusion & Reaper Rating 🧐
I find that Hoya Corp. $7741 (+4,81%) has been incredibly exciting for quite some time now. To me, the company is the textbook example of a perfect hybrid model: On the one hand, it has a virtually irreplaceable monopoly business that supplies an essential key component for the world’s most advanced semiconductors. On the other hand, the strong, defensive medtech business, with its crisis-proof margins, provides stability that excellently cushions the cyclical fluctuations of the semiconductor sector.
It’s precisely this combination that makes Hoya $7741 (+4,81%) so extraordinary to me. The company combines enormous structural growth with a defensive quality that is extremely rare to find in this form.
Of course, Hoya $7741 (+4,81%) still highly valued, no question about it. However, the stock has already pulled back a bit from its ATH, thereby reducing part of its ambitious valuation. For me, this currently presents an exciting opportunity to gradually build a position in a company that’s been on my watchlist for a long time 👀🙇♂️
💀Jack’s Verdict:
Jack’s Take: “If you’re looking for the perfect CRV on the stock market, sooner or later you’ll end up at HOYA. While the masses, in search of the next hype, are chasing after every shovel seller, HOYA holds the monopoly on the specialty glass from which the shovels are forged in the first place.
With the AI and high-NA EUV boom in full swing, the IT division is raking in profits thanks to >54% margin , it’s printing money like a printing press. If the semiconductor cycle stutters briefly, HOYA remains completely unfazed and continues to sell millions of eyeglass lenses, endoscopes, and cataract lenses. You’re not buying a highly speculative tech bet here, but a highly profitable, net-debt-free fortress with a built-in airbag.”
- REAPER RATING: 🟢 BUY (Quality Compounder)
- REAPER SCORE:
8/10 · Anchor 7–9 (Monopoly-like dual compounder)
@Get_Rich_or_Die_Tryin
@Tenbagger2024
@Raketentoni
@PikaPika0105
@Stocktective
@schlimmschlimm
@Multibagger
@Dividendenopi
@Simpson and, of course, all the others ✌️