Hey, everyone! ☕🍁
It’s great to see so many of you here!
But before we dive deep into the numbers, I have to confess something right off the bat:
Well, that thing about “99% cluster risk & revenue disaster” was, of course, just a nasty clickbait headline—and you all fell for it like a house on fire! 😉
But hey, let’s be honest: It a lie, unfortunately. That number is, after all, set in stone in the financial statements!
After poring over the latest reports in the conservatory with a fresh pot of coffee, we came across a stock that’s currently taking a pretty spectacular nosedive.
We’re talking about TSS $TSSI At first glance, this looks like a total write-off—but anyone familiar with our eye for the extraordinary knows:
It’s precisely where the panic is at its peak that the most exciting turnaround opportunity is sometimes hiding. You’ll find out why the company is still very interesting at the end.
Grab a hot cup of coffee, join us in the heated sunroom, and let’s break this down without any rose-colored AI glasses:
1. Business Model – What Does TSS Actually Do?
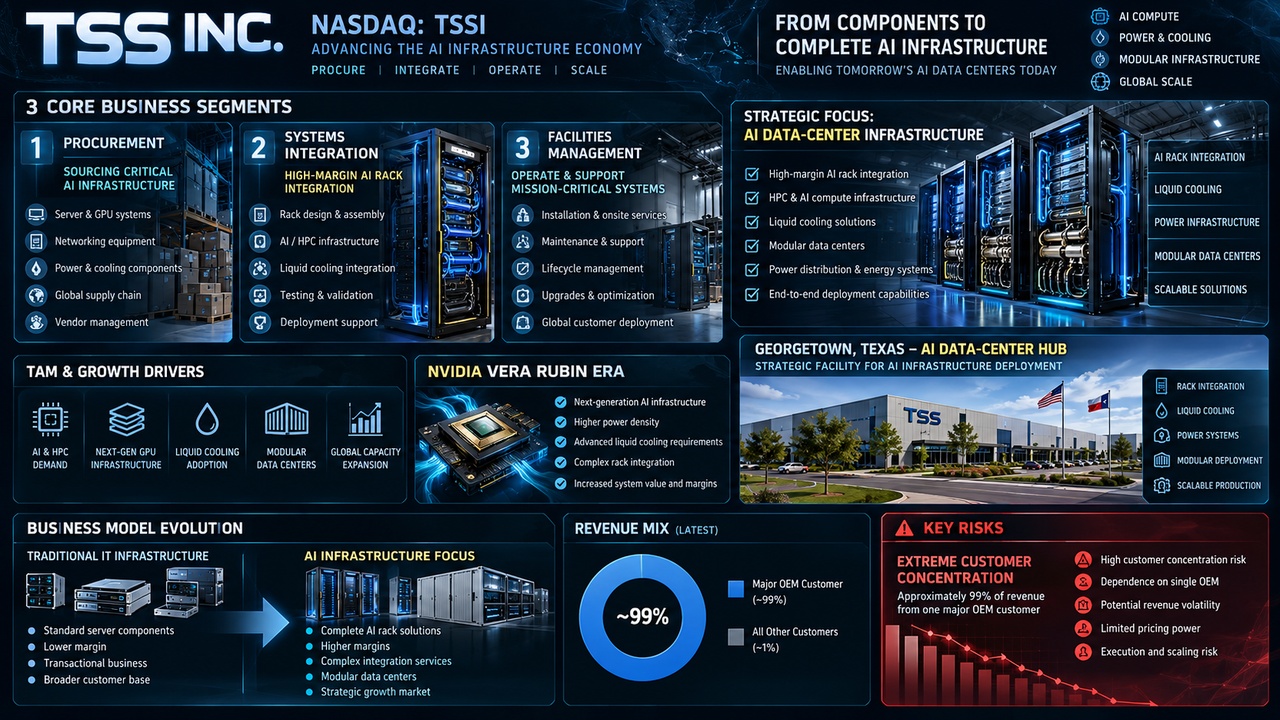
TSS plans, configures, integrates, and operates data center and IT infrastructure. The business is essentially divided into:
Procurement: Purchasing and reselling hardware. High revenue, low margins, and volatile.
Systems Integration: Servers—and in particular AI/HPC racks—are configured, integrated, tested, and deployed for customers.
Facilities Management: Operation, maintenance, logistics, and infrastructure related to data centers.
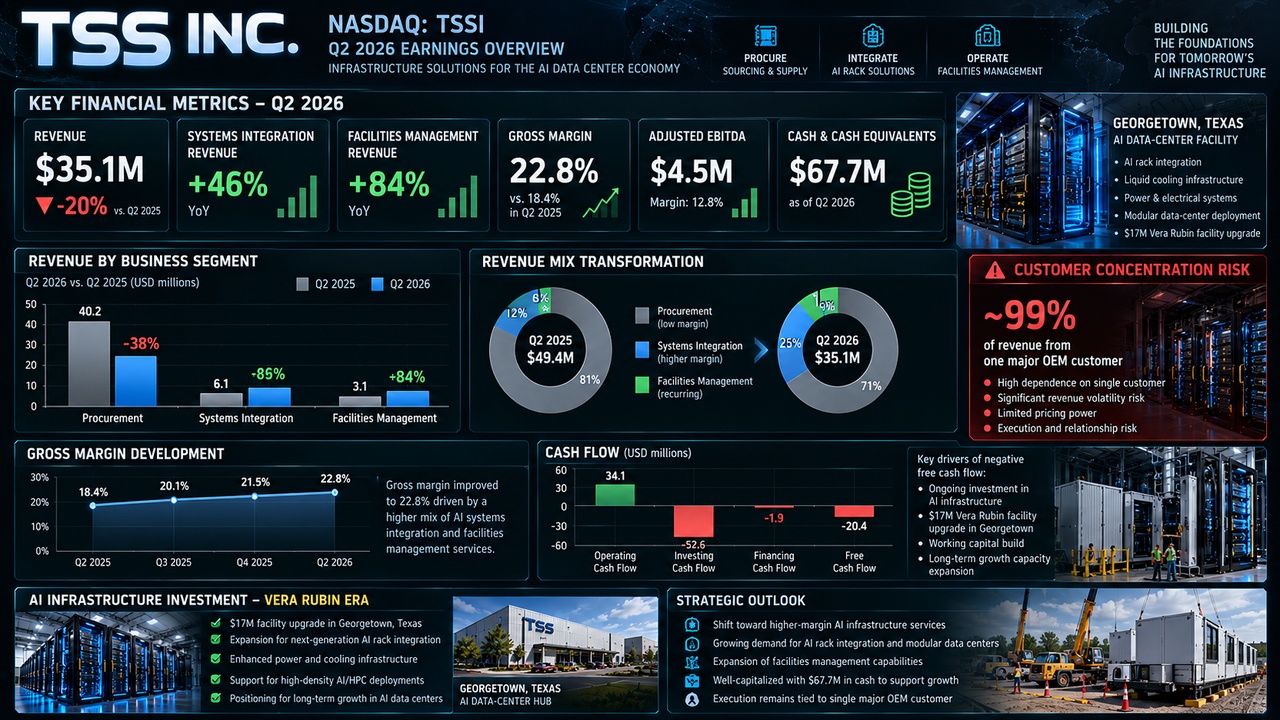
The last two areas, in particular, are exciting. In Q2, Systems Integration grew by 46% to $13.9 million, while Facilities Management grew by as much as 84%. Weak procurement revenue, on the other hand, dragged down total revenue by 20%.
TSS is therefore less of an “AI hardware manufacturer” and more of a provider that ensures the hardware can be installed and operated in the first place.
2. Market Position & Moat—Moat or Garden Gate?
Here, the regulator must immediately pour the first bucket of cold water:
TSS does not have a classic moat.
There is no proprietary chip architecture, no platform with network effects, and no patented miracle technology.
What TSS does have is:
- specialized infrastructure and expertise in high-density computing,
- well-established OEM relationships,
- physical capacity,
- experience with complex rack integrations,
- speed in rolling out new platform generations.
Georgetown, Texas, is particularly interesting. TSS is investing approximately 17 million USDto prepare the facility for NVIDIA’s $NVDA (-2,34%) upcoming Vera Rubin platform . Management expected completion in mid-September and additional revenue primarily starting in Q4.
But there’s an elephant in the room:
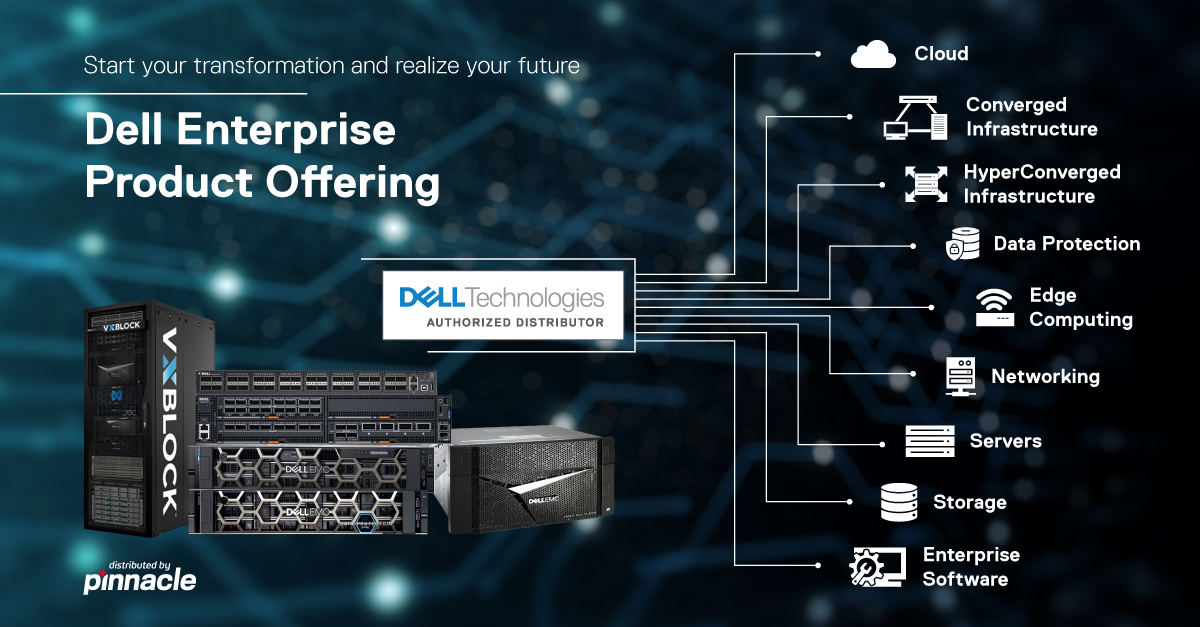
Dell most recently accounted for about 99% of revenue.
That’s not a normal customer concentration. It’s practically a dependence on a single company.
If this relationship ends or Dell $DELL (-6,89%) postpones the integration, the lights could go out here very quickly.
Competitive moat: moderate to weak.
Customer Stickiness: high.
Customer Risk: extremely high.
3. Core Quality Formula
Our formula:
Revenue growth + operating margin
Q2 2026: Total revenue: $35.1 million
Year-over-year growth: −20%
GAAP operating income according to the quarterly table: approximately $2.1 million.
Operating margin:
2.1 / 35.1 = approx. 6.0%
Therefore: −20% + 6% = −14 points
➡️ Core Quality Score: −14
According to the specified scale: <15 = weak/speculative.
That looks brutal—and mathematically, it’s correct.
However, you have to understand why revenue is falling:
Procurement plummeted by 45%, while the higher-value systems integration business grew by 46% and facilities management by 84%. At the same time, the gross margin jumped from 16.4% to 22.8%.
So TSSI is currently a mix-shift/turnaround case, not a quality growth compounder.
4. Cash Flow Quality Formula
Here, things get uncomfortable again.
In the first half of 2026:
Operating cash flow: −7.295 million USD
CapEx: 4.609 million USD
Therefore:
FCF = −7.295 − 4.609 = −11.904 million USD
With a market cap of approximately 262 million USD:
H1 FCF yield ≈ −4.5%
Not annualized. Still, the trend is clear.
The Pro Report also shows a negative LTM FCF yield.
➡️ Cash flow quality is currently weak.
However, significant funds are currently being invested in capacity expansion for Vera Rubin. Therefore, the negative FCF here is understandable, but it cannot be ignored.
The company has sufficient liquidity to afford this expansion at the moment.
5. Dividend Filter
In a nutshell:
Dividend: $0.
Therefore:
❌ No 3.5% yield
❌ Not an income stock
❌ Not a cash flow investment
There’s no sugarcoating it here. TSSI is a growth/special-situation bet.
6. P/E ratio
Depending on the data provider, the following figures are currently reported:
Trailing P/E: approx. 18x
Forward P/E: approx. 27x.
The Pro Report from September 18 showed a trailing P/E of 16.9x and a forward P/E of 37.4x; for a company with very limited analyst coverage, the forward multiples fluctuate significantly.
18x trailing is not expensive for an AI infrastructure stock.
However, 27x forward is not an obvious bargain either, given that total revenue is currently shrinking.
The valuation argument is therefore not: “Cheap stock.”
Rather:
“If the higher-margin AI integration business scales significantly, today’s valuation could look favorable in hindsight.”
That’s an important distinction.
7. P/E Ratio
When it comes to cash flow, the classic KCV is currently of little use.
LTM operating cash flow in the Pro-Report: approximately −9.4 million USD.
With a market cap of around 262 million USD, that would mathematically result in approximately:
P/CF ≈ −28 .
However, a negative KCV has no meaningful traditional valuation interpretation.
➡️ KCV currently unusable / warning sign.
8. P/S
TTM revenue: 193.3 million USD
Market Cap: approx. 262 million USD
Therefore: P/S ≈ 1.36
That’s interesting for an AI infrastructure stock.
If systems integration and facilities management account for a larger share of the revenue mix in the future, a P/E ratio of around 1.3 could certainly be attractive as the overall margin increases. But only then.
9. KBV
Equity as of June 30: approximately 80.3 million USD.
Market cap: approximately 262 million
Therefore: P/B ratio ≈ 3.3
Not a deep value play.
But not an absurd AI valuation either.
For TSSI, book value is significantly less important anyway than the question of how much EBITDA its new infrastructure can generate.
10. Current Figures & Catalysts
At first glance, Q2 was dismal: Revenue: $35.1 million, −20% YoY
Expectations around $47.1 million
EPS $0.05 instead of the expected $0.06.
That’s why the stock took a massive hit after the earnings report.
Under the hood, things looked better:
Systems Integration +46%
Facilities Management +84%
Gross margin 22.8% vs. 16.4%
Adjusted EBITDA +12% to $4.5 million
Management also maintained its FY2026 adjusted EBITDA guidance at the upper end of $20–22 million .
The key catalyst is NVIDIA Vera Rubin
TSS is investing approximately $17 million in power and cooling infrastructure for the next generation of NVIDIA products. The company expects the majority of the revenue contribution from this investment to come primarily starting in Q4 2026.
And this is precisely where regulators need to be meticulous:
As of today, I have not yet been able to find an official announcement stating that the renovation has now been fully completed.
The latest investor relations announcement from September 21 merely concerns an investor event. TSS, Inc.
So no made-up green checkmark. This still needs to be confirmed.
11. Competition & Risks
The risks are not merely cosmetic.
Dependence on Dell: Relying on a single OEM for roughly 99% of revenue is the biggest problem.
Execution Risk: The Vera Rubin expansion must be successful and operate at full capacity.
Supply Chain: Storage, cables, and other rack components sometimes limit throughput.
Volatile Procurement: This can cause extreme fluctuations in a single quarter.
Competition: Larger IT integrators such as CDW, IBM, Accenture, and Rackspace have significantly more resources.
Technological Advances: AI infrastructure is changing extremely rapidly; TSS must invest continuously.
The stock itself: Beta of about 2—this isn’t a stock where you can just sit back and collect dividends.
And once again: The biggest red flag isn’t valuation or debt.
It’s customer concentration.
12. Future Outlook
The key story is this: Today, the business is still dominated by a volatile procurement segment.
Tomorrow, a larger share is expected to come from: AI Rack Integration + Facilities Management + Modular Data Centers .
This would be fundamentally very attractive because these areas generate higher margins.
The CEO even explained during the Q2 earnings call that the company’s current facilities have 2–3 times the capacity of the contractually guaranteed minimum volume; the bottleneck is more a matter of operational efficiency or the supply chain than demand.
In addition, TSS is planning further modular data centers and is explicitly seeking to expand its customer base beyond the currently dominant OEM.
If this succeeds, TSSI could undergo a significant fundamental transformation.
If not, we’ll still have a small service provider that is practically dependent on a single major customer. That’s the bet.
13. Technical Analysis – Weekly Chart
The long-term hype has been completely priced out.
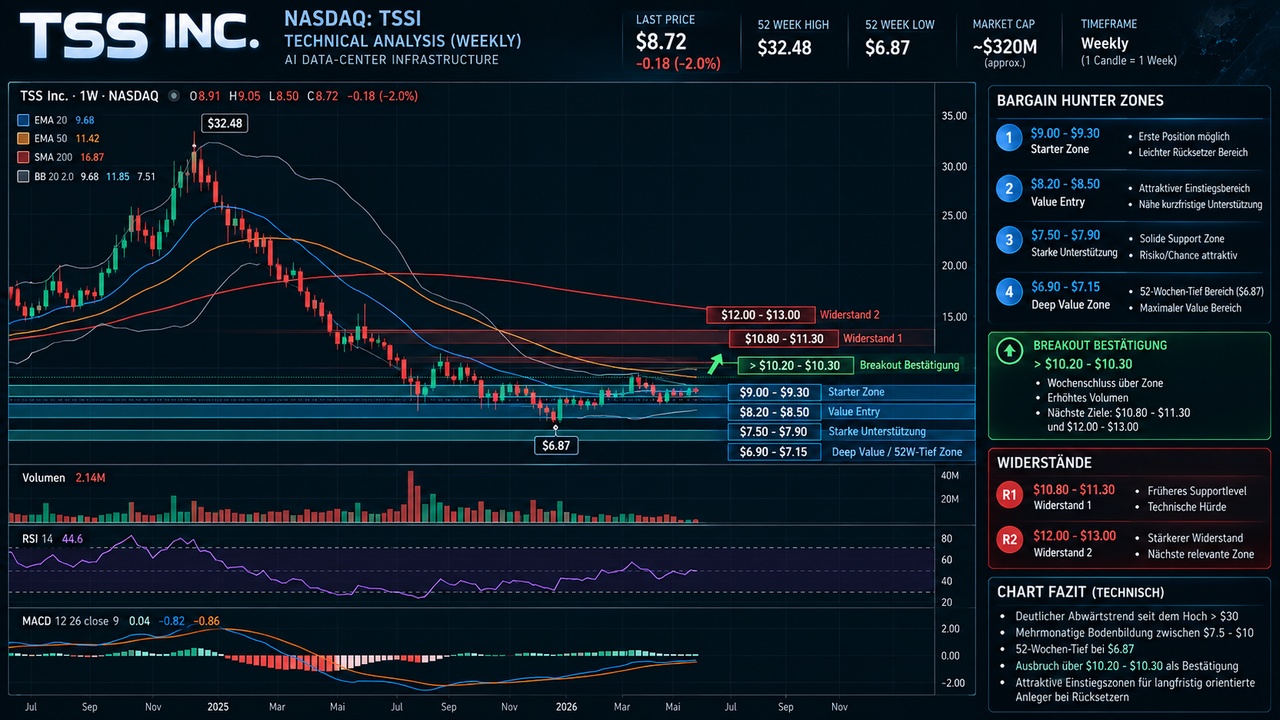
From the range around $30 , the price plummeted. This was followed by a series of lower highs over several months, until it finally stabilized roughly between $7.5 and $9 .
On the weekly chart, I currently see:
Price: back around $9–10
RSI: around the mid-40s—neutral, not overbought
MACD: still below zero, but downward momentum is easing
50-week trend: still problematic
Long-term support: intact
Volatility/ATR: has declined significantly.
In short:
Bottom forming, yes. New long-term uptrend, not yet.
For a speculative turnaround stock, this is actually exactly the phase that gets interesting.
The daily chart is already looking better: MACD is turning upward, RSI has recovered, and since early September we’ve been seeing higher lows.
The first key resistance zone is roughly at: $9.50–$10.30.
After that: $10.8–11.3
and then the significantly tougher zone: $12–$13.
A sustained break above these levels would significantly improve the chart picture.
14. Bargain Hunter’s List – Entry Zones
Now comes the range that the Wintergarten Oversight Committee usually measures with a folding rule.
Zone 1 – Starter: $9.00–9.30
This is the current base. Acceptable for a small entry.
Zone 2 – Good Bargain: $8.20–8.50
Demand has been seen here on multiple occasions. The CRV is becoming significantly more attractive.
Zone 3 – Strong Support Zone: $7.50–7.90
This is the actual September bottom range.
Zone 4 – disaster level: $6.90–7.15
Close to the 52-week low of $6.87. There, the valuation would become extremely attractive—provided there is no fundamental reason for the decline.
And then there’s the momentum scenario:
>$10.20–$10.30 with convincing volume
In that case, you pay a bit more, but in return you get confirmation that the current base has been broken.
Not my favorite strategy:
chasing $10–11 when the stock is already up +10 or +15% in the morning.
15. My Personal Conclusion
All right, feet off the garden table. Now for the reality check.
$TSSI I like it much better than many AI microcaps, because here there’s already:
- a real business,
- real revenue,
- profitability,
- plenty of cash,
- manageable debt,
- genuine AI infrastructure,
- a concrete Vera Rubin catalyst
are in place.
As of June 30, TSS had approximately $67.7 million in cash. The balance sheet is therefore quite solid for a company with a market capitalization of only about $262 million.
What I particularly like is the shift in quality within the business:
Total revenue is down—but high-margin AI integration is surging.
This could be the start of a meaningful transformation.
However: The 99% dependence on Dell is no minor flaw.
That’s why I would never treat TSSI as a safe AI compounder.
Furthermore, free cash flow is currently negative, and the long-term weekly chart hasn’t recovered yet.
So here’s the Terrassenaufsicht verdict:
🟡🟢 TSSI – speculatively interesting, but not yet a quality investment.
No “all in.” No FOMO buy.
But in the range of $8–$9.5 , I find the risk-reward ratio interesting.
If Vera Rubin ramps up as planned, Systems Integration continues to grow at double-digit rates, and TSS simultaneously lands a second major client, the investment case could improve significantly.
For me, this second major client might even be more important than the next impressive revenue record.
Because:
Reducing Dell’s share from 99% to, say, 70–80% would fundamentally transform the company.
Smaller alternatives in the same broader AI infrastructure sector include, for example, Silicom, POET Technologies or Navitas Semiconductor. Some of these companies have more technological leverage, but are either significantly more speculative or are now valued much higher.
As far as I’m concerned, TSSI currently occupies an interesting middle ground:
small enough to offer real upside potential, yet large and operational enough that we’re not just buying PowerPoint slides here.
And so, for now, TSSI gets to keep a seat in the sunroom.
@Keineui
@Aktienhauptmeister
@Multibagger
@Tenbagger-Capital
@Get_Rich_or_Die_Tryin
@Stocktective
@Simpson
@WarrenamBuffet
@SAUgut777
@TradingHase
@PikaPika0105
@Derspekulant1
@NichtRelevant
@Klein-Anleger
@Dividendenopi
And, of course, everyone else :)