📉 Caterpillar $CAT (-1,89%)
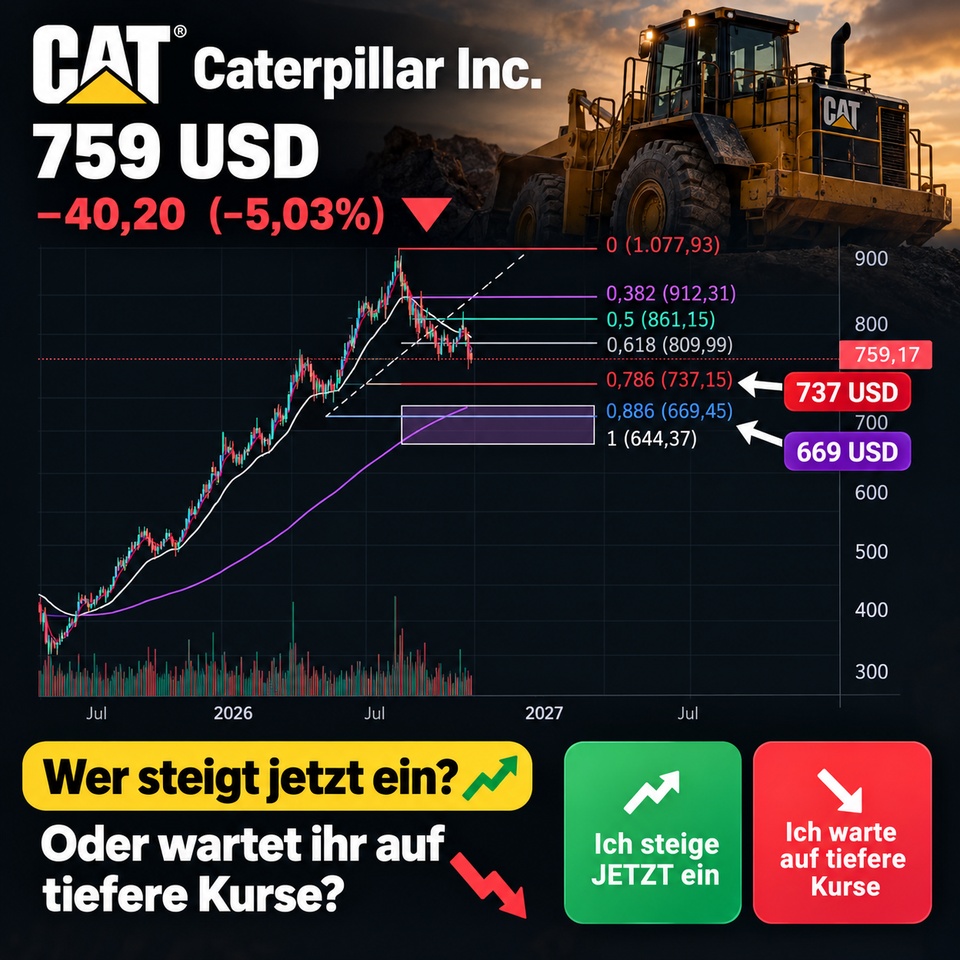
–5% | $759
📊 Next support levels at $737 and $669.
👀 Who among you is buying now, and who is waiting for lower prices?

Postos
128📉 Caterpillar $CAT (-1,89%)
–5% | $759
📊 Next support levels at $737 and $669.
👀 Who among you is buying now, and who is waiting for lower prices?

Hello, everyone,
Inspired by Morlock Motors’ Steel Buddies, today we’re featuring a company spotlight for the tough guys and girls.
But Caterpillar, too, $CAT (-1,89%) investors should be thrilled, too.
(@Simpson )
Updated Luftfrisch Copy (without NEW) in German
My friends, how excited are you?
Oshkosh Corp. stock rises on strong quarterly results
(August 29, 2026)
Oshkosh Corp. stock is benefiting from a jump in earnings in the most recent quarter and a solid analyst consensus, while institutional investors continue to build out their positions.
According to a recent report by MarketBeat Oshkosh reported earnings per share (EPS) of $2.87 in the most recent quarter, compared to the market’s expectation of $2.63, meaning the company beat the consensus by $0.24 (quarter ending June 30, 2026).
During the same period, Oshkosh generated quarterly revenue of $2.92 billion, representing a 6.7 percent increase compared to the same quarter a year ago and underscoring operational strength in its core segments.
The data from the report also shows that the dividend policy has been maintained: For the current year, an annualized dividend of $2.28 will be paid based on a quarterly dividend of $0.57 per share, which corresponds to a yield of approximately 1.5 percent on the current share price.
Institutional investors are increasing their positions
The same market overview highlights that Kingsview Wealth Management established a new position of 38,507 Oshkosh shares worth approximately $5.91 million in the second quarter of 2026, while a total of approximately 92.36 percent of the outstanding shares are held by institutional investors and hedge funds.
For investors, the combination of a rising institutional ownership share and earnings expectations that have been exceeded is particularly relevant, as it signals confidence in the business model and lays the foundation for further upside potential.
Die Oshkosh-Corp.-Aktie legt nach starken Quartalszahlen zu
How Innovation and Defense Contracts Are Driving Growth
Oshkosh is the leading manufacturer of access equipment, specialty vehicles, and military trucks. The company is strategically focusing on forward-looking technologies such as the electrification of its vehicle fleet and autonomous driving capabilities. The ongoing demand for military vehicles ensures growth.
Oshkosh Corporation is an industrial and technology company focused on the design, development, and manufacture of specialty vehicles and equipment. The company operates in three business segments: Access, Vocational, and Transport. The “Access” segment designs and manufactures access and material-handling equipment for use in various sectors—including construction, industry, agriculture, landscaping, and maintenance—to position workers and materials at heights, under brands such as JLG and SkyTrak. The segment’s customer base includes equipment rental companies, construction companies, manufacturing companies, and home improvement stores. The “Vocational” segment includes the brands Pierce, Maxi-Metal, Oshkosh AeroTech, Oshkosh Airport Products, McNeilus, IMT, Oshkosh S-Series, and others. The “Transport” segment designs, manufactures, and maintains world-class specialty vehicles and mobility systems for the U.S. Department of Defense (DoD) as well as for authorized foreign customers.
Number of employees: 18,400
Q2_2026_Earnings_Slides_FINAL.pdf
Secretary of War Pete Hegseth Visits Oshkosh Corporation and Highlights the Strength of American Manufacturing and the Arsenal of Freedom
08/24/26
Oshkosh Defense demonstriert On-Demand-Fertigung von Ersatzteilen in Japan
Oshkosh investiert in KI-Spezialisten Nextera Robotics für Baustellenautomatisierung
Oshkosh Corporation berichtet Ergebnisse des zweiten Quartals 2026
March 30, 2026
Die Oshkosh Corporation wurde zum achten Mal in Folge mit dem CIO 100 Award 2026 ausgezeichnet
Revenue Breakdown by Business Segment:
2025 (USD)
Access 4.49 billion
Vocational 3.73 billion
Transport 2.1 billion
Corporate and Other 104 million
Geographic Revenue Breakdown:
2025 (USD)
United States 8.56 billion
Europe, Africa, and the Middle East 1.12 billion
Rest of the World 376 million
Other North America 366 million
📈 Performance at a Glance
Revenue:
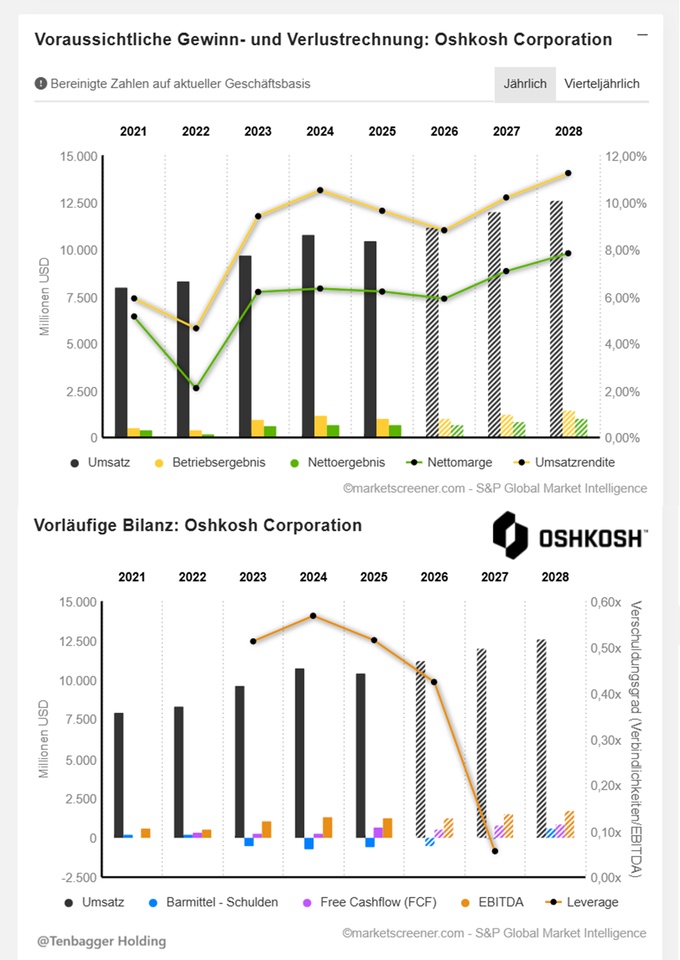
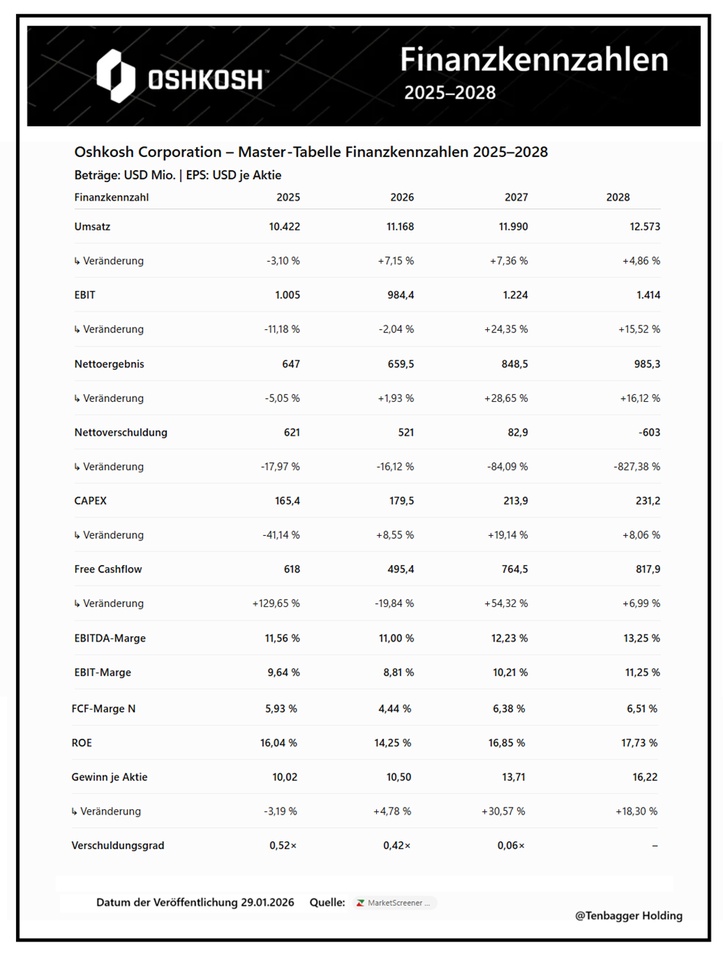
10,422 → 11,168 → 11,990 → 12,573 million USD
EBIT:
1,005 → 984 → 1,224 → 1,414 million USD
Net income:
647 → 660 → 849 → 985 million USD
FCF:
618 → 495 → 765 → 818 million USD
EPS:
10.02 → 10.50 → 13.71 → 16.22 USD
Particularly striking is the significant improvement starting in 2027: EBIT, net income, and EPS are accelerating sharply, while at the same time net debt is falling from 621 million USD in 2025 to -603 million USD in 2028 . A negative value here means that, based on this metric, Oshkosh is expected to have a net cash position .
📊 Performance at a Glance
🟢 Brief Assessment
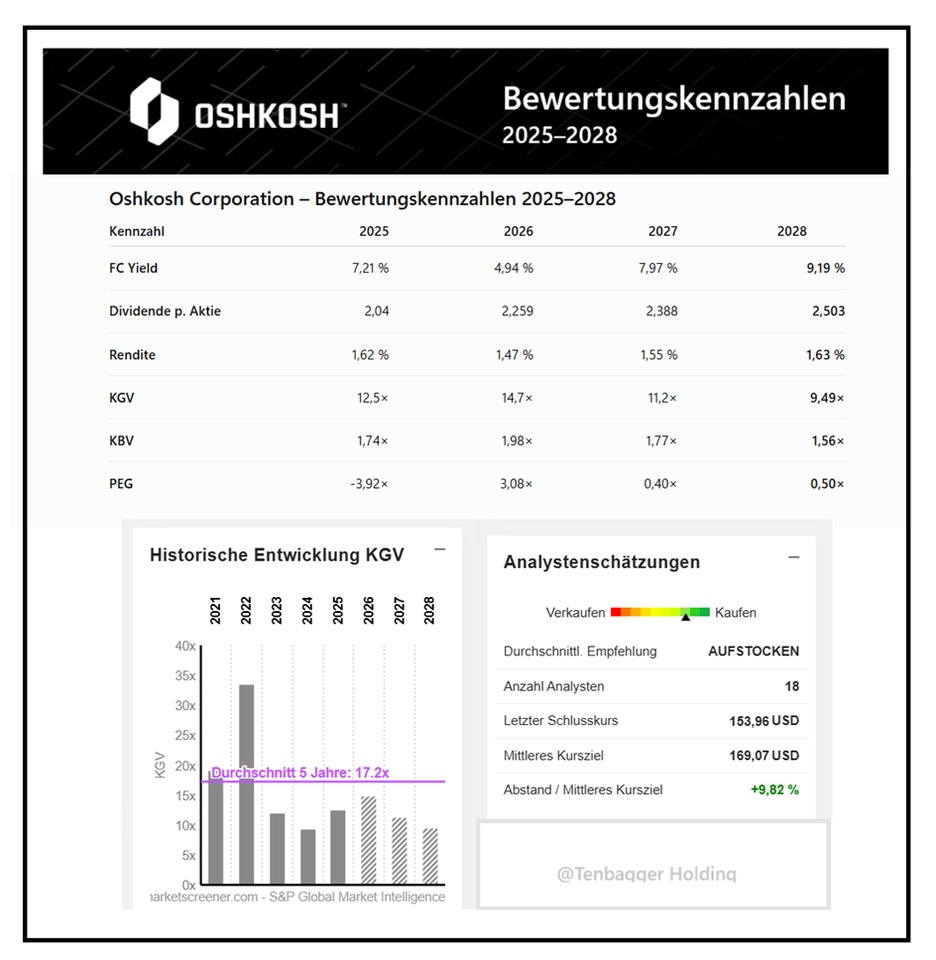
According to current MarketScreener forecasts, Oshkosh’s valuation become significantly more attractive starting in 2027:
From a valuation perspective, this is an interesting combination of earnings growth and declining multiples.
August 31, 2026, 4:51:31 PM •
Lang & Schwarz (EUR)
132.90 EUR
+12.25 EUR +10.15%
+ 3


Here's the hot stuff from Caterpillar Inc.
$CAT (-1,89%) (NYSE: CAT) Q2 2026 Earnings Release, delivered fresh on August 4, 2026, before the U.S. markets opened:
🚀 Top-Line Performance & All-Time Record
Caterpillar, the world’s largest construction equipment and industrial giant, broke every record in the company’s history in the second quarter of 2026 and blew Wall Street estimates out of the water:
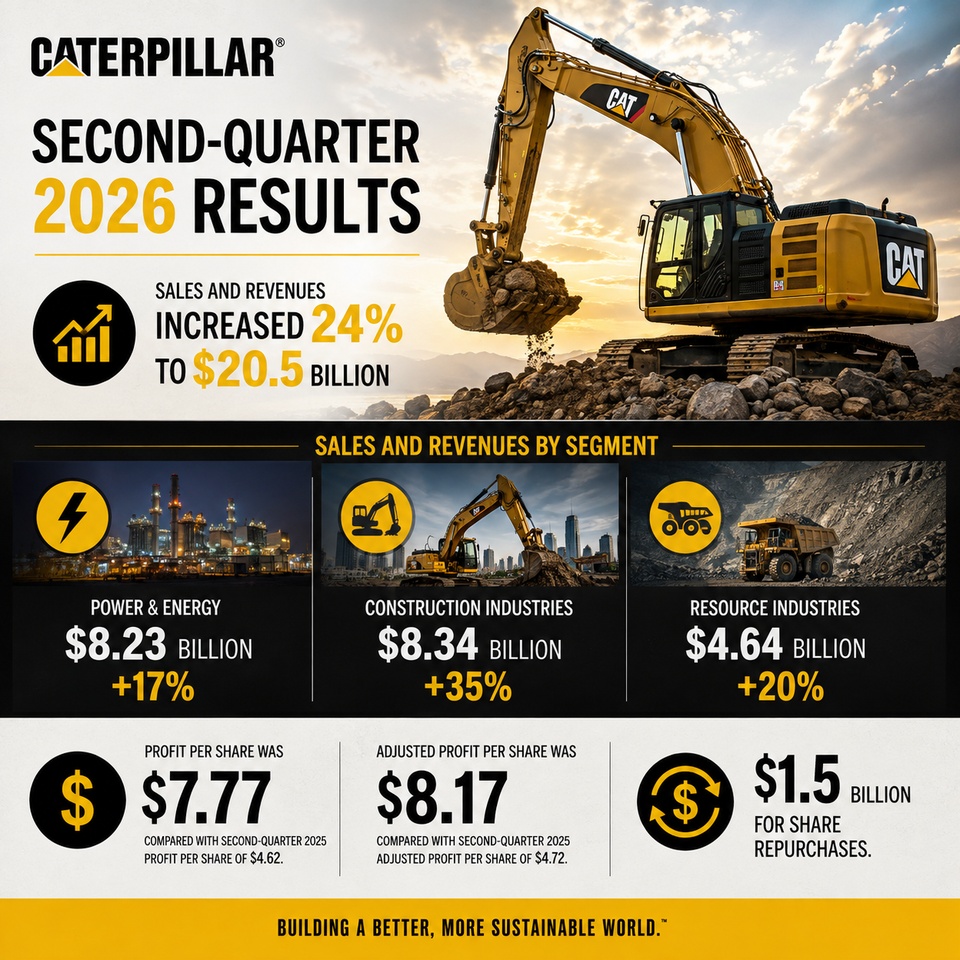
Total Revenue (Sales & Revenues): Soared by +24% YoY to $20.5 billion (up from $16.6 billion in the prior year).
A historic milestone: For the first time in its more than 100-year history, Caterpillar has surpassed the $20 billion in revenue in a single quarter!
Growth drivers: Higher sales volume (+$3.1 billion) and strong pricing (+$595 million). Strong new order intake leads to a further increase in the order backlog across all three primary segments (Construction, Resource Industries, Energy & Transportation).
🔮 Explosive Profitability & Record Margins
In terms of earnings, the industrial giant demonstrates an almost uncanny level of operating leverage:
Adjusted Diluted EPS: Soared by +73% YoY to $8.17 (up from $4.72 in the prior year)—an absolutely massive beat compared to market expectations!
GAAP EPS: Came in at $7.77 (compared to $4.62).
Operating Profit: Climbed by +50% YoY to $4.3 billion.
Adjusted Operating Margin: Expanded significantly by 430 basis points to 21.9% (compared to 17.6% in the same quarter last year).
🤖 Generous cash returns to shareholders
Caterpillar is consistently leveraging its robust cash flows to create value for shareholders:
Capital returns: In the second quarter of 2026 alone, $2.2 billion was distributed to shareholders through share buybacks and dividends.
Balance Sheet Strength: Strong cash generation ensures the continuation of long-standing shareholder returns.
⚡ 💡 Jack’s Take
An absolutely monster earnings report in a class of its own! Caterpillar is making a huge statement with over 20 billion USD in quarterly revenue and a +73% jump in EPS to $8.17. Anyone who thought the global cycle in heavy equipment manufacturing was weakening is being proven wrong by the construction boom, mining demand, and the enormous energy requirements for data centers and infrastructure. Caterpillar is and remains the undisputed bulldozer of the global economy!

⠀
📊 𝐑𝐞𝐬𝐮𝐥𝐭𝐬
• EPS: $7.77 vs. $6.20 est. ✅
• Adjusted EPS: $8.17
• Revenue: $20.54B vs. $19.20B est. ✅
• Operating margin: 20.9% (vs. 17.3% Y/Y)
• Operating cash flow: $4.4B
• Returned $2.2B to shareholders ($1.5B buybacks + $0.7B dividends)
• First quarter in company history with more than $20B in sales and revenue
⠀
🎯 𝐆𝐮𝐢𝐝𝐚𝐧𝐜𝐞
• No formal revenue or EPS guidance provided.
• Management highlighted strong order rates, a growing backlog, and broad momentum across all three core business segments.
⠀
📌 𝐊𝐞𝐲 𝐓𝐚𝐤𝐞𝐚𝐰𝐚𝐲𝐬
• Sales rose 24% Y/Y to $20.54B, driven by $3.1B of higher volume and $595M of favorable pricing.
• Construction Industries revenue jumped 35%, Power & Energy grew 17%, and Resource Industries increased 20%.
• Power Generation demand remained strong, supported by data center applications.
• Operating profit climbed 50% to $4.30B, benefiting from higher sales volumes.
Monday, August 3
3:45 a.m. | 🇨🇳 CHN: RatingDog Manufacturing PMI (July)
8:00 a.m. | 🇩🇪 GER: Retail Sales (June)
9:55 a.m. | 🇩🇪 GER: Manufacturing PMI (July)
10:00 a.m. | 🇪🇺 EUR: Manufacturing PMI (July)
4:00 p.m. | 🇺🇸 US: ISM Manufacturing PMI (July) 🌶
4:00 p.m. | 🇺🇸 US: Construction Spending (June)
Tuesday, August 4
2:30 p.m. | 🇺🇸 US: Trade Balance (June)
4:00 p.m. | 🇺🇸 US: JOLTs Job Openings (June)
4:00 p.m. | 🇺🇸 US: Industrial Orders (June)
Wednesday, August 5
3:45 a.m. | 🇨🇳 CHN: RatingDog Services PMI (July)
2:15 p.m. | 🇺🇸 US: ADP Employment Report (July)
4:00 p.m. | 🇺🇸 US: ISM Services PMI (July) 🌶
4:30 p.m. | 🇺🇸 US: EIA Crude Oil Inventories
Thursday, August 6
8:00 a.m. | 🇩🇪 GER: Industrial Orders (June)
11:00 a.m. | 🇪🇺 EUR: Retail Sales (June)
1:00 p.m. | 🇬🇧 UK: Bank of England (BoE) Interest Rate Decision
2:30 p.m. | 🇺🇸 US: Initial Jobless Claims
Friday, August 7
8:00 a.m. | 🇩🇪 GER: Employment, Q2
2:30 p.m. | 🇺🇸 USA: U.S. Employment Report (Nonfarm Payrolls, July) 🌶
2:30 p.m. | 🇺🇸 USA: U.S. Unemployment Rate (July)
9:00 p.m. | 🇺🇸 USA: Consumer Credit (June)
$PLTR (-0,35%)
$PFE (+0,23%)
$CAT (-1,89%)
$AMD (-2,13%)
$MCD (+1,19%)$SPCX (-2,4%)
$ANET (-5,25%)
$LLY (+2,64%)
$UBER (+2,3%)
$SHOP (+2,69%)
$DIS (+1,28%)
$SNDK (-1,61%)
$WDC (-2,94%)
$COP (-0,89%)
$QBTS (+5,46%)
$DDOG (-1,25%)
$CELH
$DKNG (+1,03%)
$ABNB (+3,66%)
$TTWO (+3,35%)
$PLTR (-0,35%)
$SNAP (+5,13%)
$HSBA (-0,84%)
$9434 (+1,47%)
$ZAL (+3,98%)
$BOSS (+0,34%)
$BNTX (+1,13%)
$SPOT (+1,29%)
$BP. (-1,48%)
$BAYN (-0,99%)
$DOCN (-0,64%)
$MCD (+1,19%)
$CAT (-1,89%)
$PFE (+0,23%)
$ANET (-5,25%)
$PINS (+3,35%)
$SPCX (-2,4%)
$AMD (-2,13%)
$PARA (+2,37%)
$LUMN (+4,61%)
$KTOS (+3,21%)
$CPNG (+2,09%)
$IFX (-2,57%)
$ENR (-0,98%)
$DHL (+2,1%)
$NOVO B (+2,74%)
$CVS (+1,58%)
$UBER (+2,3%)
$SEDG (+2,56%)
$WULF (+9,6%)
$CRCL (+7,74%)
$SHOP (+2,69%)
$DIS (+1,28%)
$HUBS (+5,46%)
$DASH (+3,95%)
$FSLY (+0,09%)
$SNDK (-1,61%)
$MELI (+0,56%)
$DUOL
$APP (+5,92%)
$SMR
$FIG (+6,64%)
$SIE (-1,12%)
$CBK (-0,3%)
$IOS (+2,85%)
$FI (+2,5%)
$DDOG (-1,25%)
$RHM (+5,78%)
$QBTS (+5,46%)
$G24 (+7,29%)
$AKAM (+0,23%)
$MUV2 (+2,31%)
$UA (+0,96%)
$OKLO
$MAR (+3,04%)
$KRYS (-0,78%)
$PLTR (-0,35%)
$STRL (-2,04%)
$SNAP (+5,13%)
$WHR (+1,13%)
$CLX (+0,87%)
$BWXT (+0,89%)
$ON (-0,38%)
$VRTX (+1,29%)
$PFIZER
$CAT (-1,89%)
$MCD (+1,19%)
$HUT (+2,84%)
$WIX (+8,23%)
$W (+4,75%)
$BP. (-1,48%)
$SHLS
$AMD (-2,13%)
$SPCX (-2,4%)
$ANET (-5,25%)
$ALAB (+1,12%)
$OPEN (+15,64%)
$ZETA (+3,91%)
$BKNG (+2,66%)
$KTOS (+3,21%)
$HL (+2,52%)
$LLY (+2,64%)
$SHOP (+2,69%)
$UBER (+2,3%)
$DIS (+1,28%)
$RIOT (+2,51%)
$CIRC
$NOVO B (+2,74%)
$U (+4,09%)
$SNDK (-1,61%)
$APP (+5,92%)
$WDC (-2,94%)
$ELF (+7,03%)
$MELI (+0,56%)
$AXON (+1,31%)
$TTMI (-2,78%)
$RDW (+3,92%)
$QBTS (+5,46%)
$DDOG (-1,25%)
$CLA (+0%)
$FI (+2,5%)
$LNG (-1,12%)
$UUUU (+3,75%)
$HIMX (+0,93%)
$ABNB (+3,66%)
$RGTI (+7,18%)
$TTD (+7,22%)
$AAOI (-2,85%)
$TXG (-1,54%)
$INOD (+5,83%)
$OUST
$MP (+3,42%)
$OKLO
$VST (+1,45%)
$TTWO (+3,35%)
$ACMR (-5,48%)
$WEED (+3,99%)
$UAA (+1,86%)

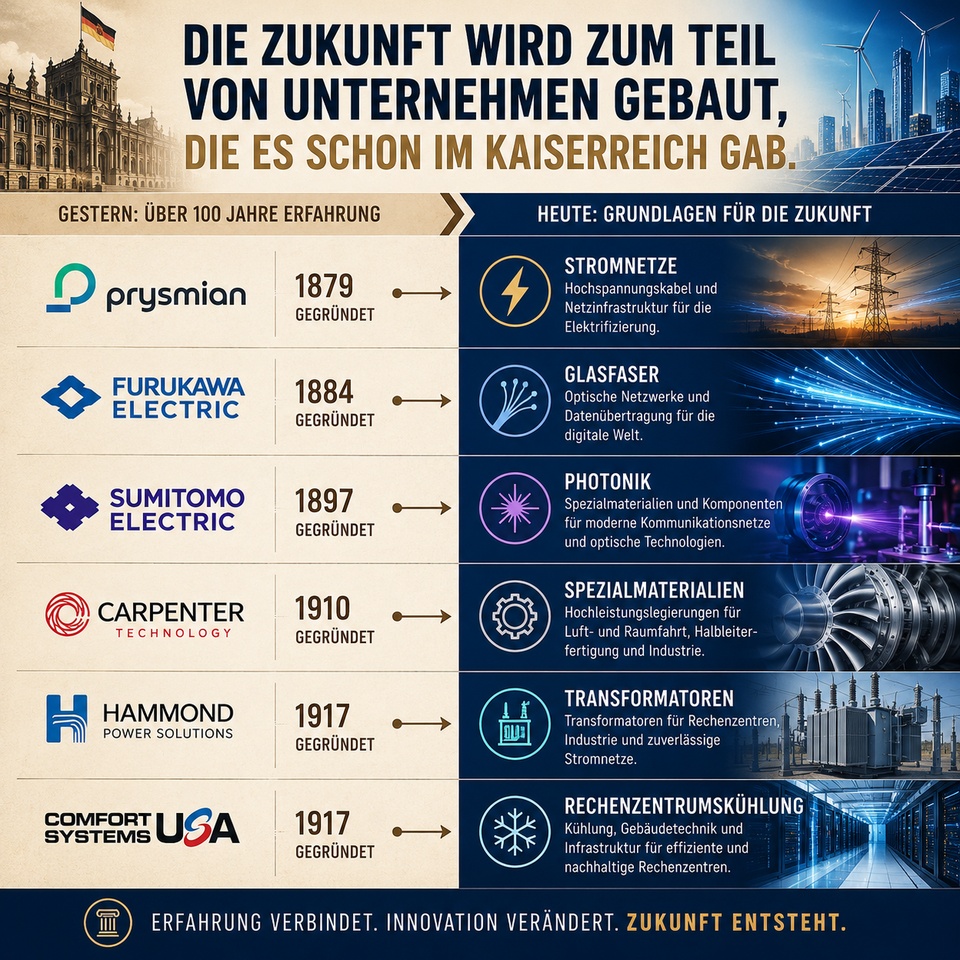
When people talk about future technologies or next-gen technologies, the first thing that comes to mind is startups. In my research, however, I keep coming across companies that have been around for more than 100 years!
A few examples from my portfolio:
• Prysmian (1879)
$PRY (-2,63%)
Electric highways, high-voltage cables, and grid infrastructure for electrification.
• Furukawa Electric (1884)
$5801 (-9,15%)
Fiber optics, optical networks, and data transmission.
• Sumitomo Electric (1897)
$5802 (-4,37%)
Photonics, specialty materials, and components for modern communication networks.
• Carpenter Technology (1910) $CRS (-0,35%)
Specialty alloys for aerospace, semiconductor manufacturing, and high-performance systems.
• Hammond Power Solutions (1917)
$HPS.A (-3,28%)
Transformers for data centers, industry, and power grids.
• Comfort Systems USA (1917)
$FIX (-4,17%)
Cooling, building services, and infrastructure for modern data centers.
The more I delve into AI, energy, photonics, or data centers, the more often I come across companies like these.
New technologies can emerge within just a few years. The industrial infrastructure behind them often takes decades to develop.
That is precisely why it’s not just the companies making headlines that benefit from technological upheavals. Often, those who have been laying the groundwork for generations also benefit.
Another example is Caterpillar $CAT (-1,89%). The company was founded as early as 1925 and today supplies, among other things, the emergency power systems that play a key role in many data center projects.
Hello my dears,
Yesterday we already presented you Jakub's garden party value. But Matteo from Italy was also at the party.
And when Juan told him that his last value from Italy had only arrived mixed. Matteo didn't have to think twice.
Because the three of them had been talking about the good performance of $CAT (-1,89%) Caterpillar's good performance. And they both felt the effects of the ailing rail network on their journey.
So, at the suggestion of Matteo, we would like to introduce you to Tesmec $TES (-1,08%) to you.
Juan, Matteo, Jakub and I, of course, are looking forward to your many comments.
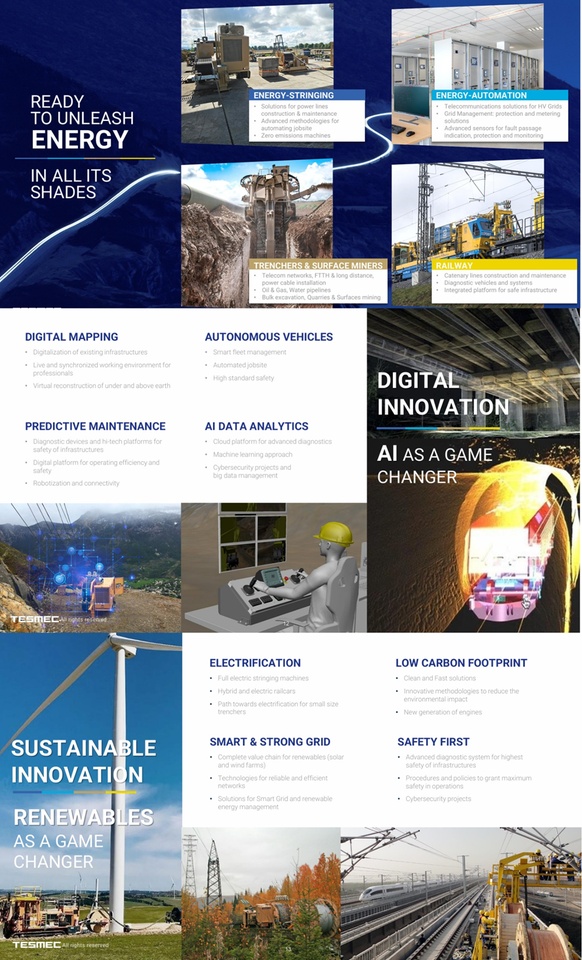
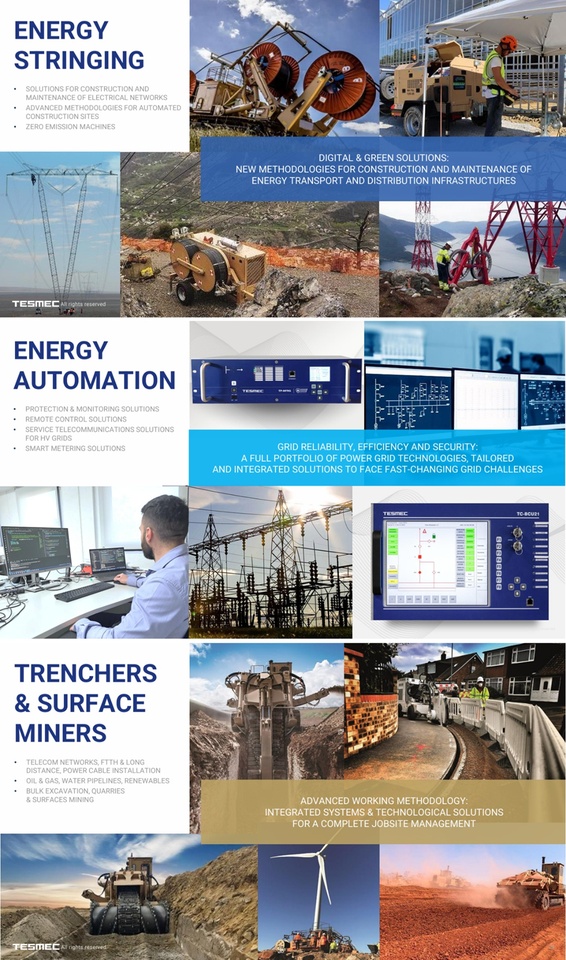
Tesmec SpA is an Italian-based company that develops, manufactures and markets integrated solutions for the construction and maintenance of infrastructures such as offshore and deep-sea networks and pipelines. data and materials as well as technologies for quarries and open-cast mining. Tesmec is mainly active in two markets: The development, manufacture, marketing and sale of integrated systems and machines for the laying of electricity and fiber optic cables and for the laying of railroad power lines and the development, manufacture, marketing and sale of high-performance crawler excavators used in excavation work for the laying of underground networks and pipelines or in earthworks and, to a lesser extent, multi-purpose machines for construction sites. The company operates through subsidiaries such as Marais Technologies SAS and others.
Number of employees: 900
Founded in northern Italy in the 1950s as a family business and now a listed company, the Group has grown over generations, driven by the desire to develop versatile solutions and first-class systems. Over the years, the Group's presence has expanded on all continents, positioning itself as a leading force in the evolution of infrastructures.
OUR VISION
FOR THE FUTURE
OUR MISSION
FOR THE PLANET
COMMITTED TO ENERGY TRANSITION, DIGITALIZATION AND SECURITY
Tesmec Presentation November 2025
Presentations
03/03/2026
Die Tesmec-Gruppe stärkt ihre technologische Positionierung und vergibt zwei Ausschreibungen im Gesamtwert von 71 Millionen Euro mit den Slowenischen Eisenbahnen zur Lieferung von Fahrzeugen für die Instandhaltung des Eisenbahnnetzes. TesmecTesmec bringt die neue Re.M-App auf den Markt: intelligentere, schnellere und vernetztere Flottenüberwachung | Tesmec
In Bulgaria, a new rail-guided, self-propelled OCPC 401 machine for overhead line maintenance was put into operation at Kurilo station on March 10, 2026. The vehicle supplied by Tesmec is the 16th vehicle in a framework delivery of 20 machines; the 17th is due to arrive between March 23 and 27.
Sales breakdown by business division:
2025 (EUR)
Trencher 108 million
Energy 96.65 million
Railway 53.41 million
Geographical distribution of sales:
2025 (USD)
Italy 64.07 million
Europe 44.17 million
North and Central America 40.26 million
Brazil, Russia and China 39.55 million
Middle East 35.11 million
Africa 34.45 million
(All figures in € million)
Short Juan summary (Tesmec, based on your MarketScreener tab)
(compact, clear, the way you always want it)
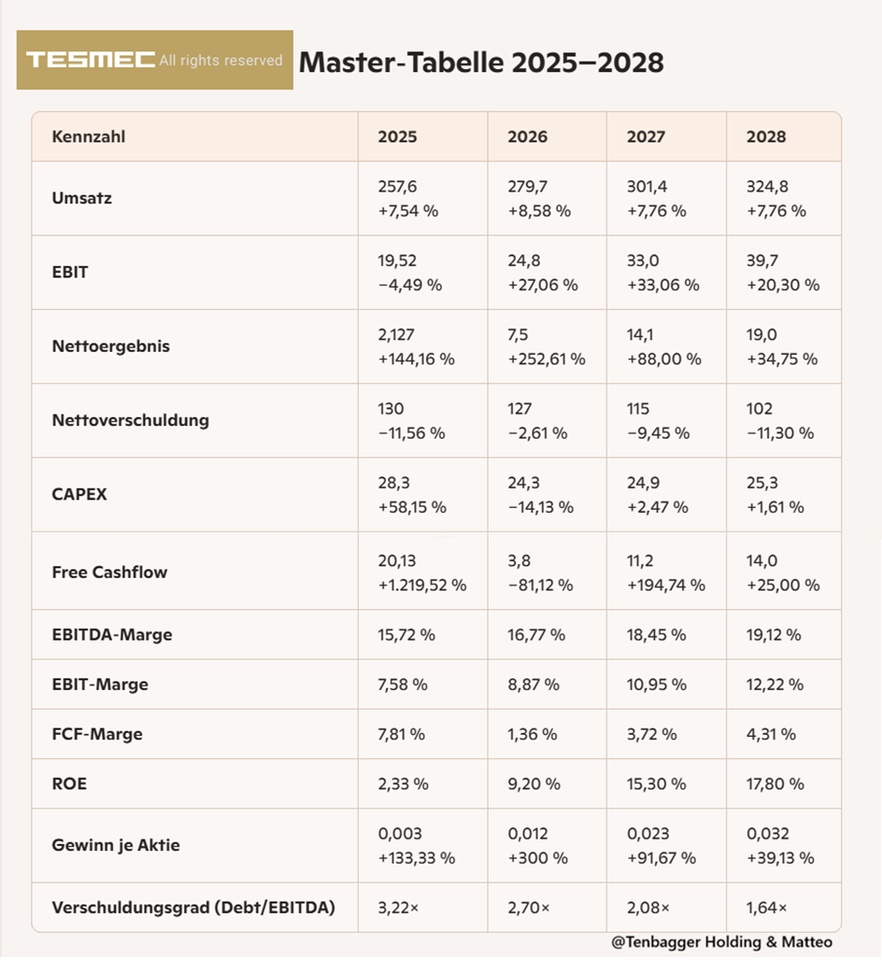
Tesmec picks up cleanly from 2025: Sales grow steadily through each year, EBIT and net income scale much faster than sales - classic operating leverage. Margins improve across the board, especially the EBIT and EBITDA margins. The balance sheet is improving: net debt is falling year on year, leverage ratio is falling from over 3× to under 2×. Free cash flow remains volatile, but clearly positive and rising. From 2027, Tesmec looks like a real quality mid-cap with increasing profitability and decreasing risk.
Market value 170.6
Number of shares (in thousands) 601,748
Date of publication 11.03.2026
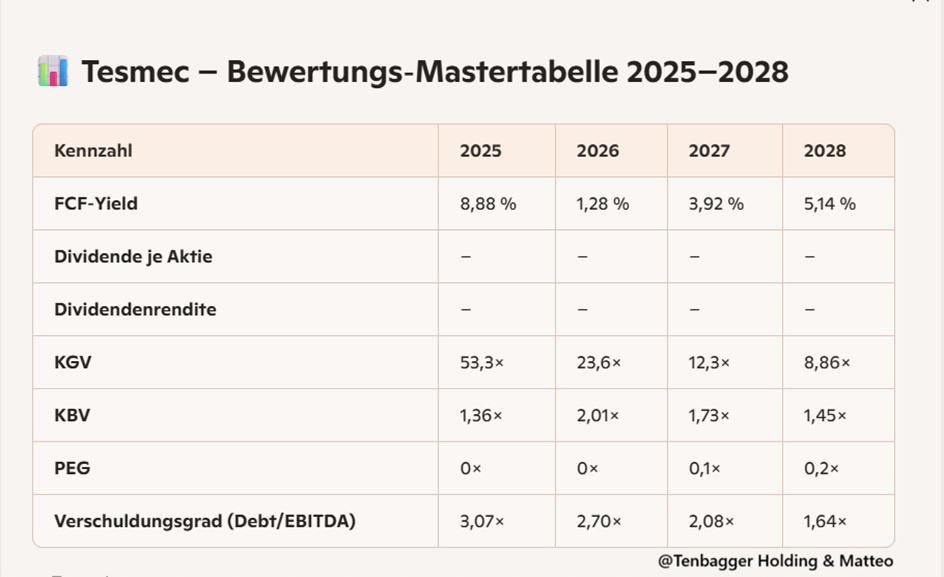
Short Juan summary (Tesmec 2025-2028 valuation)(compact, clear, exactly your style)
Tesmec looks like a classic valuation turnaround: the P/E ratio falls from expensive (2025) to attractive (2028), while the leverage ratio runs cleanly towards 1×. The P/B ratio remains low and stable, which supports the value case. PEG makes sense for the first time from 2027 and shows that growth and valuation fit together again. No dividend, but the FCF yield will increase significantly from 2027. Overall: Tesmec will become cheaper, more stable and of better quality every year - a valuation profile that will become really interesting from 2027.
Short Juan conclusion (financials + valuation)
Tesmec shows a clear picture from 2025: operating leverage + falling debt + falling valuation. Stable sales growth, EBIT and net income grow significantly faster - margins are rising sharply. At the same time, the leverage ratio falls year on year, which noticeably relieves the balance sheet.
On the valuation side, Tesmec is becoming cheaper every year. more favorableThe P/E ratio halves several times, the P/B ratio remains low, and from 2027 growth matches the price (PEG) for the first time. The FCF yield picks up again from 2027 and also confirms the turnaround in terms of cash flow.
In short: Tesmec is developing from a low-margin stock with a strained balance sheet to a more profitable, favorably valued mid-cap with clearly decreasing risk and increasing quality.
Performance
1 week +53.93 %
1 month +113.19 %
6 months +109.65 %
1 year +406.38 %
3 years +118.90 %
29.05.2026, 22:22:35 -
Lang & Schwarz (EUR)
0.278 EUR
+ 5
Principais criadores desta semana