
$MC (-1,2%)
$MBG (-0,17%)
$ULVR (-1,14%)
$PYPL (-0,18%)
$NBIS (+1,46%)
$SPGI (+0,24%)
$UPS (+0,67%)
$KO (-0,05%)
$GLW (+0,93%)
$BA (+1,14%)
$KER (-0,05%)
$ENPH (-0,66%)
$NXPI (+0,62%)
$STX (+3,88%)
$BE (+3,15%)
$V (+0,33%)
$MDLZ (-0,96%)
$000660
$P911 (-0,58%)
$BN (-1,21%)
$RMS (+0,41%)
$BAS (-0,81%)
$AG1 (-1,77%)
$LMND (-1,56%)
$SOFI (-1,62%)
$NDX1 (-1,26%)
$TER (+3,59%)
$GD (-0,59%)
$APH (+0,54%)
$AIR (-1,83%)
$SBUX (+0,71%)
$CMG (+0,09%)
$META (-0,31%)
$FTNT (+2,13%)
$QCOM (+1,1%)
$LRCX (+2,9%)
$HOOD (-2,45%)
$ARM (+0,49%)
$MSFT (+1,14%)
$CVNA (+0,02%)
$005930
$SU (-1,84%)
$INGA (-1,45%)
$OR (-0,6%)
$BMW (+0,18%)
$BATS (-1,83%)
$MA (+0,55%)
$ADS (+0,02%)
$SHEL (-1,08%)
$RACE (-0,59%)
$RDDT (+0%)
$TEM (-0,27%)
$COIN (-2,3%)
$AAPL (+0,13%)
$AMZN (+5,26%)
$CCO (-0,3%)
$LIN (+1,26%)
$ABBV (-0,55%)
$PUM (+2,32%)
$HAG (-0,46%)
$XOM (-0,09%)
$CVX (+0,06%)

Cameco
Price
Discussão sobre CCO
Postos
49Quarterly Results: July 27–July 31, 26


The Week Ahead
Monday, July 27
10:00 a.m.: Germany Ifo Business Climate Index (Germany’s most important economic barometer)
2:30 p.m.: U.S. Durable Goods Orders
4:00 p.m.: U.S. Dallas Fed Index (Manufacturing)
Tuesday, July 28
4:00 p.m.: US CB Consumer Confidence (July)
4:00 p.m.: US JOLTS (Job Openings—important for the US labor market)
Wednesday, July 29
8:00 p.m.: US Fed Interest Rate Decision 🌶
8:30 p.m.: US Fed Press Conference
Thursday, July 30
10:00 a.m.: DE Gross Domestic Product (Q2)
2:00 p.m.: German inflation rate (July) 🌶
2:30 p.m.: U.S. core PCE (Fed’s preferred inflation indicator) & initial jobless claims 🌶
Friday, July 31
11:00 a.m.: EU inflation rate & GDP (Q2) 🌶
3:45 p.m.: US Chicago Purchasing Managers’ Index
$PYPL (-0,18%)
$KO (-0,05%)
$BA (+1,14%)
$MSFT (+1,14%)
$V (+0,33%)
$AZN (-0,37%)
$META (-0,31%)
$HOOD (-2,45%)
$AAPL (+0,13%)
$MA (+0,55%)
$XOM (-0,09%)
$CVX (+0,06%)
$CCO (-0,3%)
$ARM (+0,49%)
$QCOM (+1,1%)



Trades of the day
$GOOGL (+1,38%) slipped on a stop loss then I bought more $AMZN (+5,26%) and more $CCO (-0,3%)
Still looking everyday at my $MU (+3,21%) for the time to sell this gains but it doesn’t stop 🚀


Quarterly figures 04.05-08.05.26
$NCLH (+1,27%)
$PINS (+1,53%)
$SONO (-2,14%)
$PARA (-2,1%)
$PLTR (+4,83%)
$DUOL
$HSBA (-0,98%)
$UCG (-1,73%)
$BOSS (+0,88%)
$UNI (-1,7%)
$CCO (-0,3%)
$PYPL (-0,18%)
$BNTX (+1,95%)
$DOCN (+2,06%)
$SHOP (+1,26%)
$ROK (-0,16%)
$RACE (-0,59%)
$PFE (-0,19%)
$ANET (+4,01%)
$TEM (-0,27%)
$AMD (+1,74%)
$EA
$LITE (+1,2%)
$MSTR (-0,38%)
$SMCI (+2,24%)
$CPNG (+1,26%)
$IFX (+0,64%)
$DTG (-1,93%)
$KOG (+1,12%)
$HFG (+1,5%)
$BMW (+0,18%)
$ZAL (+3,18%)
$CVS (+0,69%)
$UBER (-0,02%)
$OSCR (+2,33%)
$DIS (-0,85%)
$ADYEN (-2,02%)
$DASH (+3,77%)
$FTNT (+2,13%)
$FSLY (+3,06%)
$IONQ (-2,27%)
$SNAP (+2,47%)
$APP (+1,19%)
$ARM (+0,49%)
$ALB (-0,51%)
$DDOG (+5,92%)
$RHM (-2,83%)
$PTON (-0,43%)
$MCD (+0,25%)
$SHEL (-1,08%)
$WULF (+3,46%)

The bull market as camouflage - Why structural problems remain invisible for so long
Reading time: approx. 3 minutes
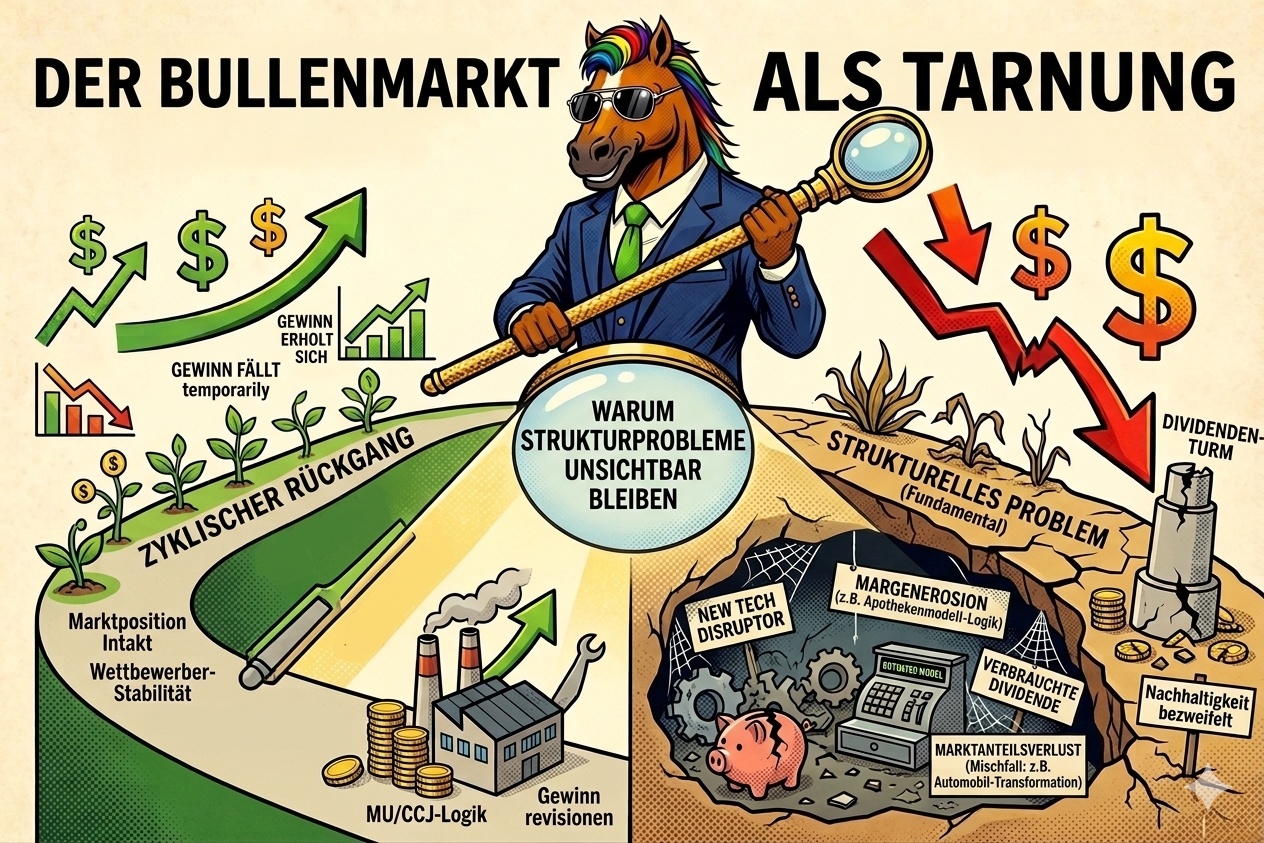
There is one mistake that I consider to be one of the most expensive in investing: confusing a cyclical downturn with a structural problem. Or vice versa. Both cost money, but in very different ways.
The cyclical downturn is temporary. A company earns less because demand is currently weak. The business model is intact, as is the competitive position. Profits recover when the cycle turns. If you sell during this phase, you make a loss and miss out on the recovery.
The structural problem is something else. Here, something fundamental changes in the business model itself. A competitor makes the product redundant, or demand disappears permanently. Profits do not recover because there is nothing to recover. Those who hold on in this phase are waiting for a normalization that never comes.
The difficulty: both look identical on the chart. Price falls, sentiment turns. The difference lies not in the price trend, but in the cause.
I therefore start with a simple question: does the company have a problem, or does the sector have a problem? And if the industry has a problem: Does it resolve itself because it arises from oversupply or temporary weakness in demand? Or is it permanent because a competitor or a technology is changing the basis of the business model?
$MU (+3,21%) Micron Technology is perhaps the most textbook example of the first case. The memory chip market operates in periods of pronounced oversupply and shortage. When prices fall, Micron's numbers look catastrophic. When they rise, profits explode. 2022 was brutal. Demand collapsed, stocks piled up, analysts outbid each other with price target cuts. Anyone who sold back then and bought again in 2023 incurred transaction costs twice and still missed out on the recovery. The core business was never fundamentally called into question.
$CCO (-0,3%) follows a similar logic, with an important overlay. The uranium cycle is slower and politically driven. After Fukushima, it took the market years to separate structural demand from political sentiment. Reactors were shut down and the uranium price collapsed. For many, this looked like a structural problem. But it wasn't. The demand for electricity remained. Nuclear power as a technology remained. What changed was the perception. When that changed, so did the cycle. Those who understood the difference took the reassessment with them.
$CVS (+0,69%) is the counterexample. The pharmacy model has been under pressure for years: pharmacy benefit managers are squeezing margins, bricks-and-mortar retail is losing footfall and the core business is shrinking. CVS is still operating on a large scale and delivering sales. But the market is increasingly pricing in structural margin erosion and regulatory risk, and for good reason. Despite this, CVS was traded as a cheap dividend stock for years. The high dividend yield was seen as a selling point. However, an unusually high dividend yield is often more an indication that the market doubts the sustainability of the payout. This was confirmed in the case of CVS. Anyone waiting for the cyclical recovery was waiting for something that structurally could not come.
$VOW (+0,51%) is the more difficult case, and therefore instructive in another way. The loss of market share in China to BYD and other local manufacturers has a structural core: Chinese suppliers are now competitive in terms of quality and price, this is not a temporary phenomenon. At the same time, a cyclical decline in demand in the premium segment is overshadowing the structural issue in the short term. The two cannot be clearly separated. This makes VW a mixed case: structural core, cyclical overlay. This is not a failure of analysis, this is the reality of many companies in transformation phases. And that is precisely why, in a case like this, I need to at least know which part I attribute to the cycle and which to structural change. Without this separation, a position size can hardly be justified.
What I avoid is holding a cyclical with structural arguments when the cycle is recovering. This is the most common form of self-deception. The story sounds convincing, the share price rises, and at some point you realize that you didn't understand the sector but only participated in the bull market.
The tool that helps me most with this distinction is earnings revisions. That's what the next article is about.


Belgium wants to nationalize nuclear energy
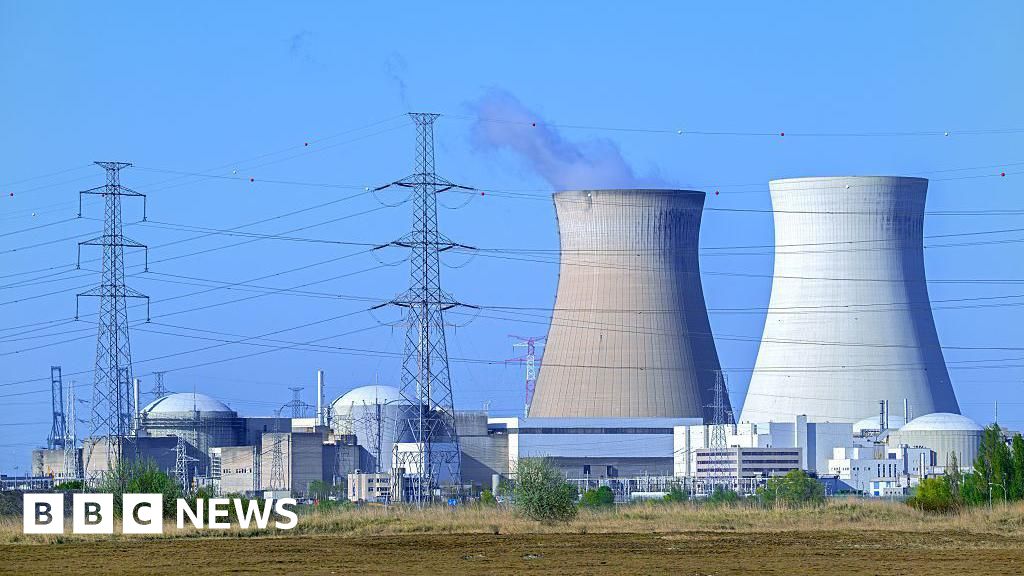
A lot of green today, among other things, the uranium sector is also rising steeply again. Today there was news regarding nuclear power in Belgium, apparently the government is in intensive negotiations with the operator to nationalize the 7 units on 2 sites. It looks like the dismantling of the reactors has been stopped for the time being ☢️ Apparently everyone wants to avoid the situation of the German Leitkultur.
$CCO (-0,3%)
$UEC (+0,43%)
$YCA (-1,27%)
$NXE (+1,91%)
$KZAP
https://www.bbc.com/news/articles/c4g05jg87wko

Podcast episode 138 "Buy High. Sell Low." Iran war winners and losers, buy the dip, oil.
Subscribe to the podcast so that there will soon be peace.
00:00:00 Oil and government bonds
00:37:50 Liberty Energy $LBYE
00:48:30 Cheniere Energy $LNG (-0,62%)
00:56:35 Kinder Morgan $KMI (-1,48%)
01:00:52 Iran war losers / Buy The Dip
01:19:20 Bitcoin
Spotify
https://open.spotify.com/episode/7jouQHLiEbfg5QGyZOdZWJ?si=Du2whTFIR7WOE8AFD1RICA
YouTube
Apple Podcast
$TKA (-1,73%)
$SZG (-0,02%)
$SZGPY (-0,42%)
$HLAG (+0,3%)
$VNA (-1,36%)
$CCL
$AAL (-1,43%)
$SMSD (+7,6%)
$005930
$CONTININS
$TUI1 (-0,03%)
$IFX (+0,64%)
$MC (-1,2%)
$BA (+1,14%)
$2330
$CCO (-0,3%)

The three sources of equity returns - Why it makes a difference where a return comes from
Reading time: about 4–5 minutes
Anyone who buys a stock and later sells it at a profit has generated a return. That’s the simple version. The more interesting question is: Where did this return actually come from?
Depending on the source of a return, it varies in terms of reliability, repeatability, and risk. If you don’t distinguish between these sources, you’ll make poorer decisions about when to hold a position and when not to.
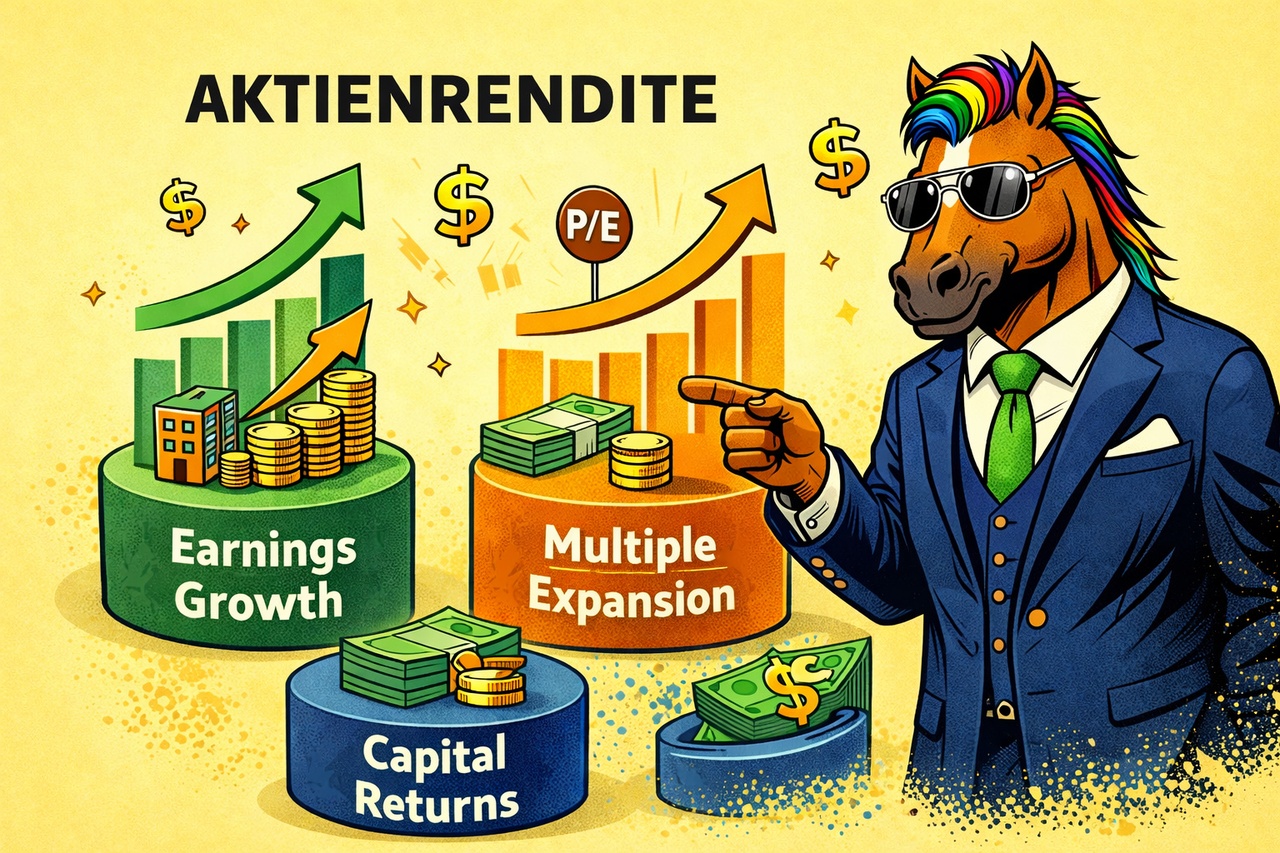
Essentially, there are three sources of stock returns.
The first is earnings growth. The company is earning more than before. Revenue is rising, margins are improving, and profits are growing. The stock price follows suit because a company that earns more is simply worth more.
The second is multiple expansion. The company isn’t necessarily earning more, but the market is paying a higher price for the same profit. The price-to-earnings ratio rises. The valuation expands.
The third is capital return. The company distributes profits or repurchases its own shares. Dividends and buybacks increase the value per share without requiring operational growth.
In practice, these three sources rarely operate in isolation. They overlap, reinforce one another, or work against each other. Nevertheless, it is worth distinguishing between them.
In the long term, earnings growth is the most robust of the three sources. A company that increases its earnings over many years is highly likely to see its stock price rise as well. Markets may react irrationally in the short term. Over five, ten, or fifteen years, however, stock prices almost always follow earnings growth.
$GOOGL (+1,38%) (Alphabet) is a good example. Anyone who bought the stock ten years ago achieved a return of well over 500 percent. The vast majority of that return did not come from changes in valuation. It came because Alphabet systematically earned more. Revenue has multiplied, operational levers have improved margins, and the cloud segment has grown from zero to billions.
Earnings growth is sustainable because it’s based on operational realities, not market psychology. At the same time, it’s harder to achieve. Not every company grows. And even good companies don’t grow at high rates forever.
Multiple expansion is the source that can generate the highest returns in the short term. But it is also the most unreliable.
Here’s a simple example. A company earns ten euros per share. The market values it at a P/E ratio of 15, and the share price is 150 euros. If the P/E ratio rises to 22 without any change in earnings, the share price suddenly stands at 220 euros. That’s a return of nearly 47 percent, even though the company hasn’t earned a single additional euro from operations.
Periods of falling interest rates favor higher multiples. Improved sentiment, new narratives, or capital inflows into an industry can drive valuations higher. Those who are well-positioned can achieve rapid and impressive gains.
The problem is reversibility. What has been created by valuation expansion can disappear just as quickly through valuation contraction.
$CCO (-0,3%) (Cameco) and other uranium producers did not just benefit from rising spot prices between 2020 and 2024. A significant portion of their share price gains resulted from multiple expansion. The market began to take the structural supply deficit seriously and paid higher valuations for it. Those who positioned themselves early benefited from both sources simultaneously: rising profits and rising multiples. Those who entered late were already paying for the narrative.
In my portfolio, this is one of the lessons I’ve internalized from the uranium sector. The structural arguments remain intact. But returns driven by multiple expansion should be evaluated differently from returns driven by operational improvements. The first source can reverse quickly. The second is more fundamentally anchored.
The third source is most often underestimated, especially by investors focused on growth.
When a company repurchases its own shares, the number of outstanding shares decreases. This increases earnings per share, even if total earnings remain constant. Over many years, this effect can be significant.
$HON (-0,43%) (Honeywell) is an example. The company is growing at a moderate pace. But over the past few years, Honeywell has systematically returned capital to shareholders through dividends and buybacks. Part of the return on this position did not come from spectacular growth, but from this mechanism: a high-quality company that uses its free cash flow in a disciplined manner.
If a company can find no better use for its capital than repurchasing its own shares, that is often a rational decision—provided the stock is not massively overvalued. A buyback at an inflated valuation destroys value; at a fair or undervalued price, it creates it.
The most attractive investments are often those where all three sources are at work simultaneously. A company that is growing, fairly valued, and also returning capital offers a structurally favorable opportunity profile. $GOOGL (+1,38%) Alphabet is another good example. Growth has been the dominant source for many years. In recent years, Alphabet has also begun repurchasing significant amounts of its own shares. The return of capital has become a complementary source, without replacing the growth narrative.
The reverse pattern is just as important. If a return has stemmed almost exclusively from multiple expansion, the position is more vulnerable to shifts in sentiment, even if nothing has changed operationally.
That’s why I regularly ask myself this question regarding my positions: Where did the return to date come from? And what source will drive future returns?
In hindsight, stock returns often look the same. A stock rises by 80 percent. But that 80 percent can come from completely different sources. From earnings growth, which is likely to continue. From valuation expansion, which can reverse at any time. Or from capital returns that are structurally embedded. Earnings growth unfolds its value over time. Valuation expansion unfolds it quickly and takes it away just as quickly.
Capital returns work quietly but reliably in the background.
The next post will examine the second of these sources in detail. Valuation expansion is the phenomenon that generates the highest returns in the short term and is, at the same time, the least understood. What really drives changes in valuations? And when do investors pay for it without even realizing it?

Quarterly figures 09.02-13.02.26
$UCG (-1,73%)
$MNDY (+3,6%)
$KER (-0,05%)
$BARC (-3,61%)
$OSCR (+2,33%)
$CVS (+0,69%)
$SPOT (-1,59%)
$DDOG (+5,92%)
$BP. (-0,93%)
$SPGI (+0,24%)
$HAS (+0,46%)
$KO (-0,05%)
$JMIA (-2,28%)
$MAR (+1,22%)
$RACE (-0,59%)
$UPST (-1,28%)
$NET (+1,23%)
$LYFT (+1,34%)
$981
$NCH2 (-1,54%)
$DSY (+0,89%)
$1SXP (+3,88%)
$HEIA (+0,64%)
$ENR (-0,79%)
$DOU (-3,3%)
$OTLY (+7,71%)
$TMUS (-0,47%)
$SHOP (+1,26%)
$KHC (-1,72%)
$FSLY (+3,06%)
$HUBS (+0%)
$CSCO (-0,31%)
$APP (+1,19%)
$SIE (-0,92%)
$RMS (+0,41%)
$BATS (-1,83%)
$MBG (-0,17%)
$TKA (-1,73%)
$VBK (-1,33%)
$DB1 (-0,47%)
$NBIS (+1,46%)
$ALB (-0,51%)
$BIRK (-3,15%)
$ADYEN (-2,02%)
$ANET (+4,01%)
$PINS (+1,53%)
$AMAT (+1,36%)
$ABNB (+1,67%)
$TWLO (+6,13%)
$RIVN (-0,62%)
$COIN (-2,3%)
$TOM (+1,85%)
$OR (-0,6%)
$MRNA (+5,18%)
$CCO (-0,3%)
$DKNG (+4,77%)



Infrastructure and waste disposal: The profiteers of the nuclear boom
Dear Community,
Where the hunger for energy is being met by nuclear power and the new generation of Small Modular Reactors (SMRs), a massive growth market for downstream services is inevitably emerging.
This applies above all to nuclear waste disposal, the professional dismantling of old plants and the recycling of fuels and water.
Since there is currently no pure "nuclear waste ETF" (at least that I am aware of), we investors must focus on specialized individual stocks that are global leaders in the disposal of uranium and contaminated components (including water).
1. the operational heavyweights for dismantling and disposal
- Veolia ($VIE (-1,98%)
): Although Veolia is primarily perceived as a global environmental services provider, it also operates a nuclear power plant with Veolia Nuclear Solutions a highly specialized division. As the global market leader in robot-assisted cleaning and the dismantling of highly radioactive sites (such as Fukushima), they are indispensable. They offer technologies for the vitrification of waste ("vitrification", the transformation of liquid or solid nuclear waste into a solid glass body) and for water treatment in contaminated areas. Veolia thus bridges the gap to the traditional water business and covers two key areas in its portfolio at the same time.
- Fortum ($FORTUM (-2,6%)
): The Finnish energy group is a hidden champion of nuclear aftercare. In addition to operating power plants, Fortum offers specialized services for the purification of radioactive liquids (NUKEM technology) and final disposal. They are a key player in European waste management standards.
- Jacobs Solutions ($J (-1,59%)
): The US engineering services giant manages major government nuclear sites such as Sellafield (UK) and Hanford (USA). Its focus is on program management for the long-term storage of fuel elements. The SMR connection is particularly exciting: Jacobs is already advising numerous developers on planning the entire life cycle, including disposal.
- Perma-Fix Environmental Services ($PESI (-1,91%)
): Perma-Fix is regarded as one of the few genuine "pure plays". The company operates its own facilities for the treatment of nuclear and mixed waste. Its core competence lies in massively reducing the volume of nuclear waste before it is transferred to a final repository.
2 The fuel cycle: Cameco and Westinghouse
Cameco ($CCO (-0,3%)
) is primarily known as a uranium producer, but together with Brookfield Asset Management holds a majority stake in Westinghouse Electric Corporation (electrical engineering). The company thus covers the entire cycle:
- Operations: Cameco produces uranium concentrate (yellowcake), while Westinghouse supplies the reactor technology and maintenance.
- Disposal expertise: Through Westinghouse, Cameco covers the lucrative "back end". This includes the decontamination of process water as well as the conditioning and volume reduction of of radioactive waste.
- Dismantling service: As a technological market leader, the team offers solutions for the dismantling (D&D) of old plants, using specialized filter systems to clean contaminated liquids.
- Market model: Sales are stable through long-term supply contracts. The service division makes the company less dependent on fluctuations in the uranium price, as maintenance and waste treatment are permanent tasks required by law.
Energy Fuels ($UUUU (-2,55%)
): This company occupies a strategic niche. In its White Mesa Mill they recover uranium from residual materials and waste from other industries. This positions Energy Fuels as a pioneer in "uranium recycling", which reduces dependence on primary extraction and makes waste streams economically viable.
3. specialty materials and water technology
In the nuclear industry, water is not only a coolant, but often also a transport medium for contaminants. This is where the technology leaders come into play:
- Xylem Inc. ($XYL (-0,24%)
): As a pure water technology company, Xylem supplies the heavy-duty pumping and filtration systems that are essential for the cooling circuits of modern reactors and subsequent wastewater treatment.
- Danaher Corporation ($DHR (-2,08%)
): Via the divested environmental division Veralto Danaher offers high-precision analytical instruments for monitoring water quality - a critical component for detecting leaks and contamination in real time.
- Umicore ($UMI (-4,94%)
): The materials technology group is pursuing a "closed-loop" model. In the long term, its expertise in recovering metals from complex industrial waste could play a role in the recycling of power plant components.
The new generation of reactors: SMR specialists in detail
When it comes to direct energy supply for the AI sector, two companies are in the spotlight:
- NuScale Power ($SMR
): The conservative pioneer relies on proven light water reactor technology (VOYGR™). As NuScale traditionally relies on water, the need for water technology (pumps, filters from suppliers such as Xylem) is extremely high. This makes NuScale an ideal partner for traditional infrastructure investors.
- Oklo Inc.$OKLO
): The radical innovator (supported by Sam Altman) develops "fast reactors". The key feature: these can be fueled with recycled nuclear waste (HALEU). Oklo transforms a disposal problem directly into an energy source and thus addresses the waste problem at its root.
Strategic conclusion
If you want to bridge the gap between water cooling and waste disposal, you will find in Veolia the most stable connection.
Jacobs Solutions and Perma-Fix are the most direct options for physical dismantling.
Energy Fuels offers an exciting bet on the recycling of uranium residues, while Xylem and Danaher provide the indispensable technological basis for water management in a nuclear renaissance.
However, the decisive strategic winner of the current nuclear renaissance could be the team of Cameco & Westinghouse ($CCO) (-0,3%) could be:
By merging uranium mining and reactor technology, they have created a vertically integrated business model. They not only profit from the sale of the fuel, but also control the entire downstream value chain via Westinghouse - from the purification of the process water to the final storage preparation.
As a result, Cameco has risen from a pure mining player to an indispensable infrastructure partner for the energy and AI economy.
In addition, the 80 billion dollar agreement with the US government agreed at the end of 2025 is likely to have cemented Cameco's long-term market leadership in the West (https://de.marketscreener.com/boerse-nachrichten/westinghouse-electric-cameco-und-brookfield-starten-80-milliarden-dollar-offensive-fuer-atomkraft-in-ce7d5ddcd88cf127).
Risk analysis
The nuclear renaissance is more real today than it was ten years ago, but as investors we need to look at two sides of the coin:
Opportunities through regulatory certainty: Waste disposal and dismantling are not "optional services", but permanent tasks prescribed by law. Financing is often already secured by existing provisions of the groups, which makes the service providers (Veolia, Jacobs, Perma-Fix) crisis-resistant.
Risks: Political risks remain. A change of government can delay approval processes for final storage facilities. In addition, the sector is highly emotional; ESG ratings often (still?!) determine how much capital actually flows into the shares.
Could water and waste management technology end up being the safer investment than the actual SMR builders, because it makes money from every technological outcome? How do you see the risk/reward ratio?
Best regards and thank you very much for the positive response and all the feedback on my previous and very first post ✌🏼
Anderlé

Personally, I am currently still playing the hype cycle around the manufacturers, as I expect a greater return here in the short term. In the long term, however, the music is at least as strong here.
Títulos em alta
Principais criadores desta semana