Okay, today a little "shitposting" (or as the Germans would say: shitposting).
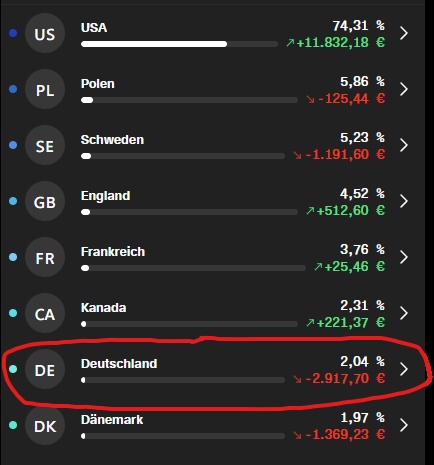
But you really have to realize how bad the German stock market is actually doing. I really think it's my biggest rookie mistake as an individual stock investor that I bought into this nonsense about "global diversification" and "broad diversification" in the first place.
There are simply countries that are un-diversifiable on average, and unfortunately these include not only various emerging markets but increasingly also some European nations.
And this is actually structural. Topics such as "small caps" and "hidden champions" in particular can now be flushed down the toilet because politicians ... let's say ... create suboptimal economic conditions in Europe.
What we are seeing here is not exclusively due to poor stock picking, but is also indicative of how badly the German stock market as a whole is doing. You can look at the ETX index $DEAM (+0,15%) index and see that the MDAX (which still forms the backbone of the German economy) has not generated any returns at all over a five-year period.
Does anyone remember that a few years ago it was always said that Germany didn't have any great global corporations in the IT sector, but that German SMEs with their technology leaders and highly specialized niche providers would make up for everything? What's left of that? Fiddlesticks! Whether $RAA (-0,28%) or $NEM (-0,94%) or $AFX (+0,25%) or $SRT (+0,15%) or $BC8 (-0,07%) - many German beacons of hope, especially in future markets, have failed and all at the same time. Let's not even start with BionTech this time.
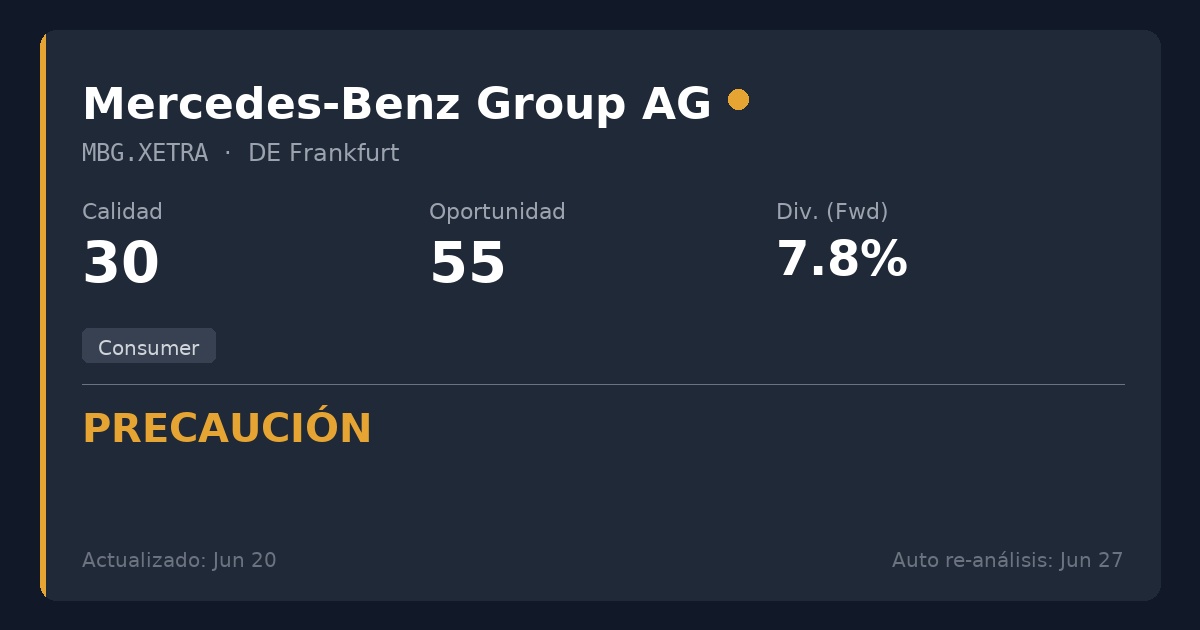
Meanwhile, the DAX is increasingly becoming a "pensioners' get-together" of companies, some of which are 100 to 150 years old and fill the index with their spin-offs. Thus $FRE (-0,06%) Fresenius is represented twice, $MBG (+0,01%) Mercedes is represented twice and $SIE (+0,13%) Siemens is even represented four times. These three companies alone fill eight places in the DAX, while success stories from the rise of a company from an SME to a group like Qiagen are almost non-existent. And in the case of Qiagen, too, we will first have to see whether the company can hold its own in the "Bundesliga" in the long term.
To be honest, the fact that the DAX is still doing relatively well is only due to the success of a few companies and their size advantage, which allows them to lobby at both federal and European level. However, the weaker Germany becomes, the less it will be possible in the long term for finance ministers to use their room for maneuver to the benefit of corporations or for foreign ministers to lobby for international trade agreements.
Unfortunately, things don't look very good in the rest of Europe either. However, the level of economic decline here is not that high anyway. Many European countries have never defined themselves as "economic nations" anyway, but see themselves as cultural nations. But here, too, you can take a look at what has become of the pearls of the European stock markets. The top 10 in Europe are now full of British and Swiss companies, while the heavyweights from Germany and France are losing more and more ground. Yes, Siemens is holding its own, but the German flagship industry used to be car manufacturing. And the only 5-star company in the EU is ASML.
I've now written much more than I wanted to for a fun post and don't even know what point I wanted to make.
I don't know, don't buy so many dubious individual stocks from dubious countries just because you want to diversify. Only buy the best stocks and if you can't think of anything else, put the rest in the S&P 500.