Guten Morgen, liebe getquin Community.
In den letzten Wochen habe ich mich intensiv mit der Batterie- und Energiespeicherindustrie beschäftigt, mit ihrer kompletten Wertschöpfungskette, den Schaufelherstellern und den Hidden Champions dahinter. Heute möchte ich dieses Wissen mit euch teilen @Tenbagger2024 und zeigen, wie sich aus einzelnen Technologien ein zusammenhängendes Energiesystem entwickelt. Ich freue mich, eure Perspektiven dazu zu hören.
Warren Buffett hat nicht ohne Grund über $BRK.B (-0,39%) Berkshire Hathaway die Chemiesparte von Occidental Petroleum übernommen. Er erkennt früh, wo echte Wertschöpfung entsteht und welche Rolle chemische Prozesse bei der Entwicklung moderner Energie- und Speichersysteme spielen. Genau dort entscheidet sich, wie effizient Batterien und Brennstoffzellen künftig produziert, betrieben und recycelt werden und wer an dieser Transformation langfristig verdient.
Ich selbst bin in diesem Bereich noch nicht so breit aufgestellt, wie ich es gerne wäre. In einige Segmente bin ich bereits investiert, aber die gesamte Wertschöpfungskette bietet noch enormes Potenzial und genau das wollte ich mit dieser Analyse unter anderen auch besser verstehen.
Ich habe bewusst auf persönliche Favoriten verzichtet, @Multibagger um die Analyse neutral zu halten. Wenn euch bestimmte Unternehmen, Themen oder Fragen besonders interessieren, schreibt sie gerne hier in die Kommentare. Ich bin offen für Feedback, Ergänzungen und Diskussionen, und falls in einem Bereich wichtige Player fehlen, ergänze ich sie gerne nachträglich. Der Beitrag ist etwas umfangreicher geworden, weil ich das Thema vollständig und nachvollziehbar darstellen wollte. Wer sich vor allem für die Unternehmen, die Wertschöpfungskette und die Schaufelhersteller interessiert, kann direkt zu Punkt 13 bis 16 springen.
Vielleicht folgt als Teil 2 die Brennstoffzelle, falls das von euch gewünscht ist? Wünsche allen viel Erfolg beim Investieren und natürlich einen schönen Sonntag.
Struktur des Beitrags
1.Begrüßung und Hook
2.Thema und Ziel: Wertschöpfungskonzept 3.Batterieindustrie als Modell
4.Grundprinzip der Batterie
5.Anwendungen
6.Zyklus der Batterie
7.Zukunftstrends
8.Rohstoffbasis und Entwicklung
9.Wertschöpfungskette Stufen 1–9
10.Wertschöpfungsvektoren in der Batteriebranche
Wertschöpfung als Kreislauf und Gesamtmodell
11.Makroebene und Mikroebene und wie beides zusammengehört
12.Bedeutung von Batterieindustrie 4.0
13.Wertschöpfungskette mit Unternehmenszuordnung zu 1–8
14.Schaufelhersteller je Stufe plus übergeordnete Finanziers und strategische Verteiler
15.Verknüpfungspunkte: Hybrid-Energiesysteme für Rechenzentren, Industrie, Transport
16.Energie für humanoide Roboter, die nächste Evolutionsstufe der Anwendung
17.Takeaway mit versteckter Frage im Fließtext
18.Quellen
2️⃣.Thema und Ziel des Beitrags
Die Batterieindustrie ist längst mehr als nur Zellfertigung oder E-Mobilität. Sie steht im Zentrum eines globalen Strukturwandels, der Energie, Technologie und Kapital neu verteilt. Ziel dieses Beitrags ist es, die Batterie als komplettes Wertschöpfungssystem zu verstehen, von der Rohstoffgewinnung über Materialtechnologien, Produktion und Anwendung bis hin zu Recycling und Rückführung.
Ich zeige, wie entlang dieser Kette echte Wertschöpfung entsteht, welche Branchen davon direkt profitieren und warum die Batterieindustrie zu einem zentralen Bindeglied zukünftiger Energiesysteme wird. Gleichzeitig geht es darum, das Ganze als strategisches Modell zu sehen, als Verbindung von Technologie, Ökonomie und Nachhaltigkeit, die weit über den Mobilitätssektor hinausreicht.
3️⃣.Grundprinzip der Batterie
Im Kern ist eine Batterie ein chemischer Energiespeicher, der elektrische Energie in Form chemischer Verbindungen speichert und bei Bedarf wieder abgibt. Sie besteht aus drei Hauptkomponenten: einer Anode, einer Kathode und einem Elektrolyten. Zwischen diesen Polen wandern positiv geladene Ionen während des Ladens und Entladens hin und her. Dabei entsteht elektrischer Strom, der genutzt werden kann, um Fahrzeuge anzutreiben, Maschinen zu versorgen oder Energie in Netzen zu stabilisieren.
Das Grundprinzip ist reversibel. Das bedeutet, Energie kann nicht nur entnommen, sondern auch wieder eingespeist werden. Diese einfache, aber hochwirksame Reaktion macht Batterien zu einem der zentralen Bausteine moderner Energiesysteme. Durch Fortschritte in Chemie, Materialtechnologie und Fertigung steigt die Leistungsfähigkeit stetig, während Gewicht, Ladezeit und Kosten kontinuierlich sinken.
4️⃣.Anwendungen
Batterien sind heute weit mehr als nur die Energiequelle für Elektroautos. Sie sind das Rückgrat moderner Energiesysteme und ein Schlüssel zur Stabilisierung erneuerbarer Stromnetze. Ihr Einsatz reicht von der Elektromobilität über stationäre Energiespeicher bis hin zu industriellen und digitalen Anwendungen.
In der Mobilität ermöglichen Batterien den Übergang vom Verbrenner zur elektrischen Antriebstechnologie und bilden das Fundament der neuen Fahrzeugplattformen. In der Energiebranche dienen sie als Pufferspeicher für Solar- und Windstrom, gleichen Netzschwankungen aus und sichern die Versorgung in Spitzenzeiten. In der Industrie sorgen sie für Versorgungssicherheit, Effizienz und Notstromlösungen, während sie in Rechenzentren zunehmend als emissionsfreie Backup-Systeme eingesetzt werden.
Darüber hinaus entstehen neue Einsatzfelder im Luft- und Schiffsverkehr, in Haushalts- und Gebäudesystemen und in Microgrids, die abgelegene Regionen oder Industrieparks unabhängig vom zentralen Netz mit Energie versorgen. Batterien sind damit ein universeller Energieträger, der Sektoren miteinander verbindet und die Grundlage für flexible, dezentrale Energiearchitekturen schafft.
5️⃣.Zyklus der Batterie
Eine Batterie durchläuft einen klar definierten Lebenszyklus, der weit über ihre reine Nutzung hinausgeht. Er beginnt mit der Gewinnung und Verarbeitung der Rohstoffe, führt über die Zell- und Systemfertigung zur aktiven Einsatzphase und endet mit Rückgewinnung und Wiederverwertung der Materialien.
In der Produktionsphase werden aus Rohstoffen wie Lithium, Nickel, Mangan, Kobalt, Graphit und Kupfer die aktiven Materialien und Zellen hergestellt. Diese Zellen werden anschließend zu Modulen und kompletten Batteriepaketen zusammengefügt. In der Nutzungsphase liefern die Batterien über Jahre hinweg Energie in Fahrzeugen, Speichern oder industriellen Anlagen.
Nach Ende der Lebensdauer beginnt der zweite Zyklus. Zellen, die noch leistungsfähig genug sind, werden in sogenannten Second-Life-Anwendungen weiterverwendet, etwa in stationären Energiespeichern. Schließlich folgt der Recyclingprozess, bei dem wertvolle Rohstoffe wie Lithium, Nickel und Kobalt zurückgewonnen und wieder in den Produktionskreislauf eingespeist werden.
Dieser geschlossene Materialkreislauf ist der entscheidende Schritt hin zu einer nachhaltigen Batterieökonomie. Er reduziert die Abhängigkeit von Primärrohstoffen, senkt die Umweltbelastung und macht die gesamte Wertschöpfungskette langfristig widerstandsfähiger.
6️⃣.Zukunftstrends
Die Batterieindustrie steht vor einer Phase massiver technologischer und struktureller Veränderungen. Der Fortschritt verschiebt sich von reiner Kapazitätserhöhung hin zu Effizienz, Nachhaltigkeit und Materialunabhängigkeit.
Ein zentraler Trend ist die Entwicklung hin zu Feststoffbatterien, die durch feste Elektrolyte sicherer, kompakter und leistungsfähiger sind als heutige Lithium-Ionen-Systeme. Parallel dazu gewinnen Silizium-Anoden an Bedeutung, die höhere Energiedichten ermöglichen und Ladezeiten verkürzen. Natrium-Ionen-Batterien eröffnen neue Möglichkeiten für kostengünstige Speicherlösungen, insbesondere dort, wo Gewicht und Energiedichte weniger entscheidend sind.
Auch die Digitalisierung der Batterie schreitet voran. Intelligente Batteriemanagementsysteme analysieren in Echtzeit den Zustand, die Temperatur und den Ladezustand jeder Zelle. Damit wird nicht nur die Sicherheit verbessert, sondern auch die Lebensdauer verlängert und der Betrieb optimiert.
Auf der wirtschaftlichen Ebene entwickelt sich die Branche in Richtung vertikaler Integration: Hersteller sichern sich Rohstoffe, Energieversorger bauen eigene Speicherfabriken auf und Technologiekonzerne investieren direkt in Fertigungskapazitäten. Gleichzeitig wächst der politische Druck auf Kreislaufwirtschaft, Recycling und CO₂-Neutralität.
Die Zukunft der Batterie liegt damit in der Kombination aus neuen Materialien, smarter Steuerung und geschlossenen Kreisläufen. Wer diese drei Ebenen miteinander verbindet, wird in den nächsten Jahren die Dynamik des Energiemarkts entscheidend prägen.
7️⃣.Rohstoffbasis und Entwicklung
Die Batterieindustrie beginnt an der Quelle der Rohstoffe. Lithium, Nickel, Mangan, Kobalt, Kupfer und Graphit bilden aktuell die Basis fast aller Hochleistungszellen. Diese Metalle bestimmen die Energiedichte, Stabilität und Lebensdauer jeder Batterie. Gleichzeitig sind sie der sensibelste Teil der Wertschöpfung, da ihre Förderung, Verarbeitung und Versorgung über Kosten, Nachhaltigkeit und geopolitische Abhängigkeiten entscheiden.
In den letzten Jahren hat sich ein deutlicher Wandel vollzogen. Unternehmen und Staaten investieren in neue Abbaugebiete, Recyclinganlagen und Materialalternativen, um Versorgungssicherheit zu schaffen. Besonders Lithium und Nickel bleiben Schlüsselmaterialien, während Kobalt zunehmend ersetzt wird. Graphit erlebt eine Transformation hin zu synthetischen und recycelten Formen, die unabhängiger von China machen sollen.
Die Entwicklung geht klar in Richtung Materialeffizienz und Kreislaufwirtschaft. Anstatt immer neue Minen zu erschließen, entstehen geschlossene Kreisläufe, in denen Rohstoffe mehrfach verwendet werden. Gleichzeitig rücken alternative Zellchemien in den Vordergrund, die auf reichlich verfügbare Elemente wie Natrium, Eisen oder Silizium setzen.
Diese Verschiebung reduziert Kosten, senkt ökologische Belastungen und erhöht die Unabhängigkeit ganzer Volkswirtschaften. Die Rohstoffbasis der Batterieindustrie wandelt sich damit von einer linearen Lieferkette zu einem globalen, zirkulären Materialnetzwerk, das Technologie, Recycling und Nachhaltigkeit vereint.
8️⃣.Wertschöpfungskette
Die Batterieindustrie folgt einer klaren industriellen Logik, die sich von der Gewinnung der Rohstoffe bis zur Rückführung der Materialien erstreckt. Jede Stufe in dieser Kette schafft eigenen Wert und ist zugleich Voraussetzung für die nächste.
1. Rohstoffgewinnung – Abbau und Förderung von Lithium, Nickel, Mangan, Kobalt, Kupfer und Graphit in Minen und Salzseen. Diese Stufe bestimmt die Kostenstruktur und die ökologische Bilanz der gesamten Batterie.
2. Raffinierung und Aufbereitung – Verarbeitung der Rohstoffe zu Batteriechemikalien, wie Lithiumhydroxid oder Nickelsulfat, die in der Zellproduktion eingesetzt werden.
3. Materialtechnologie und Komponentenfertigung – Herstellung von Kathoden-, Anoden- und Elektrolytmaterialien sowie Separatoren, leitfähigen Folien und Bindern.
4. Zellproduktion – Zusammenführung der Materialien zu elektrochemischen Zellen durch Beschichtung, Stapelung und Versiegelung. Dieser Schritt definiert Kapazität, Sicherheit und Qualität.
5. Modul- und Packfertigung – Zellen werden zu Modulen und kompletten Batteriepaketen verbunden, inklusive Batteriemanagementsystem und Kühlung.
6. Systemintegration – Einbau der Batteriepacks in Fahrzeuge, Energiespeicher oder industrielle Anlagen. Hier treffen Batterie, Software und Leistungselektronik aufeinander.
7. Nutzung und Betrieb – Einsatzphase der Batterie über mehrere Jahre hinweg. Digitale Überwachung und Predictive Maintenance verlängern die Lebensdauer und Effizienz.
8. Rückgewinnung und Recycling – Am Ende des Lebenszyklus werden Materialien wie Lithium, Nickel, Kobalt und Graphit wiederaufbereitet und in den Produktionskreislauf zurückgeführt.
Diese acht Stufen bilden zusammen den vollständigen industriellen Kreislauf der Batterieindustrie. Wert entsteht an jeder Stelle, aber am größten ist er dort, wo Technologie, Energieeffizienz und Wiederverwertung ineinandergreifen. Das ist der Punkt, an dem aus einer Lieferkette ein echtes Wertschöpfungssystem wird.
9️⃣.Wertschöpfungsvektoren in der Batteriebranche
Die Batterieindustrie wird nicht nur durch Produktionsprozesse bestimmt, sondern durch mehrere übergeordnete Kräfte, die sich wie Vektoren quer durch alle Stufen der Wertschöpfung ziehen. Diese Vektoren entscheiden, welche Unternehmen sich an der Spitze halten und wo sich langfristig Wert konzentriert.
1. Technologie-Vektor
Fortschritte in Zellchemie, Materialwissenschaft, Fertigung und Softwareintegration. Wer hier skaliert, senkt Kosten und steigert Energiedichte, Sicherheit und Lebensdauer.
2. Digitalisierungs-Vektor
Datenmanagement, Zustandsanalyse, Cloud-basierte Batterieüberwachung und Predictive Maintenance. Diese Ebene verbindet physische Systeme mit KI und macht Betrieb und Recycling planbarer.
3. Nachhaltigkeits-Vektor
Kreislaufwirtschaft, CO₂-neutrale Produktion, ESG-Standards und Rückführung von Materialien. Unternehmen, die hier führend sind, sichern langfristig Zulassungen und Kapital.
4. Finanz- und Investitions-Vektor
Kapitalströme aus staatlichen Förderungen, privaten Fonds und Infrastrukturprogrammen, die Fertigungskapazitäten und Forschung finanzieren.
5. Infrastruktur-Vektor
Aufbau von Gigafactories, Recyclingzentren, Ladeinfrastruktur und Energiespeicherparks. Diese Basis ist entscheidend für Skalierung und Versorgungssicherheit.
6. Geopolitischer Vektor
Standortentscheidungen, Handelsabkommen, Rohstoffabhängigkeiten und Sicherheitsinteressen prägen, wer Zugang zu strategischen Materialien und Märkten hat.
Diese Vektoren wirken gleichzeitig und verstärken sich gegenseitig. Die eigentliche Dynamik der Batteriebranche entsteht dort, wo Technologie, Nachhaltigkeit und Kapital intelligent miteinander verknüpft werden. Das ist die Achse, auf der Innovation, Rendite und Resilienz zusammenlaufen.
🔟.Wertschöpfung als Kreislauf
Die Batterieindustrie entwickelt sich zunehmend von einer linearen Lieferkette zu einem geschlossenen Kreislaufsystem. Energie, Materialien und Daten fließen dabei permanent zwischen Produktion, Nutzung und Wiederverwertung. Ziel ist es, Ressourcen zu erhalten, Verluste zu minimieren und Wert über den gesamten Lebenszyklus hinweg zu steigern.
Der Kreislauf beginnt mit der Rohstoffgewinnung und führt über Materialentwicklung, Zellfertigung und Integration bis hin zur Nutzung in Fahrzeugen, Speichersystemen und industriellen Anlagen. Nach der Einsatzphase folgt die Rückgewinnung der Materialien, die wieder in neue Batterien einfließen. Ergänzt wird dieser physische Kreislauf durch einen digitalen Datenkreislauf, in dem alle relevanten Informationen über Zustand, Leistung und Alter jeder Zelle gespeichert und analysiert werden.
So entsteht ein System, das sich selbst optimiert. Daten aus dem Betrieb fließen zurück in Forschung, Design und Recycling, wodurch neue Generationen von Batterien effizienter, sicherer und nachhaltiger werden. Diese Verbindung von physischem und digitalem Kreislauf ist der Schlüssel zu echter Wertschöpfung in der Batterieindustrie 4.0.
1️⃣1️⃣.Makroebene und Mikroebene
Die Batterieindustrie funktioniert auf zwei miteinander verknüpften Ebenen, die sich gegenseitig antreiben und stabilisieren. Auf der Makroebene entstehen globale Strukturen, politische Programme und wirtschaftliche Rahmenbedingungen. Auf der Mikroebene wirken die technologischen, chemischen und prozessbezogenen Entwicklungen, die diese großen Bewegungen erst möglich machen.
Die Makroebene umfasst alles, was die Branche als Ganzes bewegt: geopolitische Interessen, Energiepolitik, Förderprogramme, Handel, Infrastruktur und Kapitalströme. Hier werden die Weichen gestellt, wo Gigafactories entstehen, welche Länder Rohstoffzugang sichern und wie Staaten ihre Energieabhängigkeit verringern.
Die Mikroebene beschreibt die technische Realität: Zellchemie, Materialinnovation, Fertigungstechnologie, Softwareintegration und Recyclingverfahren. Auf dieser Ebene entsteht der eigentliche Fortschritt. Jede neue Batteriechemie, jede Verbesserung im Energiemanagement oder jede Reduktion seltener Metalle verändert das große System im Hintergrund.
Beide Ebenen greifen ineinander. Politische Entscheidungen und Kapitalflüsse auf der Makroebene ermöglichen technologische Entwicklungen auf der Mikroebene, während technologische Durchbrüche wiederum neue Märkte, Handelsstrukturen und Investitionszyklen auslösen. Genau an dieser Schnittstelle entsteht das strategische Potenzial der Batterieindustrie, dort, wo Technologie, Politik und Wirtschaft in einem geschlossenen System zusammenwirken.
1️⃣2️⃣.Bedeutung von Batterieindustrie 4.0
Die Batterieindustrie 4.0 steht für die vollständige Digitalisierung und Vernetzung aller Prozesse entlang der Wertschöpfungskette. Sie kombiniert Produktion, Energie, Daten und Nachhaltigkeit zu einem intelligenten Gesamtsystem, das in Echtzeit gesteuert, überwacht und optimiert wird.
Im Zentrum steht die Verbindung von physischen Anlagen mit digitalen Plattformen. Jede Zelle, jede Maschine und jeder Prozess liefert Daten, die über KI und Analytik ausgewertet werden. Damit entsteht ein selbstlernendes System, das Fehler früh erkennt, Qualität sichert und die Lebensdauer der Batterien verlängert.
In der Fertigung werden durch automatisierte Linien, Robotik und Machine Learning Effizienz und Präzision maximiert. Im Betrieb ermöglichen Cloud-Dienste und IoT-Sensorik eine ständige Zustandsüberwachung, die Wartung, Sicherheit und Leistung optimiert. Gleichzeitig werden ökologische Daten erfasst, um CO₂-Bilanzen transparent und nachweisbar zu machen.
Batterieindustrie 4.0 ist damit kein Schlagwort, sondern der Übergang zu einer vollständig integrierten, datengetriebenen Energieindustrie. Sie schafft die Basis für Skalierbarkeit, Wirtschaftlichkeit und Nachhaltigkeit und verbindet Forschung, Produktion, Nutzung und Recycling in einem geschlossenen digitalen Kreislauf.
Visuelles Gesamtmodell der Batterie-Wertschöpfung
Um die gesamte Struktur greifbarer zu machen, habe ich das System der Batterieindustrie in drei Ebenen unterteilt:
1.Makroebene: globale Wertschöpfung, Energiepolitik, Rohstoff- und Produktionsnetzwerke.
2.Mikroebene: technologische Prozesse, Materialkreisläufe und Innovationsachsen.
3.Gesamtmodell: die Verknüpfung beider Ebenen in einem geschlossenen Kreislaufsystem, das Produktion, Nutzung und Rückgewinnung verbindet.
Diese Grafik verdeutlicht, wie sich aus linearen Lieferketten ein zirkuläres, digital gesteuertes Energiesystem entwickelt, die eigentliche DNA der Batterieindustrie 4.0.
➡️Batterie-Wertschöpfung: Makro–Mikro–Gesamtmodell
[F&E] [Engineering] [Digitalisierung]
↓ ↓ ↓
Rohstoffe → Materialien → Zellen → Systeme → Nutzung → Recycling
↑ ↑ ↑
[Supply Chain] [Second Life] [Service]
1️⃣3️⃣.Wertschöpfungskette mit Unternehmenszuordnung + Hidden Champions
Entlang der Batterie-Wertschöpfungskette entsteht in jeder Stufe spezialisierter Mehrwert. Unternehmen besetzen dabei gezielt einzelne Segmente oder integrieren mehrere Bereiche, um ihre Position zu stärken. Die Kombination aus Materialbeherrschung, Technologiekompetenz und Systemintegration entscheidet, wer im globalen Wettbewerb die Nase vorn hat.
1. Rohstoffgewinnung
Lithium, Nickel, Kobalt, Graphit:
$ALB (+0,67%) Albemarle (NYSE: ALB) – USA Einer der weltweit größten Lithiumproduzenten mit Abbaustätten in Chile, Australien und den USA. Versorgt die globale Zellproduktion mit Lithiumhydroxid für Kathodenmaterialien
$SQM SQM (NYSE: SQM) – Chile - Spezialisiert auf Lithium- und Kaliprodukte aus den Salzseen der Atacama-Wüste. Zentrale Rolle in der südamerikanischen Batterierohstoffversorgung
$9696 (-4,05%) Tianqi Lithium (SHE: 002466 / HKG: 9696) – China - Tianqi Lithium ist einer der größten Lithiumproduzenten der Welt, mit Beteiligungen an großen Hartgesteins-Lithiumprojekten in Australien (Greenbushes Mine) und Veredelungskapazitäten in China. Das Unternehmen liefert Lithiumhydroxid und Lithiumcarbonat für Kathodenmaterialien in der Batterieindustrie. Fokus auf upstream Kontrolle und chemische Weiterverarbeitung
$GLEN (+0,25%) Glencore (LSE: GLEN) – Schweiz - Multirohstoffkonzern mit Fokus auf Nickel, Kobalt und Kupfer. Führend in Recycling und Zweitverwertung von Batterieabfällen
$SSW Sibanye Stillwater (JSE: SSW / NYSE: SBSW) – Südafrika / USA - Sibanye Stillwater ist ein Bergbaukonzern mit Schwerpunkt auf Platingruppenmetallen wie Platin und Palladium (wichtig für Brennstoffzellenkatalysatoren), aber auch Nickel und Kobalt aus Recycling und Bergbau. Strategisch besonders relevant, weil sie sowohl Primärförderung als auch Metallrückgewinnung betreiben. Damit stehen sie an der Schnittstelle zwischen Batterierohstoffen, Brennstoffzellenkatalysatoren und Recyclingströmen
$PLS (+1,34%) Pilbara Minerals (ASX: PLS) – Australien - Wichtiger Produzent von Spodumen-Konzentrat. Treibt den Ausbau lokaler Lithiumwertschöpfung in Westaustralien voran
$SYR (-0,77%) Syrah Resources (ASX: SYR) – Australien / Mosambik - Fördert Naturgraphit in Balama, Mosambik, und baut Anodenmaterialien in den USA auf. Strategisch relevant für die westliche Graphitversorgung
Kupfer und weitere Industriemetalle:
$FCX Freeport-McMoRan (NYSE: FCX) – USA - Einer der größten Kupferproduzenten weltweit. Versorgt die Batterie- und Elektronikindustrie mit Kupferkathoden aus Minen in Nord- und Südamerika
$BHP (+0,2%) BHP Group (NYSE: BHP) – Australien / UK - Globaler Bergbaukonzern mit Fokus auf Kupfer, Nickel und Eisen. Investiert stark in nachhaltige Förderung und Dekarbonisierung der Rohstoffproduktion
$RIO (-0,41%) Rio Tinto (NYSE: RIO) – Vereinigtes Königreich / Australien - Multinationaler Rohstoffriese mit wachsendem Engagement im Lithiumsektor. Führend bei nachhaltiger Kupferförderung und Materialveredelung
Hidden Champions
$SLI (-2,69%) Standard Lithium (NYSE: SLI / TSX-V: SLI) – Kanada / USA - Standard Lithium entwickelt direkte Lithiumextraktion aus Sole (Direct Lithium Extraction, DLE) in den USA. Ziel ist Lithiumgewinnung ohne klassischen Hartgesteinsabbau oder riesige Verdunstungsbecken. Damit positioniert sich das Unternehmen als Technologie-getriebener Lithium-Entwickler für nordamerikanische Versorgungssicherheit. Das ist klar zweite Reihe mit großem Hebel
$VUL (+8,75%) Vulcan Energy Resources (ASX: VUL) – Australien / Deutschland - Vulcan Energy arbeitet an geothermie-gekoppelter Lithiumgewinnung im Oberrheingraben in Deutschland. Ansatz: CO₂-arme Lithiumproduktion aus Thermalsole plus regionale Versorgung für die europäische Zellindustrie. Das ist geopolitisch extrem wichtig, weil es Lithium aus Europa für Europa ermöglicht, ohne klassische Minenstruktur
$LKE (+0%) Resources (ASX: LKE) – Australien - Entwickelt Lithium-Projekte mit nachhaltiger Direktextraktionstechnologie (DLE). Ziel ist es, Lithium mit minimalem Wasserverbrauch und CO₂-Ausstoß zu gewinnen
$SGML (+14,87%) Sigma Lithium (NASDAQ: SGML) – Kanada/Brasilien - Produziert hochreines Lithiumkonzentrat in Brasilien mit Fokus auf ESG-konforme Förderung und lokale Wertschöpfung
$ABAT American Battery Technology Company (NASDAQ: ABAT) – USA - Kombiniert Rohstoffförderung und Recycling von Lithium und Nickel. Pionier bei geschlossenen Materialkreisläufen aus inländischen Quellen
2. Raffinierung und Aufbereitung
Diese Unternehmen veredeln Rohstoffe zu Batteriechemikalien und sichern damit den Übergang in die Materialtechnologie.
$UMICY Umicore (EBR: UMICY) – Belgien - Führend in der Raffination und Veredelung von Nickel, Kobalt und Lithium. Entwickelt Kathodenmaterialien und betreibt Recyclingzentren in Europa und Asien.
$BAS (-0,7%) BASF (ETR: BAS) – Deutschland - Globaler Chemiekonzern mit wachsendem Fokus auf Batteriematerialien, insbesondere Kathodenaktivstoffe und Nickel-Mangan-Chemien
$003670 POSCO Future M (KRX: 003670) – Südkorea - Spezialist für Kathoden- und Anodenmaterialien. Teil des POSCO-Konzerns, liefert an LG Energy Solution und Samsung SDI
$051910 LG Chem (KRX: 051910) – Südkorea - Entwickelt und produziert Batteriematerialien, Polymere und Elektrolyte. Enge Verzahnung mit LG Energy Solution entlang der gesamten Lieferkette
$010130 Korea Zinc (KRX: 010130) – Südkorea - Führender Anbieter in der Raffination seltener Metalle. Liefert Nickel- und Zinkprodukte für Batteriekathoden
Hidden Champions
Ecopro (KRX: 086520) – Südkorea - Hersteller von hochreinen Kathodenmaterialien und Vorprodukten für Nickel- und Kobaltchemien. Schlüsselzulieferer für LG Energy Solution und SK On
Sila Nanotechnologies (privat, USA) - Entwickelt Silizium-Anodenmaterialien zur Steigerung von Energiedichte und Ladegeschwindigkeit. Beliefert Automobilhersteller mit fortschrittlichen Batteriematerialien
Green Lithium – Vereinigtes Königreich (privat) - Errichtet die erste große Lithiumraffinerie Europas. Fokus auf ESG-konforme, energieeffiziente Raffinierung für den europäischen Markt
Mangrove Lithium – Kanada (privat) - Entwickelt modulare Raffinerieanlagen auf Basis elektrochemischer Verfahren zur Umwandlung von Lithiumkonzentrat in batteriefähiges Lithiumhydroxid
$ICL ICL Group (NYSE: ICL) – Israel - Fertigt Spezialchemikalien und Elektrolyte für Batterien und Energiespeicher. Verbindet chemisches Know-how mit nachhaltiger Prozessoptimierung
3. Materialtechnologie und Komponentenfertigung
Sie liefern Kathoden- und Anodenmaterialien, Elektrolyte, Separatoren und Beschichtungssysteme.
$3407 (+0,24%) Asahi Kasei (TYO: 3407) – Japan - Hersteller von Separatorfolien und Elektrolyten. Weltweit führend in thermischer Stabilität und Sicherheit
$3402 (-0,54%) Industries (TYO: 3402) – Japan - Entwickelt Hochleistungs-Polymere und Karbonmaterialien für Elektroden, Separatoren und Gehäuse
$SOLB (+0,26%) Solvay (EBR: SOLB) – Belgien - Chemiekonzern mit Fokus auf Bindemittel, Elektrolytsalze und Beschichtungen für Kathoden- und Anodenfertigung
$MMM 3M (NYSE: MMM) – USA - Lieferant von Additiven, Schutzbeschichtungen und leitfähigen Materialien. Starker Partner in Zell- und Modulfertigung
$018880 Hanon Systems (KRX: 018880) – Südkorea -Spezialisiert auf Thermomanagementlösungen für Batteriepacks und elektrische Antriebe
$PPG PPG Industries (NYSE: PPG) – USA - Einer der weltweit führenden Hersteller von Spezialbeschichtungen und Funktionsmaterialien. Entwickelt leitfähige und schützende Beschichtungen für Batteriezellen, Gehäuse und Verbindungskomponenten. Unterstützt Zellhersteller mit Lösungen zur Verbesserung von Wärmeableitung, Sicherheit und Lebensdauer
Hidden Champions
Nexeon – Vereinigtes Königreich (privat) - Entwickelt Silizium-Anodenmaterialien zur Steigerung der Energiedichte in Lithium-Ionen-Zellen. Fokus auf Leichtbau und Schnellladefähigkeit
Group14 Technologies – USA (privat) - Pionier für Silizium-Kohlenstoff-Komposite. Arbeitet mit Automobilherstellern und Zellproduzenten an der nächsten Generation von Hochenergieanoden
$TLG (+1,11%) Talga Group (ASX: TLG) – Australien/Schweden - Integriert Graphitabbau und Anodenproduktion. Ziel ist die nachhaltige Herstellung von Kohlenstoffmaterialien für europäische Zellfertigung
4. Zellproduktion
Die technologische Mitte der Wertschöpfung. Hier werden Kapazität, Energiedichte und Kostenstrukturen festgelegt.
$3750 (-1,89%) CATL (SHE: 3750) – China - Weltweit größter Batteriehersteller mit Marktanteil über 30 Prozent. Führend in LFP- und NMC-Technologien, Partner zahlreicher OEMs
$373220 LG Energy Solution (KRX: 373220) – Südkorea - Globaler Zellproduzent mit Werken in Asien, Europa und den USA. Schwerpunkt auf Hochleistungszellen für E-Mobilität und Energiespeicher
$SMSN Samsung SDI (KRX: 006400) – Südkorea - Fokussiert auf Premiumzellen mit hoher Energiedichte. Enger Zulieferer für BMW, Rivian und andere Premiumhersteller
$6752 (+4,12%) Panasonic Holdings (TYO: 6752) – Japan - Langjähriger Partner von Tesla. Baut neue Produktionsstandorte in den USA und Japan auf
Northvolt – Schweden (privat) - Europäischer Pionier im nachhaltigen Batteriebau. Fokus auf Kreislaufwirtschaft, grüne Energie und geschlossene Lieferketten
Hidden Champions
$QS QuantumScape (NYSE: QS) – USA - Entwickelt Feststoffbatterien mit keramischen Elektrolyten für höhere Energiedichte und Sicherheit. Partnerschaft mit Volkswagen
$SLDP Solid Power (NASDAQ: SLDP) – USA - Spezialisiert auf Feststoffelektrolyte und Hochleistungszellen für Automobilanwendungen. Kooperationen mit BMW und Ford
24M Technologies (privat, USA) - Entwickelt semi-solide Lithium-Ionen-Zellen mit vereinfachter Produktion. Reduziert Kosten und Materialverbrauch deutlich
$AMPX Amprius Technologies (NYSE: AMPX) – USA - Spezialisiert auf Silizium-Nanodraht-Anoden mit extrem hoher Energiedichte. Anwendungen in Luftfahrt, Drohnen und Robotik
$ENVX (+3,52%) Enovix (NASDAQ: ENVX) – USA - Entwickelt 3D-Siliziumzellen mit neuartiger Architektur. Fokus auf Sicherheit, Schnellladung und kompakte Formate
ProLogium – Taiwan (privat) - Technologieführer bei Feststoffzellen. Baut erste Großserienfabrik in Europa mit Partnern aus der Automobilindustrie
5. Modul- und Packfertigung
In dieser Phase werden aus einzelnen Zellen vollständige Batteriemodule und -packs gefertigt. Hier treffen Maschinenbau, Robotik und Präzisionstechnologie auf Energiechemie und Qualitätssicherung. Unternehmen wie KUKA (ETR: KU2), $ABBN (-0,8%) ABB Robotics (VTX: ABBN), Comau (privat, Italien), Teamtechnik (privat, Deutschland) und $LECN (+0%) Leclanché (SWX: LECN) liefern automatisierte Systeme zur Montage, Verschweißung, Prüfung und Kühlung von Batteriemodulen. Zellhersteller wie $300014 EVE Energy (SHE: 300014) oder $3750 (-1,89%) CATL (SHE: 3750) fertigen parallel ganze Batteriesysteme für Fahrzeug- und Industriesektoren.
Hidden Champions wie $VAR1 Varta (ETR: VAR1), $MVST (-0,43%) Microvast (NASDAQ: MVST) und $FORSE (+0,11%) Forsee Power (EPA: FORSE) entwickeln modulare Hochleistungsbatterien für Nutzfahrzeuge, Bahn, Schifffahrt und stationäre Speicherlösungen.
Diese Unternehmen verbinden innovative Zellchemie mit Thermomanagement, Schnellladefähigkeit und Langlebigkeit.
Gleichzeitig integrieren Automobilhersteller wie $TSLA (+2,38%) Tesla (NASDAQ: TSLA), $1211 (-0,86%) BYD (HKG: 1211), $VOW3 (+0,09%) (ETR: VOW3), $BMW (-0,84%) BMW (ETR: BMW), $MBG (-0,76%) Mercedes-Benz Group (ETR: MBG), $XPEV (NYSE: XPEV), $NIO NIO (NYSE: NIO) und $RIVN Rivian (NASDAQ: RIVN) ihre Zellproduktion zunehmend in die eigene Wertschöpfung, um Effizienz, Energiedichte und Kühlung eigenständig zu steuern.
Kurz gesagt: In dieser Stufe entstehen marktreife Batteriesysteme, diese sind präzise zusammengesetzt, thermisch stabilisiert und digital überwachbar. Sie bilden das Herz moderner E-Mobilitäts- und Energiespeicherlösungen und sind die Brücke zwischen Materialwissenschaft und Anwendung.
6. Systemintegration
Hier werden die gefertigten Batteriemodule zu intelligenten Gesamtsystemen verbunden, in Fahrzeugen, Rechenzentren, Netzwerken oder industriellen Anlagen.
Diese Stufe verknüpft Hardware, Software und Steuerung zu einer funktionalen Energielandschaft.
Unternehmen wie $SIE (-0,48%) Siemens (ETR: SIE), Hitachi Energy (privat, Schweiz/Japan), $ETN (-0,14%) Eaton (NYSE: ETN), $VRT (-1,84%) Vertiv (NYSE: VRT), $WRT1V (+1,34%) Wärtsilä (HEL: WRT1V), $SU (-1,55%) Schneider Electric (EPA: SU) und $ABBN (-0,8%) ABB (VTX: ABBN) entwickeln ganzheitliche Systeme für Energieflusssteuerung, Netzstabilisierung und digitale Integration.
Hidden Champions wie $PCELL (-2,96%) PowerCell Sweden (STO: PCELL), Volterion (privat, Deutschland), $ADSE (+10,2%) ADS-TEC Energy (NASDAQ: ADSE), AutoGrid Systems (privat, USA), $EGT (+1,14%) Eguana Technologies (TSXV: EGT), $EOSE Eos Energy Enterprises (NASDAQ: EOSE) und Nuvation Energy (privat, USA) verbinden Batteriespeicher mit Steuerungselektronik, Wechselrichtern und KI-basierter Managementsoftware. Sie schaffen modulare Energiesysteme, die flexibel skalierbar und netzdienlich eingesetzt werden können.
Kurz gesagt: In dieser Phase entstehen die Schnittstellen zwischen Technologie und Markt. Systeme die Strom nicht nur speichern, sondern intelligent steuern, verteilen und optimieren.
7. Nutzung und Anwendung
Die Batterieindustrie entfaltet hier ihren wirtschaftlichen Kern. In dieser Phase wird Energie nicht nur gespeichert, sondern strategisch eingesetzt in Mobilität, Rechenzentren, Netzen, Industrie und Privathaushalten.
E-Mobilität
Batterien sind das Fundament elektrischer Antriebe. Neben $TSLA (+2,38%) Tesla (NASDAQ: TSLA), $1211 (-0,86%) BYD (HKG: 1211), $VOW3 (+0,09%) Volkswagen (ETR: VOW3), $BMW (-0,84%) BMW (ETR: BMW), $MBG (-0,76%) Mercedes-Benz (ETR: MBG) und $NIO NIO (NYSE: NIO) gehören auch $STLAM (-0,5%) Stellantis (NYSE: STLA), $LCID Lucid Motors (NASDAQ: LCID) und $RIVN Rivian (NASDAQ: RIVN) zu den zentralen Akteuren. Sie entwickeln eigene Zellchemien, Software und Ladeinfrastruktur.
Hidden Champions wie $VAR1 Varta (ETR: VAR1) und $LECN (+0%) Leclanché (SWX: LECN) liefern modulare Systeme und Hochleistungszellen für spezialisierte Anwendungen.
Rechenzentren und Cloud-Infrastruktur
Der weltweite Ausbau von KI-, Cloud- und Speicherarchitekturen treibt den Energieverbrauch massiv. Unternehmen wie $GOOGL (-1,49%) Google (NASDAQ: GOOGL), $MSFT (-2,2%) (NASDAQ: MSFT), $AMZN (-3,94%) Amazon Web Services (NASDAQ: AMZN) und $ORCL (-0,12%) Oracle (NYSE:ORCL) entwickeln eigene Energiestrategien und Softwarelösungen, um ihre globalen Rechenzentren effizienter und CO₂-ärmer zu betreiben. Infrastrukturpartner wie $EQIX Equinix (NASDAQ: EQIX) und $DLR (-0,3%) Digital Realty (NYSE: DLR) setzen auf Batterie- und Hybridlösungen zur Netzstabilität. Technologieanbieter wie $VRT (-1,84%) Vertiv (NYSE: VRT), $SU (-1,55%) Schneider Electric (EPA: SU) und $WRT1V (+1,34%) Wärtsilä (HEL: WRT1V) liefern Energiemanagement, Kühlung und Hybridnetze.
Hidden Champions wie AutoGrid Systems – KI-Steuerung virtueller Kraftwerke, $ADSE (+10,2%) ADS-TEC Energy (NASDAQ: ADSE) – modulare Hochleistungsspeicher für Serverparks.
Energieversorger und Netzbetreiber (NRPG)
Hier entsteht der Übergang zwischen Erzeugung und Speicherung. Versorger wie $FLNC Fluence Energy (NASDAQ: FLNC), $NEE NextEra Energy (NYSE: NEE), $ENEL (-0,01%) Enel (BIT: ENEL), $TTE (+1,01%) TotalEnergies (EPA: TTE), $RWE (-0,72%) RWE (ETR: RWE) und $ORSTED (+0,48%) Ørsted (CPH: ORSTED) investieren massiv in Batteriespeicher, um Netze zu stabilisieren und Lasten zu steuern. Ergänzt werden sie durch spezialisierte Entwickler wie $AMRC (+1,07%) Ameresco (NYSE: AMRC) und $AES (-0,58%) AES Corporation (NYSE: AES), die hybride Speicher- und Kraftwerksprojekte realisieren.
Hidden Champions wie $STEM Stem Inc. (NYSE: STEM) und GridBeyond (privat, Irland) vernetzen diese Systeme softwareseitig und ermöglichen Echtzeit-Energiehandel.
Industrie- und Hausspeicher
Dezentrale Energiesysteme verbinden Industrie, Gewerbe und Privathaushalte zunehmend mit Speicherlösungen. Sonnen (privat, Deutschland) – eine Tochter von $SHEL (-0,28%) Shell (LON: SHEL) ist führend bei Heimspeichern und Energiegemeinschaften. E3/DC (privat, Deutschland) und $EGT (+1,14%) Eguana Technologies (TSXV: EGT) liefern modulare Systeme für Eigenstromnutzung und Netzunabhängigkeit. Softwareanbieter wie TWAICE (privat, Deutschland) überwachen Speicherzustand, Effizienz und Lebensdauer über digitale Zwillinge.
Zusammenfassung der Nutzungsebene
Diese Phase verbindet Technologie, Infrastruktur und digitales Management. Ob E-Fahrzeug, Cloud-Rechenzentrum, Industrieanlage oder privater Haushalt, Batterien sind das Bindeglied zwischen Energieerzeugung, Verbrauch und Intelligenz. Hier entscheidet sich, welche Technologien langfristig die Energieverteilung, Effizienz und Autonomie definieren werden.
9.Qualität & Sicherheit / Materialtechnologie
$KEYS Keysight Technologies (NYSE: KEYS) – USA - Führend in Messtechnik, Signalverarbeitung und Testsystemen für Batterie- und Halbleiteranwendungen
National Instruments (NASDAQ: NATI) – USA - Entwickelt modulare Test- und Prüfsysteme, heute Teil von Emerson Electric
$FORM FormFactor (NASDAQ: FORM) – USA - Spezialist für Wafer-Probing und Präzisionsmessungen in der Zell- und Halbleiterfertigung
$KULR KULR Technology Group (NYSE: KULR) – USA - Spezialist für Thermomanagement- und Sicherheitssysteme in Lithium-Ionen-Batterien. Die Technologie stammt aus der Raumfahrt (NASA) und wird heute in Energiespeichern, Elektrofahrzeugen und Recyclingprozessen eingesetzt.
9. Rückgewinnung und Recycling
Diese Unternehmen schließen den Kreislauf und sichern die Wiederverwertung strategischer Rohstoffe.
$LICY Li-Cycle (NYSE: LICY) – Kanada - Betreibt Recyclinganlagen für Lithium-Ionen-Batterien. Rückgewinnung von Nickel, Kobalt und Lithium mit hydrometallurgischer Technologie
Redwood Materials – USA (privat) - Gegründet von Teslas Ex-Technikchef JB Straubel. Führend im Aufbau geschlossener Materialkreisläufe in den USA
Primobius – Deutschland (Joint Venture Neometals/SMS Group) - Entwickelt modulare Recyclinganlagen für Batterieproduktion in Europa. Fokus auf industrielle Skalierbarkeit
$UMI (-2,23%) Umicore (EBR: UMI) – Belgien - Verbindet Materialproduktion und Recycling. Führend im Rücklaufmanagement wertvoller Metalle wie Platin, Nickel und Kobalt
Stena Recycling (privat, Schweden) - Einer der führenden europäischen Akteure im Bereich Recycling und Kreislaufwirtschaft. Verarbeitet Industrieabfälle, Elektronik und Batterien und gewinnt wertvolle Metalle und Materialien für die Wiederverwendung zurück
Heraeus (privat, Deutschland) - Technologiekonzern mit Schwerpunkt auf Edelmetallrecycling und Materialtechnologien. Gewinnt Platin, Gold, Silber und seltene Metalle aus Industrie- und Batterieabfällen zurück und stellt daraus neue Funktionsmaterialien her
Hidden Champions
Tozero – Deutschland (privat) - Innovatives Start-up für hydrometallurgisches Batterierecycling. Ziel ist die vollständige Rückgewinnung von Lithium, Nickel und Graphit
$AMY (+3,86%) RecycLiCo (TSXV: AMY) – Kanada - Entwickelt chemische Verfahren zur effizienten Rückgewinnung von Batteriematerialien mit hoher Reinheit
ACE Green Recycling – Singapur (privat) - Arbeitet an CO₂-neutralen Recyclingprozessen für Bleibatterien und Lithiumsysteme. Fokus auf Energieeffizienz und Skalierbarkeit
Entlang dieser Kette entsteht ein globales Netz aus Spezialisten, Produzenten und Integratoren. Die größten Wachstumschancen liegen an den Schnittstellen, dort wo chemische Kompetenz, Digitalisierung und Kreislaufwirtschaft aufeinandertreffen.
1️⃣4️⃣.Schaufelhersteller je Stufe plus übergeordnete Finanziers und strategische Verteiler
⚒️ 1. Rohstoffgewinnung – „Schaufeln“ = Exploration, Maschinen, Anlagenbau
Wer profitiert: Maschinenbauer, Chemie- & Anlagenzulieferer, Rohstoff-Finanzierer
$CAT (-1%) Caterpillar (NYSE: CAT) – USA - Bergbaugeräte, Transportfahrzeuge für Lithium- und Nickelminen
$6301 (-2,52%) Komatsu (TYO: 6301) – Japan - schwere Bergbaumaschinen, besonders in Südamerika und Australien
$SAND (-0,42%) Sandvik (STO: SAND) – Schweden - Bohr- und Gesteinsausrüstung (Lithiumminen)
$FLS (-0,92%) FLSmidth (CPH: FLS) – Aufbereitungsanlagen für Nickel und Kobalt
$EPI A (-1,81%) Epiroc (STO: EPI-A) – Schweden - Spezialisiert auf Untertagebohrungen, Sprengtechnik und automatisierte Bergbaulösungen
$WEIR (-1,16%) Weir Group (LSE: WEIR) – Vereinigtes Königreich - Liefert Schleif- und Pumpentechnik für Erzaufbereitung und Materialtransport in Minen
Hidden Champions
$ANG (-1,64%) Austin Engineering (ASX: ANG) – Australien - Produziert Minenfahrzeugkomponenten und Großausrüstung für den Tagebau
$ORI (+0%) Orica (ASX: ORI) – Australien - Führender Anbieter industrieller Sprengstoffe und Bohrchemikalien für Exploration und Bergbau
$METSO (+0,81%) Metso Outotec (HEL: METSO) – Finnland - Anlagen zur Erzaufbereitung und Metallrückgewinnung
Finanzierer / Fonds:
$SPWRC8 BlackRock Natural Resources Fund
$LIT Global X Lithium & Battery Tech ETF
Sprott Physical Battery Metals Trust – Finanzierung von Explorationsprojekten
⚗️ 2. Raffinierung & Materialchemie – „Schaufeln“ = Prozessanlagen, Chemieausrüstung
Wer profitiert: Chemieanlagenbauer, Spezialchemie, Verfahrenstechnik
$LIN (-1,34%) Linde (NYSE: LIN) – UK - Gasaufbereitung, Prozessanlagen (z. B. Elektrolyte, CO₂-neutraler Wasserstoff für Batterien)
$AI (-1,7%) Air Liquide (EPA: AI) – Frankreich - Industriegase, CO₂-freie Synthesen
$WCH (-0,26%) Wacker Chemie (ETR: WCH) – Deutschland - Siliziumverbindungen für Anoden
$BAS (-0,7%) BASF Engineering Services – Deutschland - Prozessdesign & EPC für Kathodenproduktion
$TE (+4,02%) Technip Energies (EPA: TE) – Frankreich - Engineeringlösungen für chemische Raffinerien
$ANDR (-1,32%) Andritz AG (VIE: ANDR) – Österreich - Maschinen- und Anlagenbauer für chemische Aufbereitung, Filtration und Metalltrennung
$FLS (-0,92%) FLSmidth (CPH: FLS) – Dänemark - Liefert Großanlagen für Erzveredelung und Metallrückgewinnung mit Fokus auf Energieeffizienz
$VIE (-2,98%) Veolia Environnement (EPA: VIE) – Frankreich - Entwickelt industrielle Wasser- und Abfalllösungen für Metallaufbereitung und Recycling
Hidden Champions
$PYR (+1,77%) PyroGenesis Canada (TSX: PYR) – Kanada - Setzt Plasmatechnologie ein, um Metalle sauber und effizient zu raffinieren. Nachhaltige Alternative zu traditionellen Hochtemperaturverfahren
$MMI Metalo Group (TSXV: MMI) – Kanada - Spezialist für CO₂-arme Metallraffination. Entwickelt energieeffiziente Prozesse zur Umwandlung von Rohmaterial in batteriefähige Metalle
Finanzierer / Strategische Partner:
KfW / EIB / EU Innovation Fund – fördern Material- & Recyclingprojekte
Breakthrough Energy Ventures (Gates-Fonds) – investiert in neue Kathoden- & Anodentechnologien
🧪 3. Materialtechnologie & Komponenten – „Schaufeln“ = Messtechnik, Maschinen, Software
Wer profitiert: Messgeräte, Laborautomation, Software zur Zellforschung
$TMO Thermo Fisher Scientific (NYSE: TMO) – USA - Materialanalytik
$BRKR (+6,74%) Bruker (NASDAQ: BRKR) – USA - Spektroskopie & Materialcharakterisierung
$HEN3 (-0,21%) Henkel AG & Co. KGaA (ETR: HEN3) – Deutschland - Globaler Anbieter von Industrieklebstoffen, Dichtungen und thermischen Materialien, zentral in der Batterie- und Elektronikfertigung
$MMM 3M Company (NYSE: MMM) – USA - Liefert Hochleistungs-Isolationsmaterialien, Klebstoffe und Schutzbeschichtungen für Batteriezellen und Module
$DD (+0,09%) DuPont de Nemours, Inc. (NYSE: DD) – USA - Produziert Polymere, Isolations- und Bindematerialien für Elektrolyte, Separatoren und Zellverpackungen. Fokus auf Sicherheit und Energieeffizienz
$AMAT (+0,15%) Applied Materials (NASDAQ: AMAT) – USA - Lieferant von Produktions- und Beschichtungsanlagen für Batterie- und Halbleiterfertigung
Hidden Champions
Bühler Group (privat, Schweiz) - Hersteller von Präzisionsanlagen für Pulververarbeitung, Beschichtung und Materialaufbereitung
$AFX (-0,05%) Carl Zeiss Meditec AG (ETR: AFX) – Deutschland - Führender Hersteller von optischen und bildgebenden Systemen für Forschung, Mikroskopie und Materialanalyse. Relevanz in der Zellforschung und Qualitätskontrolle von Batteriematerialien
Leica Microsystems (privat, Deutschland / Teil der $DHR (+0,49%) Danaher Corporation, NYSE: DHR – USA) - Entwickelt Mikroskope und Imaging-Systeme für Materialwissenschaft und Zellanalyse. Bedeutend für Forschung und Prozessentwicklung in der Batteriezellproduktion
Ionbond (privat, Schweiz) - Führend in Hartstoffbeschichtungen für Elektroden, Kontaktflächen und Gehäuse. Verlängert die Lebensdauer kritischer Bauteile
$ENTG Entegris (NASDAQ: ENTG) – USA - Entwickelt Spezialchemikalien, Filter- und Prozesslösungen für hochreine Batterie- und Halbleiterfertigung
Software & Simulationsanbieter:
$DSY (+0,33%) Dassault Systèmes (EPA: DSY) – Batterieentwicklungssimulation (CATIA / SIMULIA)
COMSOL AB (privat, Schweden) - Entwickler der Multiphysics-Simulationsplattform. Ermöglicht gekoppelte Simulationen von Elektrochemie, Mechanik und Thermodynamik in Batteriezellen und Energiesystemen
🏭 4. Zell- & Modulproduktion – „Schaufeln“ = Produktionsanlagen, Robotik, Messtechnik
Wer profitiert: Maschinenbauer, Automatisierung, Qualitätskontrolle
$300450 Wuxi Lead Intelligent (SHE: 300450) – China - Entwickelt automatisierte Produktionslinien für Zellherstellung und -Montage
Toshiba (TYO: 6502) – Japan - Hersteller von Zellen und Fertigungssystemen für Energiespeicher und Fahrzeuge
$SIE (-0,48%) Siemens AG (ETR: SIE) – Deutschland - Liefert digitale Produktions- und Automatisierungssoftware, inklusive „Digital Twin“-Lösungen für Batteriefabriken.
KUKA AG (ETR: KU2) – Deutschland - Robotik- und Automatisierungsexperte für Batteriepackmontage und Fertigungsprozesse
Hidden Champion
Tera Automation (privat, Italien) - Präzisionsmaschinen für Elektrodenhandling und Zellstapelung
InoBat Auto (privat, Slowakei) - Modulare Kleinserienzellproduktion mit Forschungsfokus auf Materialanpassung
Trumpf (privat, Deutschland) - Führend in Laserschweißtechnik und Fertigungssystemen für Zellgehäuse und Batteriemodule
$M5Z (+0%) Manz AG (ETR: M5Z) – Deutschland - Spezialist für Maschinen- und Anlagenbau in der Zell- und Modulproduktion. Bietet komplette Fertigungslinien für Elektroden und Zellen
$DUE (+0,77%) Dürr AG (ETR: DUE) – Deutschland - Hersteller von Beschichtungs- und Trocknungsanlagen für Batterieelektroden. Liefert zudem Trockenraumsysteme für Zellfertigung
Bosch Rexroth (privat, Deutschland) - Führend in Fertigungssteuerung, Lineartechnik und Batteriesystemintegration für automatisierte Produktionslinien.
Finanzierung & Infrastruktur
EU IPCEI Battery Initiative (Europa) - Europäisches Förderprogramm mit Milliardenvolumen zur Stärkung der europäischen Batterieproduktion und Forschung.
Capricorn Partners (privat, Belgien) - Venture-Capital-Investor mit Fokus auf Cleantech, Deeptech und Batterieprojekte in Europa. (Hidden Champion)
InnoEnergy (privat, EU / Niederlande) - EU-gestütztes Innovationsnetzwerk zur Finanzierung und Skalierung von Batterie-Start-ups wie Northvolt oder Verkor. (Hidden Champion)
Swedish Growth Fund (privat, Schweden) - Staatlich unterstützter Fonds, der in schwedische Technologieunternehmen und Batteriefertigung (Northvolt, Polarium) investiert. (Hidden Champion)
⚙️ 5. Systemintegration & Energiemanagement – „Schaufeln“ = Power Electronics, Software, Grid Control
Wer profitiert: Hardware- & Softwareanbieter, die das Energiesystem steuern
$ABBN (-0,8%) ABB Robotics (VTX: ABBN) – Schweiz - Automatisierungssysteme und Roboter für Montage, Prüfung und Qualitätsmanagement
KUKA (ETR: KU2) – Deutschland - Führender Anbieter von Robotik- und Automatisierungslösungen für Batteriepackmontage
$ENR (+1,18%) Siemens Energy (ETR: ENR) – Deutschland - Netzintegration, Mittelspannungsanbindungen
$ETN (-0,14%) Eaton (NYSE: ETN) – Irland - Netzsicherung, intelligente Stromverteilung
$SU (-1,55%) Schneider Electric (EPA: SU) – Frankreich - BMS & Energieplattform EcoStruxure
$FLNC Fluence (NASDAQ: FLNC) –USA - Steuerung von Batteriespeichern (Software + Hardware)
Hidden Champions
Fronius International (privat, Österreich) - Spezialist für Schweißtechnik und Energieversorgungssysteme in der E-Mobilität
Comau (privat, Italien) - Automatisierungsspezialist für Batteriepackmontage, Robotik und Prüfsysteme. Enge Partnerschaften mit Automobilherstellern
Teamtechnik (privat, Deutschland) - Entwickelt automatisierte Testsysteme und Produktionslinien für Batterie- und Energiemodule
Reis Robotics (privat, Deutschland) - Spezialist für Präzisionsrobotik, Schweiß- und Fügeprozesse in der Batteriefertigung
Software / KI:
TWAICE (privat, Deutschland) - Bietet Software-Plattform zur Analyse und Optimierung von Batterielebenszyklen. Fokus auf Zustandsüberwachung, Alterungsmodellierung und Second-Life-Anwendungen
AutoGrid Systems (privat, USA) - KI-basierte Software für Energiemanagement und Netzoptimierung. Vernetzt Batteriespeicher, Solar- und Windparks zu virtuellen Kraftwerken
GridBeyond (privat, Irland) - Entwickelt KI-Plattform zur Echtzeit-Netzsteuerung und Energiehandelsoptimierung für Industrie und Versorger
⚡ 6. Nutzung / Anwendungen – „Schaufeln“ = Ladeinfrastruktur, Strommanagement, Datenzentren
Wer profitiert: Betreiber von Infrastruktur, Cloud, Netzwerken
$CHPT (+2,76%) ChargePoint Holdings (NYSE: CHPT) – USA - Betreibt eines der größten Netzwerke für Elektrofahrzeug-Ladestationen in Nordamerika und Europa. Fokus auf Software- und Infrastrukturmanagement
$ABBN (-0,8%) ABB Ltd. (VTX: ABBN) – Schweiz - Globaler Energie- und Technologiekonzern, führend bei Ladeinfrastruktur, Netzmanagement und Industrieautomation
$SIE (-0,48%) Siemens AG (ETR: SIE) – Deutschland - Technologie- und Industriekonzern, stark im Bereich Energieverteilung, Automatisierung und digitale Netzsysteme
$VRT (-1,84%) Vertiv Holdings Co. (NYSE: VRT) – USA - Führender Anbieter von Energie-, Kühl- und Infrastrukturlösungen für Rechenzentren und Telekommunikation
$NVDA (-0,82%) NVIDIA Corporation (NASDAQ: NVDA) – USA - Entwickelt KI-Chips und Rechenzentrumsarchitekturen, die Energieeffizienz und Leistungsmanagement optimieren
$INTC (-1,9%) Intel Corporation (NASDAQ: INTC) – USA - Hersteller energieeffizienter Prozessoren und Rechenzentrumsplattformen, zunehmend auf KI-Workloads fokussiert
$AMD (-0,67%) Advanced Micro Devices (NASDAQ: AMD) – USA - Produziert Hochleistungsprozessoren und GPUs mit Fokus auf Effizienzsteigerung in Data-Center-Anwendungen
Hidden Champions
$WBX (+1,45%) Wallbox N.V. (NYSE: WBX) – Spanien - Hersteller intelligenter Ladegeräte und Energiemanagementsysteme für Elektrofahrzeuge und Gebäudeintegration
$SMCI Super Micro Computer, Inc. (NASDAQ: SMCI) – USA - Führender Anbieter energieeffizienter Server- und Rechenzentrumsarchitekturen für KI- und Cloud-Infrastruktur
$ALFEN (-2,02%) Alfen N.V. (AMS: ALFEN) – Niederlande - Spezialist für Smart Grids, Batteriespeicher. Starker Fokus auf europäische Elektromobilität
Finanzierer / Betreiber:
$EQIX Equinix Inc. (NASDAQ: EQIX) – USA - Weltweit größter Betreiber von Rechenzentren. Investiert zunehmend in eigene Energiespeicher- und Mikronetzlösungen zur Effizienzsteigerung und Stabilisierung der Stromversorgung
$DLR (-0,3%) Digital Realty Trust Inc. (NYSE: DLR) – USA - Betreibt globale Cloud- und Colocation-Rechenzentren. Fokus auf Integration von Batteriespeichern, erneuerbaren Energien und Energiemanagementsystemen
$BEP.UN Brookfield Renewable Partners L.P. (NYSE: BEP / TSX: BEP.UN) – Kanada - Investiert weltweit in erneuerbare Energien, Speichertechnologien und Wasserstoffinfrastruktur. Wichtiger Finanzierer und Betreiber hybrider Energiesysteme
♻️ 7. Recycling & Second-Life – „Schaufeln“ = Recyclingtechnik, Sortiermaschinen, Chemie
Wer profitiert: Recyclinganlagenbauer, Software & Logistik
$ANDR (-1,32%) ANDRITZ AG (VIE: ANDR) – Österreich - Hersteller mechanischer und chemischer Aufbereitungsanlagen für Recycling und Batteriemetallrückgewinnung
$NDA (-1,95%) Aurubis AG (ETR: NDA) – Deutschland - Europas größter Kupferproduzent und Recycler. Einstieg in Batteriemetallrückgewinnung zur Schließung von Rohstoffkreisläufen
$UMI (-2,23%) Umicore SA (EBR: UMI) – Belgien - Vollintegrierter Material- und Recyclingkonzern mit geschlossenen Metallkreisläufen
$LICY Li-Cycle Holdings Corp. (NYSE: LICY) – Kanada - Betreibt hydrometallurgische Recyclinganlagen für Lithium-Ionen-Batterien
Hidden Champions
Tozero (privat, Deutschland) - Start-up mit innovativer hydrometallurgischer Technologie zur Rückgewinnung von Lithium, Nickel und Graphit
$AMY (+3,86%) RecycLiCo (TSXV: AMY) – Kanada - Chemische Aufbereitung gebrauchter Batterien. Erzielt hohe Reinheit und geringen Energieverbrauch
ACE Green Recycling (privat, Singapur) - CO₂-neutrale Recyclingprozesse für Lithium- und Bleibatterien. Fokus auf Energieeffizienz und modulare Anlagen
Redwood Materials (privat, USA) - Start-up für Batterierecycling und Sekundärrohstoffproduktion mit Fokus auf geschlossene Lieferketten
SMS Group (privat, Deutschland) - Entwickelt Schmelzanlagen und hydrometallurgische Systeme für Metall- und Batterierecycling
Finanzierer:
EU Circular Economy Fund (EU) – fördert europäische Recycling- und Ressourceneffizienzprojekte
Breakthrough Energy Ventures (USA) – Klimafonds von Bill Gates, investiert in neue Recyclingtechnologien
EIT RawMaterials (EU) – EU-Initiative zur Unterstützung von Rohstoff-Start-ups entlang der Batterie-Value-Chain
💰 8. Übergeordnete Financiers & strategische Schaufelverteiler
Diese Akteure versorgen alle Stufen mit Kapital, Technologie oder Infrastruktur:
$BLK (-1,28%) BlackRock Inc. (NYSE: BLK) – USA - Weltgrößter Vermögensverwalter, investiert über Themen-ETFs in Batterie-, Rohstoff- und Energietechnologie
Vanguard Group (privat, USA) - Einer der größten globalen Fondsanbieter, mit passiven Investments in Energie- und Techsektoren
State Street Global Advisors (privat, USA) - Verwaltet institutionelle Fonds, u. a. auf CleanTech- und Infrastrukturthemen
SoftBank Vision Fund (privat, Japan) - Beteiligungsfonds mit Investments in Energie-, Batterie- und Robotiktechnologien
Temasek Holdings (privat, Singapur) - Staatlicher Investmentfonds, fokussiert auf nachhaltige Energie- und Infrastrukturprojekte
$GS Goldman Sachs Group Inc. (NYSE: GS) – USA - Bietet über CleanTech- und Sustainable-Finance-Fonds Investitionen in Energiespeicher- und Infrastrukturprojekte
$MS Morgan Stanley (NYSE: MS) – USA - Globaler Finanzkonzern mit dedizierten Fonds für nachhaltige Infrastruktur- und Batterieprojekte
Global X ETFs (USA) - Themenfondsanbieter mit Fokus auf Lithium & Battery Tech, Clean Energy und Critical Materials
$IVZ (+0,74%) Invesco (NYSE: IVZ) – USA - Kapitalverwalter mit strategischen Beteiligungen in CleanTech- und Infrastruktur-ETFs
$BEP.UN Brookfield Renewable Partners (NYSE: BEP) – Kanada - Investiert in saubere Energie, Batteriespeicher und Hybridkraftwerke weltweit
Hidden Champions
Khosla Ventures (privat, USA) - Risikokapitalgeber mit Fokus auf CleanTech, Speichertechnologien und Materialinnovation
InnoEnergy (privat, EU / Niederlande) - EU-finanziertes Innovationsnetzwerk, das Start-ups entlang der europäischen Batterie-Wertschöpfungskette fördert
1️⃣5️⃣.Verknüpfungspunkte – Hybrid-Energiesysteme für Rechenzentren, Industrie und Transport
Hybrid-Energiesysteme verbinden unterschiedliche Energiequellen wie Batterien, Brennstoffzellen, Photovoltaik, Windkraft und Netzstrom, zu einem intelligent gesteuerten Gesamtsystem. Ziel: maximale Effizienz, Stabilität und Versorgungssicherheit bei minimalen Emissionen.
Diese Systeme sind das Herz der Energieinfrastruktur 4.0. Sie bündeln Speicherung, Steuerung und Nutzung auf einer Plattform. Entscheidend ist nicht mehr, welche Energiequelle, sondern wie sie integriert wird.
1. Rechenzentren – Energieeffizienz durch Speicher und Netzintelligenz
Kernidee: Rechenzentren sind Dauerverbraucher. Hybridsysteme aus Batteriespeicher + Brennstoffzelle + Netzmanagement kompensieren Lastspitzen und versorgen Server bei Netzausfällen ohne Dieselgeneratoren.
Technologische Verbindung:
Lithium- oder Natrium-Ionen-Batterien für kurzfristige Lastspitzen
Wasserstoff-Brennstoffzellen für Not- und Langzeitversorgung
Intelligente Energiemanagement-Software (EMS) zur Lastverteilung
Relevante Unternehmen:
$VRT (-1,84%) Vertiv (NYSE: VRT) – USA – Energie- und Kühlinfrastruktur für Rechenzentren
$SU (-1,55%) Schneider Electric (EPA: SU) – Frankreich – Digitale Stromverteilung, Smart Grids
$ABBN (-0,8%) ABB (VTX: ABBN) – Schweiz – Energieautomation, modulare Microgrids
$EQIX Equinix (NASDAQ: EQIX) – USA – Betreiber, integriert Batteriespeicher und Brennstoffzellen
$NVDA (-0,82%) NVIDIA (NASDAQ: NVDA) – USA – KI-basierte Laststeuerung und Optimierung
2. Industrie – Hybrid-Stromsysteme und Lastmanagement
Kernidee: Energieintensive Industrien nutzen kombinierte Systeme aus Speicher, erneuerbaren Quellen und Wasserstoff, um Netzunabhängigkeit und Kosteneffizienz zu erreichen.
Technologische Verbindung:
Batteriespeicher (Li-Ion, Natrium-, Feststoff-) für Produktionsspitzen
Wasserstoff zur Langzeitspeicherung
Wärmerückgewinnung + Netzsteuerung über KI
Relevante Unternehmen:
$SIE (-0,48%) Siemens (ETR: SIE) – Deutschland – Industrielle Microgrids, Energiesteuerung
$WRT1V (+1,34%) Wärtsilä (HEL: WRT1V) – Finnland – Hybridkraftwerke für Industrie und Inselnetze
$TTE (+1,01%) TotalEnergies (EPA: TTE) – Frankreich – Integration von Solar, Batterie und Wasserstoff in Industrieparks
AutoGrid (privat, USA) – KI-Plattform für Energiemanagement (Hidden Champion)
$ALFEN (-2,02%) Alfen (AMS: ALFEN) – Niederlande – Smart Grid- und Speichersysteme.(Hidden Champion)
3. Transport – Energieinfrastruktur der neuen Mobilität
Kernidee: Der Verkehrssektor wird zunehmend elektrisch, doch mit unterschiedlichen Energieträgern. Hybrid-Infrastrukturen kombinieren Batterie-, Wasserstoff- und Netzsysteme für Straße, Schiene und Luftfahrt.
Technologische Verbindung:
Batterie-Wechselstationen und Schnellladehubs
Wasserstofftankstellen + lokale Elektrolyse
Sektorkopplung zwischen Verkehr, Strom und Wärme
Relevante Unternehmen:
$TSLA (+2,38%) Tesla Energy (NASDAQ: TSLA) – USA – Energiespeicher- und Ladeinfrastruktur
$NIO NIO Inc. (NYSE: NIO) – China – Batteriewechsel-Netzwerke
$005380 Hyundai Motor (KRX: 005380) – Südkorea – Kombination aus Batterie- und Brennstoffzellen-Antrieb
$BLDP (+0,99%) Ballard Power (NASDAQ: BLDP) – Kanada – Brennstoffzellen für Nutzfahrzeuge
$NEL (-0,87%) Nel ASA (OSL: NEL) – Norwegen – Wasserstoff-Elektrolyse und Betankungssysteme
4. Verbindungsebene – das Energiesystem 4.0
Auf dieser Ebene verschmelzen Batterie, Brennstoffzelle, erneuerbare Quellen und digitale Steuerung zu einem gemeinsamen Daten- und Energiefluss. Der Schlüssel liegt in der Sektorkopplung: Strom, Wärme, Mobilität und Daten teilen sich ein dynamisches Netz.
Technologische Plattformen & Treiber:
$ENR (+1,18%) Siemens Energy (ETR: ENR) – Hybride Netzarchitekturen, Power-to-X
Hitachi Energy (privat, CH/JP) – Steuerungssysteme und Netzstabilisierung
$ETN (-0,14%) Eaton (NYSE: ETN) – Energieverteilung, Lastmanagement
$ADSE (+10,2%) ADS-TEC Energy (NASDAQ: ADSE) – Schnelllade- und Speichersysteme. (Hidden Champion)
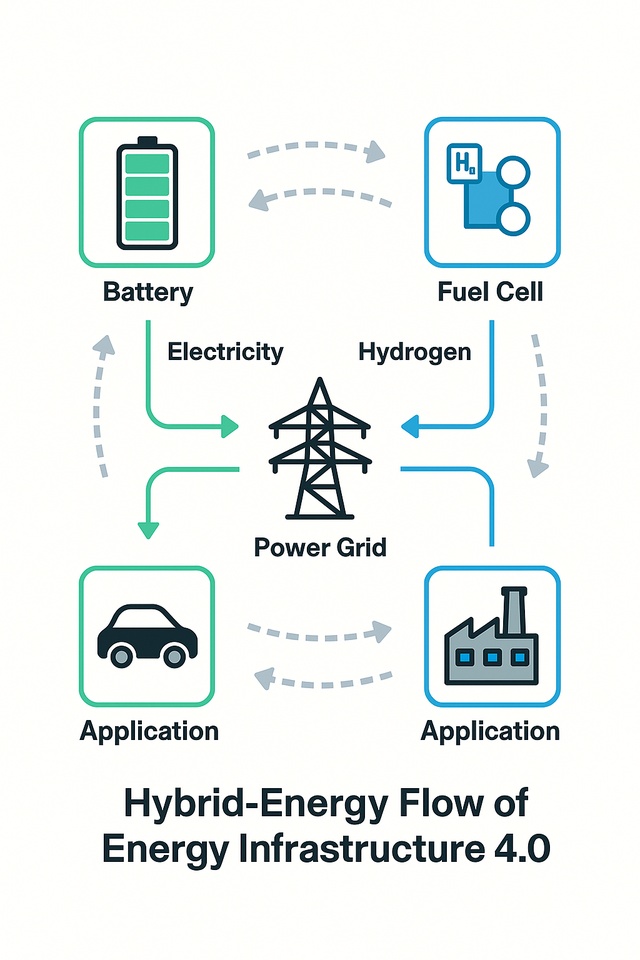
Nach der Betrachtung der Wertschöpfungsketten und sektorübergreifenden Anwendungen möchte ich euch jetzt das Ganze in einer vereinfachten Systemgrafik zeigen. Die Grafik visualisiert den Energiefluss eines hybriden Energiesystems: Erneuerbare Quellen speisen Strom in Batteriespeicher und Brennstoffzellen, die wiederum Verbraucher wie Rechenzentren, Industrie und Transport versorgen. Eine KI-Steuerung verbindet alle Ebenen zu einem selbstregulierenden, datengetriebenen Kreislaufsystem, das Fundament der Energieinfrastruktur 4.0.
Struktur:
1.Energiequellen (oben links)
Sonne ☀️ → Photovoltaik
Wind 🌬 → Windturbinen
Netzstrom ⚡ → Einspeisung aus öffentlichem Stromnetz
Wasserstoff (H₂) → erzeugt durch Elektrolyse aus Überschussenergie
2.Umwandlung und Speicherung (zentral im Diagramm)
Batteriesysteme (Lithium-Natrium-, Feststoff) – kurzzeitige Energiespeicherung
Brennstoffzellen / Wasserstofftanks – Langzeitspeicherung und Rückverstromung
Hybridsteuerung / Energiemanagementsystem – KI-basierte Steuerung des Energieflusses
➜ Bidirektionale Pfeile zwischen Batterie ↔ Brennstoffzelle ↔ Netz, symbolisieren Energieaustausch und Lastmanagement
3.Verbraucher (unten rechts)
Rechenzentren – konstante Grundlast, Absicherung durch Speicher und Brennstoffzellen
Industrie – flexible Laststeuerung, Nutzung von Hybridenergie zur Stabilisierung
Transportsektor – E-Mobilität, Schnellladehubs, Wasserstofflogistik
4.Daten- und Steuerungsebene (oberhalb der Mitte)
KI-Plattformen (z. B. AutoGrid, TWAICE, NVIDIA)
Cloud-Integration für Echtzeit-Daten
Steuerung von Energiefluss, CO₂-Emissionen und Kosten
5.Rückkopplung (unterhalb / Basis des Systems)
Recycling → Rohstoffrückgewinnung → Zellproduktion
Kreislaufpfeil führt visuell zurück zu den Energiequellen – Symbol für geschlossene Wertschöpfung
Der Hybrid-Energiefluss macht sichtbar, wie Strom, Wasserstoff, Daten und Rohstoffe sich in einem zirkulären, datengetriebenen Netz gegenseitig verstärken. Das ist die Basis der Energieinfrastruktur 4.0. Diese ist dynamisch, dezentral und sektorenübergreifend verknüpft.
1️⃣6️⃣.Energie für humanoide Roboter, die nächste Evolutionsstufe der Anwendung
Die nächste industrielle Revolution spielt sich nicht mehr nur in Rechenzentren oder Fahrzeugen ab, sondern in der Verschmelzung von Mensch, Maschine und Energie. Humanoide Roboter stehen sinnbildlich für diesen Übergang. Das sind Systeme, die denken, handeln und sich selbst versorgen müssen. Ihre Energiequelle ist das, was sie überhaupt erst funktionsfähig macht.
Hier treffen Batterietechnik, Mikronetzsysteme und intelligente Energieverteilung direkt auf künstliche Intelligenz. Leistungsdichte, Langlebigkeit und Energieeffizienz entscheiden darüber, wie autonom diese Maschinen agieren können. Ob in der Industrie, in der Pflege, in der Logistik oder im Alltag, die Stabilität ihrer Energieversorgung wird zum strategischen Faktor für ganze Wertschöpfungsketten. Batterien der nächsten Generation, Feststoffsysteme und Mini-Brennstoffzellen bilden dabei das Fundament. Unternehmen, die diese Technologien entwickeln oder liefern, schaffen nicht nur Produkte, sondern Infrastruktur für eine neue Form von Intelligenz, welche energetisch unabhängig, vernetzt und skalierbar ist.
16.1 Technische Grundlage: Was ein Humanoid energetisch wirklich braucht
Ein humanoider Roboter ist im Kern ein mobiles Energiesystem. Er muss laufen, greifen, heben, balancieren, kommunizieren, sehen, denken und dabei sicher bleiben. Das alles kostet konstant Energie.
Wesentliche Anforderungen: hohe Energiedichte bei geringem Gewicht, kurzfristige Leistungsspitzen, thermische Stabilität, Rekuperation und lange Betriebsdauer ohne manuelles Nachladen. Aktuell liegt der Energiebedarf humanoider Roboter zwischen 500 Watt und 2 Kilowatt bei Energiespeichern von 1 bis 5 Kilowattstunden. Industrietauglich wird ein System erst, wenn es mehrere Stunden autonom laufen kann und sich selbst nachlädt oder Module tauscht.
16.2 Speicherstatus heute und in fünf Jahren
Heute:
Lithium-Ionen-Systeme (NMC, NCA) dominieren wegen hoher Energiedichte.
LFP-Zellen punkten bei Sicherheit und Lebensdauer.
In fünf Jahren:
Silizium-Anoden steigern Energiedichte und Ladegeschwindigkeit.
Teil- und Vollfeststoffbatterien erhöhen Sicherheit und Stabilität.
Kombinationen aus Batterie und Brennstoffzelle entstehen für Dauerlastanwendungen.
Damit verschiebt sich der Energiemarkt der Robotik in Richtung modularer, austauschbarer Hochleistungszellen mit aktivem Thermomanagement und smarter Steuerung.
16.3 Unternehmenslandkarte
A. Zellen und Hochenergiedichte
$AMPX Amprius (NYSE: AMPX) – USA Silizium-Anoden mit hoher Energiedichte, ideal für Robotik und Drohnen
$ENVX (+3,52%) Enovix (NASDAQ: ENVX) – USA 3D-Zellarchitektur, kompakt und schnellladefähig
$QS QuantumScape (NYSE: QS) – USA Entwickelt Feststoffzellen mit keramischen Elektrolyten
$SLDP Solid Power (NASDAQ: SLDP) – USA Feststoffelektrolyte für sichere Hochleistungszellen
Sila Nanotechnologies (privat, USA) Silizium-Anodenmaterialien für leichtere Systeme
B. Batteriepack-Architektur und Integration
$TSLA (+2,38%) Tesla Energy (NASDAQ: TSLA) – USA Vertikal integrierte Batteriepacks inklusive BMS
$NIO NIO Inc. (NYSE: NIO / HKG: 9866) – China Batteriewechselsysteme für modulare Energieversorgung
$LECN (+0%) Leclanché (SWX: LECN) – Schweiz Modulare Packs für Industrie und Logistik
C. Aktuatoren und Antriebsmechanik
$6324 (-2,73%) Harmonic Drive Systems (TYO: 6324) – Japan Präzisionsgetriebe für humanoide Gelenke
$6268 (+1,39%) Nabtesco (TYO: 6268) – Japan Cycloidal-Getriebe für hohe Lasten und Stabilität
Maxon (privat, Schweiz) Hochleistungs-Motoren mit hoher Effizienz
D. Leistungselektronik und Steuerung
$IFX (-0,67%) Infineon Technologies (ETR: IFX) – Deutschland Leistungshalbleiter für Motorsteuerung und Energieverteilung
$STM STMicroelectronics (EPA: STM) – Schweiz / Frankreich Sensorik und Energiecontroller
$TXN Texas Instruments (NASDAQ: TXN) – USA BMS-Komponenten und Zellüberwachung
E. Laden, Versorgung und Infrastruktur
$ADSE (+10,2%) ADS-TEC Energy (NASDAQ: ADSE) – Deutschland Hochleistungsspeicher und Schnellladeeinheiten
Wiferion (privat, Deutschland) Induktives Laden für autonome Systeme
$ALFEN (-2,02%) Alfen (AMS: ALFEN) – Niederlande Smart Grids und Ladeinfrastruktur für Robotik und Industrie
F. Steuerung, Flottenmanagement und Energieintelligenz
TWAICE (privat, Deutschland) Software für Batteriezustand und Lebensdauerprognose
AutoGrid (privat, USA) KI-basierte Plattform für Energieverteilung und Laststeuerung
$NVDA (-0,82%) NVIDIA (NASDAQ: NVDA) – USA Rechenplattformen für Echtzeitsteuerung und Energiemanagement
16.4 Wer hat das meiste Potenzial
Kurzfristig: Harmonic Drive Systems, Nabtesco, Maxon – weil jeder humanoide Roboter präzise, effiziente Gelenke braucht.
Mittelfristig: Amprius, Enovix, Sila, QuantumScape, Solid Power – sie steigern Energiedichte und Betriebssicherheit, das zentrale Kriterium der Autonomie.
Systemisch: NVIDIA, AutoGrid, TWAICE – weil die Zukunft nicht nur in der Speicherung, sondern in der intelligenten Steuerung des Energieflusses liegt.
16.5 Praxis-Blueprint – Energie-Stack eines humanoiden Roboters
Energiespeicher: Leichtes Hochenergie-Batteriemodul mit aktivem Thermomanagement, auf NMC- oder Siliziumbasis.
Antrieb: BLDC-Motoren mit Harmonic- oder Cycloidal-Getrieben, Rekuperation integriert. Leistungselektronik: Inverter und DC/DC-Stufen von Infineon oder STMicro, BMS von Texas Instruments.
Ladeinfrastruktur: Schnellwechsel-Packs, induktives Zwischenladen mit ADS-TEC oder Wiferion.
Intelligenz: Zustandsdiagnose über TWAICE, Energiekoordination durch AutoGrid, Rechensteuerung über NVIDIA.
Ein solcher Stack macht humanoide Roboter nicht nur lauffähig, sondern wirtschaftlich einsetzbar. Es geht nicht mehr nur um Robotik, sondern um Energiekompetenz. Wer diesen Stack beherrscht, kontrolliert nicht nur die Maschine, sondern auch den Geschäftsfall dahinter.
1️⃣7️⃣.Takeaway
Die Batterieindustrie hat sich längst von einer Einzellösung zu einem vielschichtigen Ökosystem entwickelt, in dem Materialien, Technologien, Daten und Energieflüsse ineinandergreifen. Hybrid-Energiesysteme, die Batterien, Brennstoffzellen und erneuerbare Quellen kombinieren, sind keine Vision mehr, sondern Realität, sichtbar in Rechenzentren, Industrieparks und Transportsystemen auf der ganzen Welt. Entscheidend ist dabei nicht mehr nur, wie Energie erzeugt oder gespeichert wird, sondern wie sie intelligent gesteuert und in bestehende Netze eingebunden wird. Genau hier entsteht der eigentliche Mehrwert: in der Fähigkeit, Energieflüsse, Datensysteme und Kapitalströme zu synchronisieren. Vielleicht ist das der Punkt, an dem sich künftig entscheidet, wer die wahre Energieautonomie gestaltet, jene die Energie herstellen, oder jene, die sie präzise steuern können?
1️⃣8️⃣.Quellen & verwendete Daten:
Internationale Energieagentur (IEA) – Global EV & Battery Outlook 2024
BloombergNEF – Battery Supply Chain & Energy Storage Report
McKinsey & Company – Battery Value Chain 2030
Fraunhofer ISI – Energiesystemanalyse Deutschland & EU 2024
Unternehmensberichte & Investor Relations:
CATL, Tesla, Northvolt, Siemens Energy, Hitachi Energy
Manz AG, Vulcan Energy, Li-Cycle, Umicore, Albemarle
Marktanalysen: Benchmark Minerals Intelligence, S&P Global, Reuters Energy Desk
Forschungsquellen: IEA Hydrogen Roadmap, EU Strategic Raw Materials Act, Battery Passport Initiative (Global Battery Alliance)
Bildmaterial:
Illustratives Bild — JLStock / Shutterstock.com
Foto: dpa
https://tse1.mm.bing.net/th/id/OIP.Zs6cG53hAFkOB4TXG0psVgHaDR?pid=Api&P=0&h=180