
$ABBN (-3,18%)
$GE
$RTX (+2,06%)
$HAL (-2,15%)
$MMM (+1,33%)
$NOC (+2,57%)
$MSCI (+2,82%)
$ISRG (+3,5%)
$SPCX (-8,46%)
$NFLX (+2,97%)
$DB1 (+2,96%)
$CME (+3,49%)
$T (+3,7%)
$PM (+1,86%)
$MCO (+0,58%)
$NEE (+4,97%)
$UAL (+0,66%)
$MONC (+0,75%)
$TXN (-1,27%)
$META (-11,17%)
$IBM (-2,9%)
$SAP (+0,76%)
$QS (-5,4%)
$LRCX (-6,99%)
$TSLA (-3,54%)
$RMS (-5,86%)
$NESN (+3,01%)
$BARC (-2,17%)
$ROP (+1,29%)
$DOW (+5,08%)
$SPOT (+11,1%)
$NDAQ (+7,48%)
$AAL (+2,86%)
$LMT (+6,51%)
$PG (+5,82%)
$BX (+7,94%)
$BESI (-5,03%)
$VLO (-2,09%)
$KER (-10,2%)
$OR (+5,88%)
$VRSN (-3,95%)
$WDC (-10,09%)
$BE (-14,92%)
$NEM (-1,7%)
$TOM (-1,17%)
$AXP (+0,64%)
$FIX (-12,91%)

Comfort Sys
Ação
Ação
Ticker: FIX
FIX
Price
Discussão sobre FIX
Postos
204D·
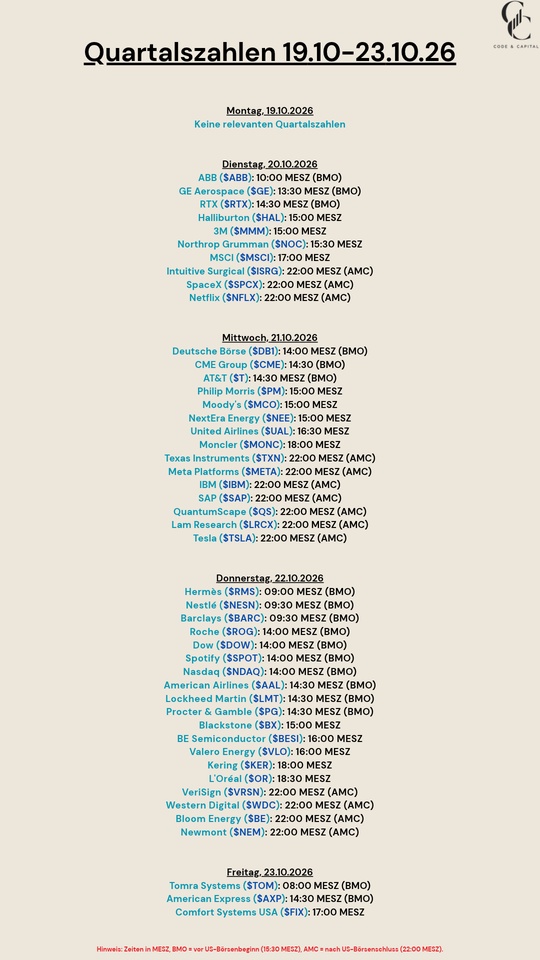
Quarterly Results: Oct. 19–23, 2026
99
2Semana·
📊 Wikifolio Update September 2026: up 1.03%, tech stocks up, mining stocks down, and 18 of 30 positions swapped on October 1
In August, gold mines were the market's top performers. In September, they were the most expensive. Fresnillo
$FRES (-4,07%) down 15 percent, Micron
$MU (-7,13%) up 17. At the end of the month, the Wikifolio was up 1.03 percent, and one day later, I swapped out 18 of 30 positions.
September was all about interest rates and oil. Brent rose above $100 in the second week and, following a Saudi pipeline outage, briefly hit $110. U.S. inflation stood at 3.4 percent in August. On September 16, the Fed raised the benchmark interest rate by a quarter point to 3.75 to 4.00 percent, for the first time since July 2023. The 10-year U.S. yield subsequently climbed to 5.19 percent, a level last seen in 2007. This hardly bothered tech stocks. The Nasdaq hit a record high on September 21, and AMD has been worth one trillion dollars ever since. The situation was different in Europe. German inflation jumped to 3.3 percent, and the DAX lost about four percent over the month.
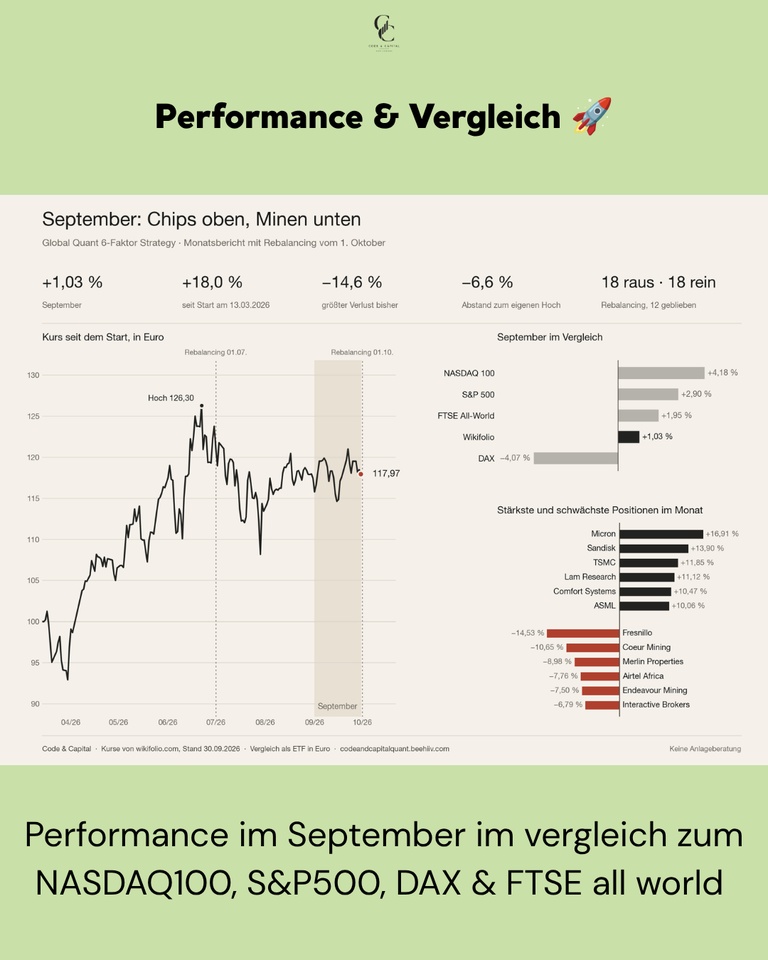
📊 Monthly performance: +1.03%
📊 Price as of September 30: €117.97
📊 Largest loss since inception: −14.6%
📊 Max performance: +18% (since March 13, 26)
Next rebalancing: Early January 2027
Performance & Comparison 🚀
The U.S. indices posted clear gains when calculated in euros, with the Nasdaq leading the way. The Wikifolio did not keep pace. It lagged behind the Nasdaq, S&P 500, and FTSE All-World, and outperformed only the DAX.
Performance Comparison (September 1–30, 2026, end of day):
Global Quant 6-Factor: +1.03%
NASDAQ 100: +4.18%
S&P 500: +2.90%
FTSE All-World: +1.95%
DAX: −4.07%
You can see what caused this in the two lists below. Tech stocks delivered, while mining stocks and a few individual stocks ate up a good chunk of those gains.
Purchases & Sales 💶
None in September itself. The model trades only on four dates per year, and the third was on October 1. What happened then is detailed in its own section below.
Top Movers in September 🟢
The month belonged to semiconductors and memory stocks. Midway through the month, Intel’s CEO said the company could currently only meet about half of the demand for processors. After that, the entire industry picked up steam. Micron
$MU (-7,13%) topped the list with +16.91%, followed by SanDisk
$SNDK (-9,8%) at +13.90% and TSMC
$2330 at +11.85%. Lam Research
$LRCX (-6,99%) rose +11.12%, ASML
$ASML (-6,66%) +10.06%. In between is Comfort Systems $FIX (-12,91%) , a stock that has nothing to do with chips, up 10.47%. In August, Comfort Systems was still among the losers.
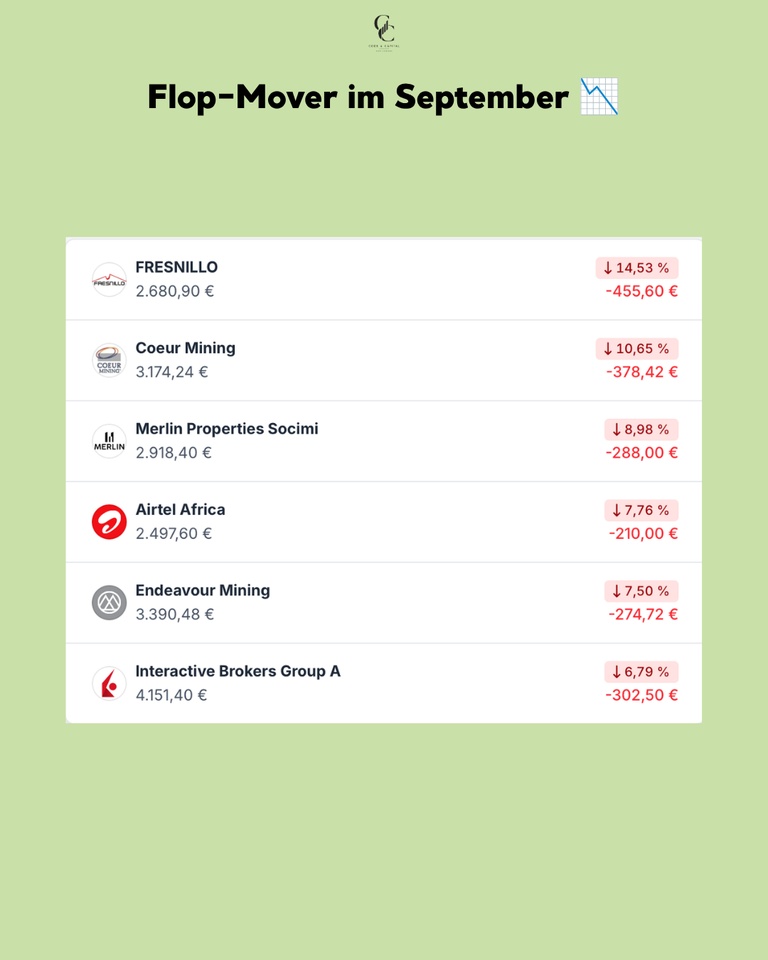
September’s Big Losers 🔴
Gold and silver declined in September, with silver falling much more sharply. Rising yields and a stronger dollar weighed on prices. Mining stocks followed suit. Fresnillo
$FRES (-4,07%) lost −14.53%, Coeur Mining
$CDE (-8,11%) −10.65%, and Endeavour Mining $EDV (-5,07%) -7.50%. In August, all three were still on the other list with gains of over 25 percent. Merlin Properties fell −8.98%, Airtel Africa
$AAF (-0,82%) down 7.76%, and Interactive Brokers
$IBKR (-3,68%) fell by 6.79%.
Rebalancing on October 1 🔄
On October 1, the third rebalancing since the start took place. I swapped out 18 of 30 positions—more than ever before. In July, it was nine.
All nine banks are out: Bankinter
$BKT (-8,23%) , CaixaBank
$CABK (-6,44%) , BBVA
$BBVA (-2,61%) , UniCredit
$UCG (-4,29%) , BPER
$BPE (-2,96%) , Monte dei Paschi $BMPS (-4,21%) , Banca Mediolanum
$BMED (-2,5%) , Swedbank$SWED A (-3,72%) and HSBC
$HSBA (-2,34%) . In addition, Interactive Brokers $IBKR (-3,68%) , Antofagasta $ANTO (-6,03%) , Coeur Mining
$CDE (-8,11%) , AppLovin
$APP (-1,43%) , Airtel Africa
$AAF (-0,82%) , Merlin Properties and Solaria
$SLR (-6,83%) . Investor AB
$INVE B (-1,83%) and Pershing Square
$PSH (+0,22%) are also no longer in the portfolio. So four of the six underperformers listed above are no longer in the portfolio.
Six stocks from the healthcare sector were added: Eli Lilly
$LLY (+2,96%) , Bristol-Myers
Squibb
$BMY (+3,42%) , Vertex $VRTX , Incyte
$INCY (+3,24%) , Illumina
$ILMN (-5,39%) and WuXi AppTec
$603259 . Five are from the semiconductor and storage sectors: Seagate
$STX (-9,15%) , Marvell
$MRVL (-9,42%) , Applied
Materials
$AMAT (-5,41%), Teradyne
$TER (-11,58%) and KLA
$KLAC (-7,6%) . The rest is split among Fortinet
$FTNT (+0,35%) , CF Industries
$CF (+2,15%) , Marathon Petroleum
$MPC (-1,57%) , APA
$APA (-1,46%) , Pop Mart $9992 (-1,02%) , Hong Kong Exchanges
$388 (-1,17%) and Lion Finance
$BGEO (-4,26%) .
Twelve remain: SanDisk, Micron, Western Digital, Nvidia, Lam Research, TSMC, ASML, Alphabet, Comfort Systems, Fresnillo, Endeavour and Newmont. All six of September’s top movers are included.
Two names stand out. Applied Materials and KLA I sold on July 1, up 92 and a gain of 90 percent. Now both are back in my portfolio. The model doesn’t remember what it has sold in the past. It only looks at where a stock stands in the ranking today.
Conclusion 💡
The portfolio looks different after October 1 than it did before. In September, about 41 percent was still in financial stocks; now there are two positions out of 30. Instead, 12 out of 30 are in semiconductors and memory, and six are in the healthcare sector. There’s no sector limit; the model sorts by score, not by industry. Trading won’t resume until early January.
How was your September? And did you hold onto your stocks after the pullback, or did you sell them? 👇
➡️ Every month, you’ll find the complete Wikifolio update here, along with research in between.
📈 Wikifolio $DE000LS9V052 (-4,03%)

+ 1
77
8 Comentários
Epi@Epi
2Semana
•
11
•Ver todas as 5 restantes respostas
1Mês·
📊 Wikifolio Update August 2026
SanDisk $SNDK (-9,8%) up 28 percent, Western Digital $WDC (-10,09%) down 18 percent. Both in the same sector, in the same month. My model didn’t react to either of these movements, yet at the end of the month it was still up 3.03 percent.
August had two sides. At the beginning of the month, mild inflation data was released, and the S&P 500 hit an all-time high of 7,816 points on August 13. After that, sentiment on the bond markets shifted. The 30-year U.S. yield rose to its highest level in nearly twenty years, and U.S. gross debt exceeded forty trillion dollars. At the end of the month, Nvidia reported $NVDA (-4,39%) quarterly revenue of 96.2 billion, an increase of 106 percent. The next day, Fed Chairman Warsh signaled a pause in Jackson Hole, and the market priced in an interest rate hike in September.
📊 Monthly performance: +3.03%
📊 Max. Performance: 16.1%
📊 Price as of Aug. 31: €116.85
📊 Next Rebalancing: October 1, 2026
Performance & Comparison 🚀
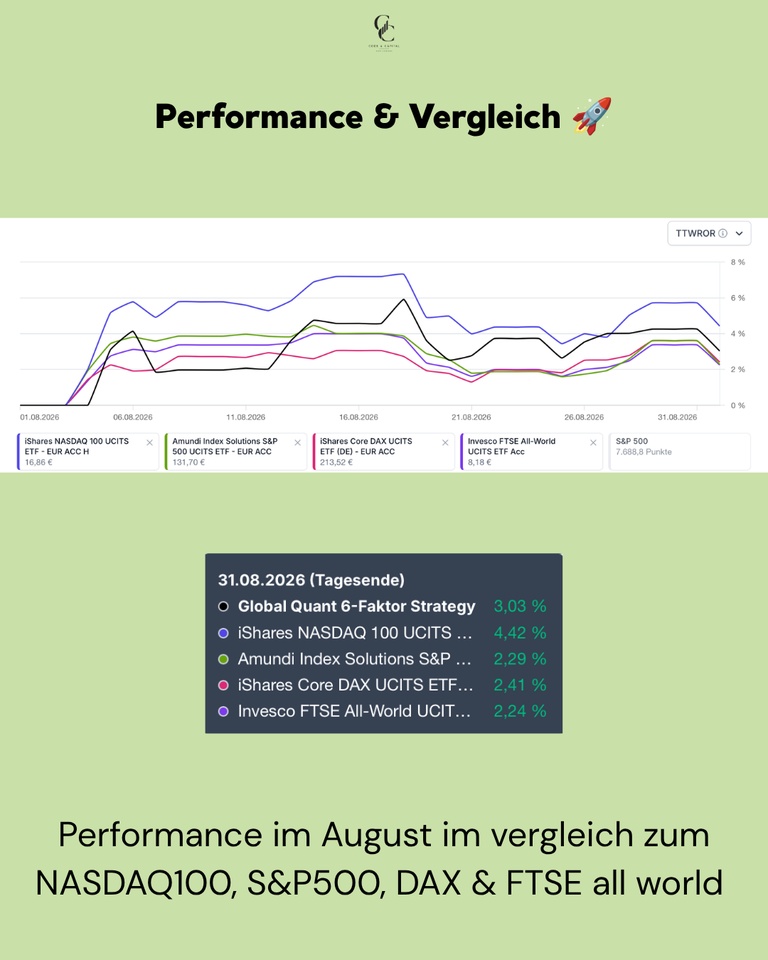
August was a positive month for all major indices. The Nasdaq led the way, driven by Nvidia. The model performed in the middle of the pack and outperformed the broad indices.
Performance Comparison (August 1–August 31, 2026, end of day):
Global Quant 6-Factor: +3.03%
NASDAQ 100: +3.57%
S&P 500: +2.74%
FTSE All-World: +2.27%
DAX: +2.03%
Purchases & Sales 💶
None. The model trades only quarterly; the last rebalancing took place on July 1. Nothing happens between those dates, even if individual positions diverge significantly. That is precisely the point of the rules. The next rebalancing is scheduled for October 1, when a larger portion of the portfolio will be replaced.
Top Movers in August 🟢
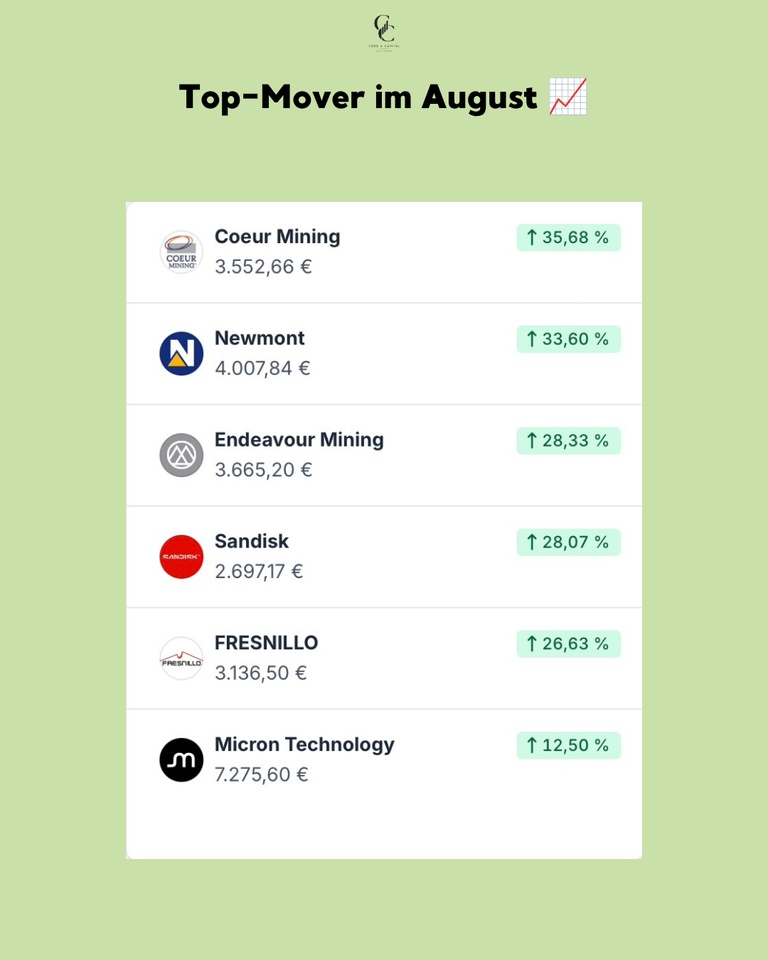
The month belonged to gold mining stocks. Over the course of the month, gold rose at times to nearly $4,700, reaching its highest level since May. By the end of the month, it had given back some of those gains. The move was driven by a weaker dollar combined with ongoing central bank purchases. Mining stocks react to this with leverage because their margins rise disproportionately. Coeur Mining $CDE (-8,11%) topped the list with +35.68%, followed by Newmont $NEM (-1,7%) at +33.60% and Endeavour Mining at +28.33%. Fresnillo $FRES (-4,07%) rose +26.63%. All four have been in the portfolio since the spring. In addition, the storage stocks performed well. SanDisk $SNDK (-9,8%) rose by +28.07%, and Micron $MU (-7,13%) by +12.50%.
August’s Biggest Losers 🔴
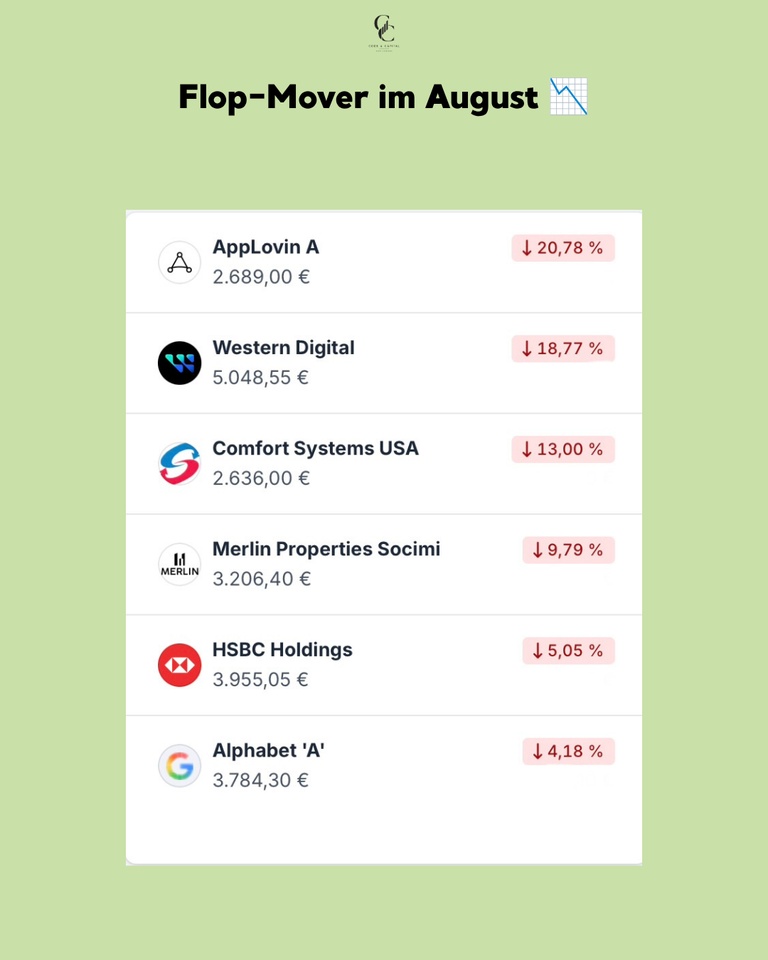
AppLovin $APP (-1,43%) suffered the biggest loss at -20.78%. Western Digital $WDC (-10,09%) fell -18.77%, while SanDisk gained nearly thirty percent over the same period. Comfort Systems $FIX (-12,91%) fell by -13.00%, and Merlin Properties $MRL (-3,23%)
-9.79%. Among financial stocks, the decline was limited; HSBC $HSBA (-2,34%) lost -5.05%. Alphabet $GOOG (-3,05%) fell -4.18%.
Conclusion 💡
August demonstrated the value of a diversified portfolio. While technology stocks diverged and AppLovin fell 20 percent, gold mines carried the month. None of these positions are in the portfolio based on personal opinion; they’re there because the ranking placed them at the top. October 1 will be interesting because a large portion of the commodity stocks are on the sell list.
❓ Question for the Community
Did the volatility in August make you get cold feet, or did you stubbornly hold onto your positions? And how much gold do you currently have in your portfolio?
👇 Let us know in the comments!
➡️ Every month, you’ll find the full Wikifolio update here, along with research from the model in between.
🗞️ Newsletter: codeandcapitalquant.beehiiv.com
📈 Wikifolio: https://www.wikifolio.com/de/de/w/wf0gquant6
+ 1
1010





2Mês·
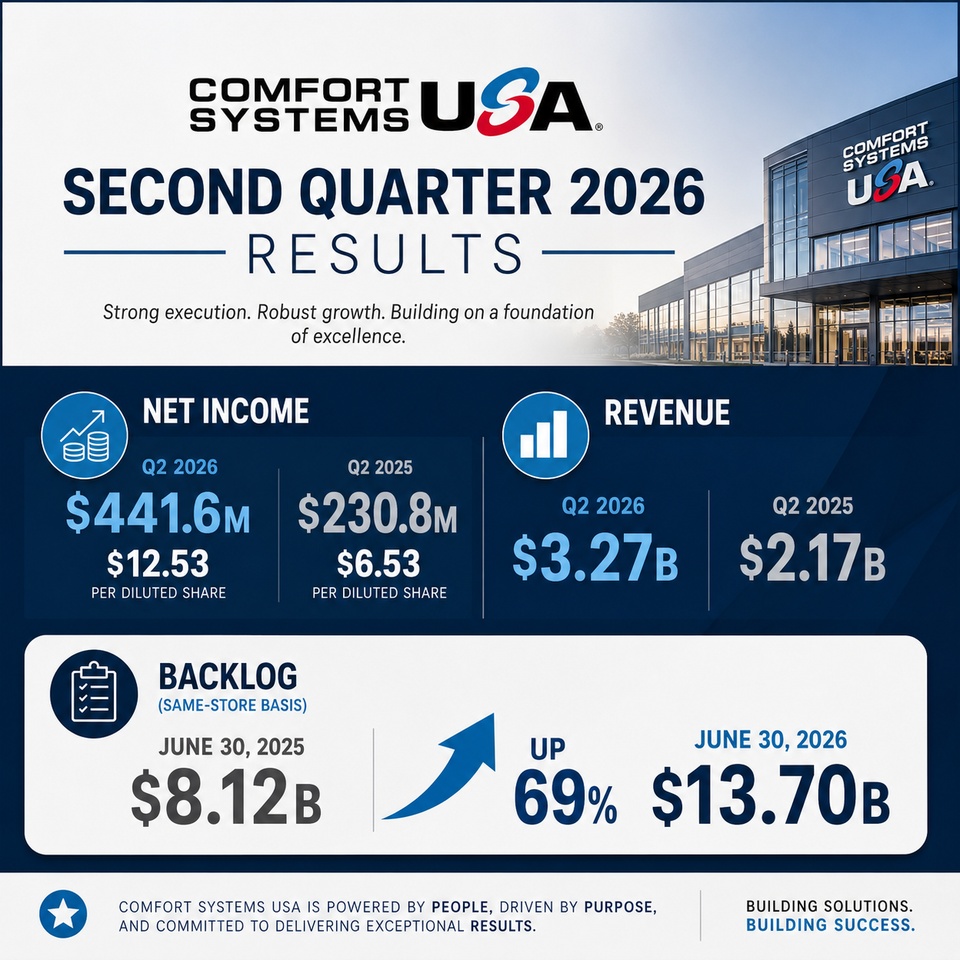
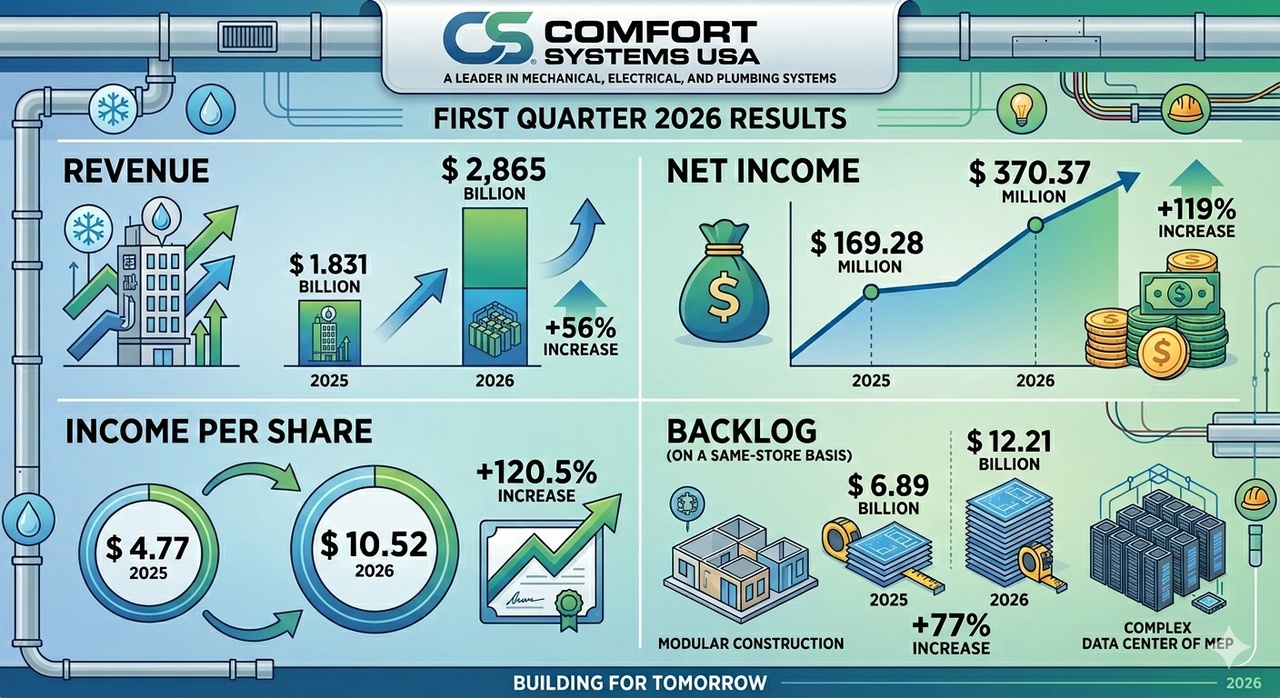
𝐂𝐨𝐦𝐟𝐨𝐫𝐭 𝐒𝐲𝐬𝐭𝐞𝐦𝐬 𝐔𝐒𝐀: 𝐑𝐞𝐜𝐨𝐫𝐝 𝐂𝐚𝐬𝐡 𝐅𝐥𝐨𝐰 𝐚𝐧𝐝 𝐁𝐚𝐜𝐤𝐥𝐨𝐠 𝐅𝐮𝐞𝐥 𝐀𝐧𝐨𝐭𝐡𝐞𝐫 𝐁𝐥𝐨𝐰𝐨𝐮𝐭 𝐐𝐮𝐚𝐫𝐭
📊 𝐑𝐞𝐬𝐮𝐥𝐭𝐬
• EPS: $12.53 (Est. $10.46) ✅
• Revenue: $3.27B (Est. $2.99B) ✅
• Operating cash flow: $1.14B vs. $252.5M YoY
• Backlog reached a record $14.06B, up from $8.12B a year ago.
• Operating margin expanded to 17.1% from 13.8% YoY.
⠀
📌 𝐊𝐞𝐲 𝐓𝐚𝐤𝐞𝐚𝐰𝐚𝐲𝐬
• Revenue increased 50% YoY while EPS surged 92%, driven by broad-based execution across end markets.
• Free cash flow reached a record $999.3M as strong project execution accelerated cash conversion.
• Same-store backlog increased to $13.70B from $8.12B a year ago, supporting visibility into 2027.
⠀
💬 𝐌𝐚𝐧𝐚𝐠𝐞𝐦𝐞𝐧𝐭 𝐂𝐨𝐦𝐦𝐞𝐧𝐭𝐚𝐫𝐲
CEO Brian Lane said Comfort Systems delivered record results across virtually every operating metric, highlighting unprecedented quarterly cash flow above $1B and a rapidly expanding backlog. Management expects strong demand and project pipelines to support continued growth through the rest of 2026 and into 2027.
33
3Mês·
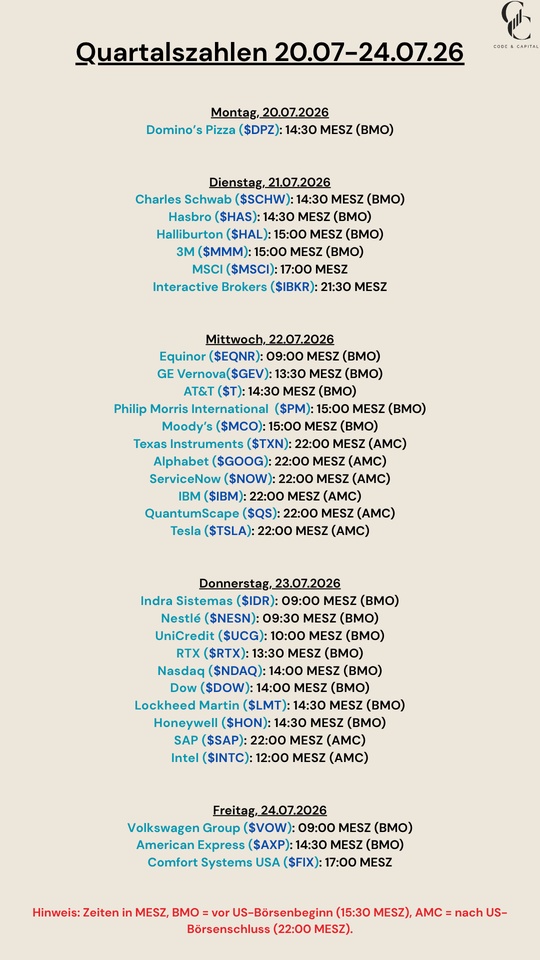
Quarterly Results: July 20–24, 2026
$DPZ (+0,54%)
$SCHW (-0,1%)
$HAS (+1,85%)
$HAL (-2,15%)
$MMM (+1,33%)
$MSCI (+2,82%)
$IBKR (-3,68%)
$EQNR (+0,88%)
$GEV (-10,85%)
$T (+3,7%)
$PM (+1,86%)
$MCO (+0,58%)
$TXN (-1,27%)
$GOOG (-3,05%)
$NOW (+1,42%)
$IBM (-2,9%)
$QS (-5,4%)
$TSLA (-3,54%)
$IDR (-0,32%)
$NESN (+3,01%)
$UCG (-4,29%)
$RTX (+2,06%)
$NDAQ (+7,48%)
$DOW (+5,08%)
$LMT (+6,51%)
$HON (+1,81%)
$SAP (+0,76%)
$INTC (-8,8%)
$VOW (+0,4%)
$AXP (+0,64%)
$FIX (-12,91%)
1010

4Mês·
Is a rise in prices a risk? 📈
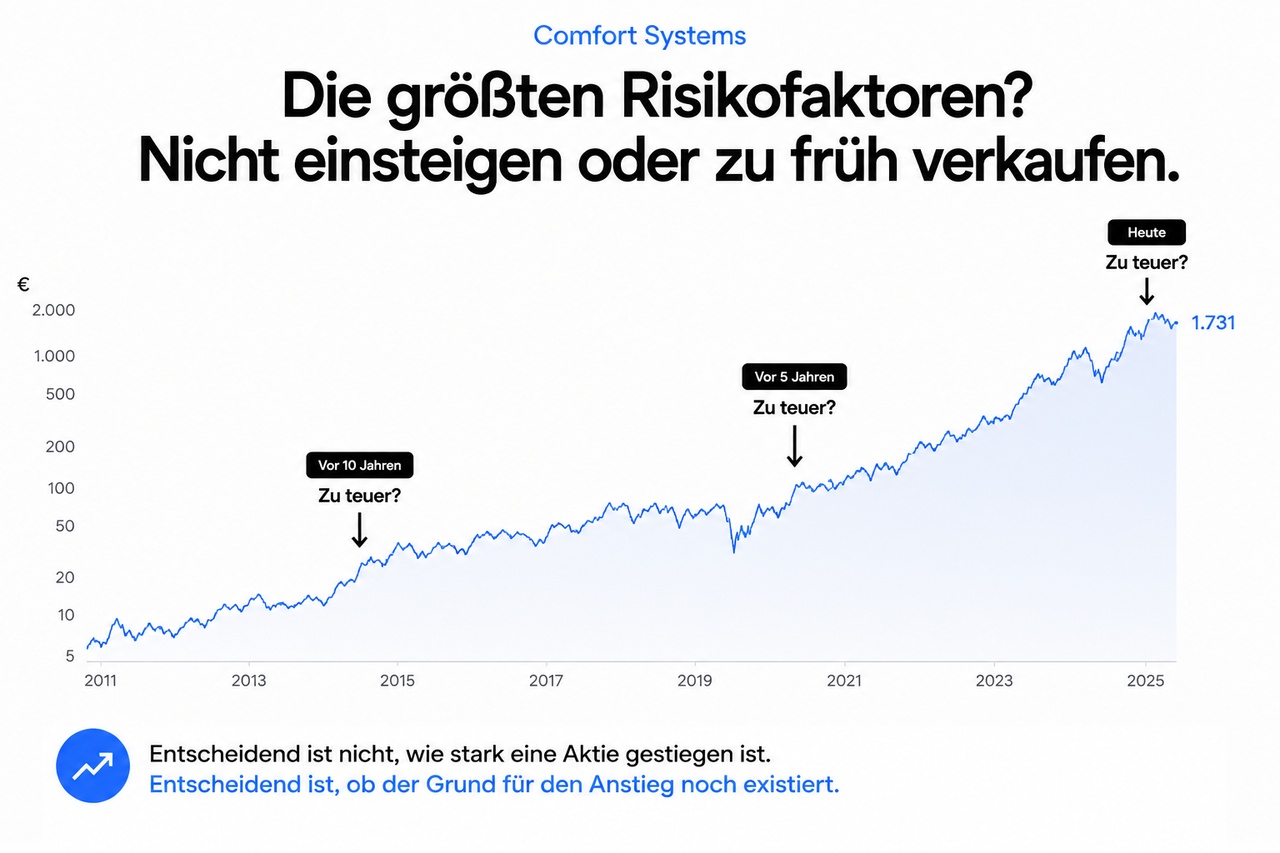
Comfort Systems $FIX (-12,91%) is a good example for me of why I don’t automatically view price increases as a risk . Many investors see a chart like this and think, “Too late. The stock has already risen too much.” I see this in comments on my posts, too.
I try to frame the question differently:
- Why has the stock gone up?
- And could that reason still exist in the future?
The stock market doesn’t value the past. It values the future. A rise in the stock price alone therefore says little about whether a stock is attractive or unattractive. What matters to me is whether the company continues to benefit from a structural trend or a relevant bottleneck.
That’s exactly why I focus on technologies, infrastructure, and bottlenecks every day. Some of them disappear after a short time. Others persist for a surprisingly long time.
In my view, Comfort Systems is an example of this. Quanta Services $PWR (-8,88%), Applied Materials $AMAT (-5,41%) or Monolithic Power Systems $MPWR (-8,82%) are as well. If you look back over the last 10 to 15 years, you won’t see a one-time event, but rather often a long phase of continuous value creation. Incidentally, Comfort Systems has risen by 2,445% over 5 years, 5,948% over 10 years, and 24,349% over 15 years.
Of course, this is just my personal perspective. Every investor has a different risk tolerance, different criteria, and a different investment horizon. I’m not claiming that my view is correct. I simply consider it an interesting perspective on the question of what risk actually means in the stock market.
That’s why Comfort Systems, Applied Materials, and Quanta Services are also part of my wikifolio CoreLimits, which focuses on established bottlenecks and stable companies.
3232
15 Comentários

I think you really have to distinguish carefully between different types of value. Are they just riding a wave right now—for example, a surge of several hundred percent in a few weeks or months—or is the company meeting a long-term need backed by a moat?
•
44
•4Mês·
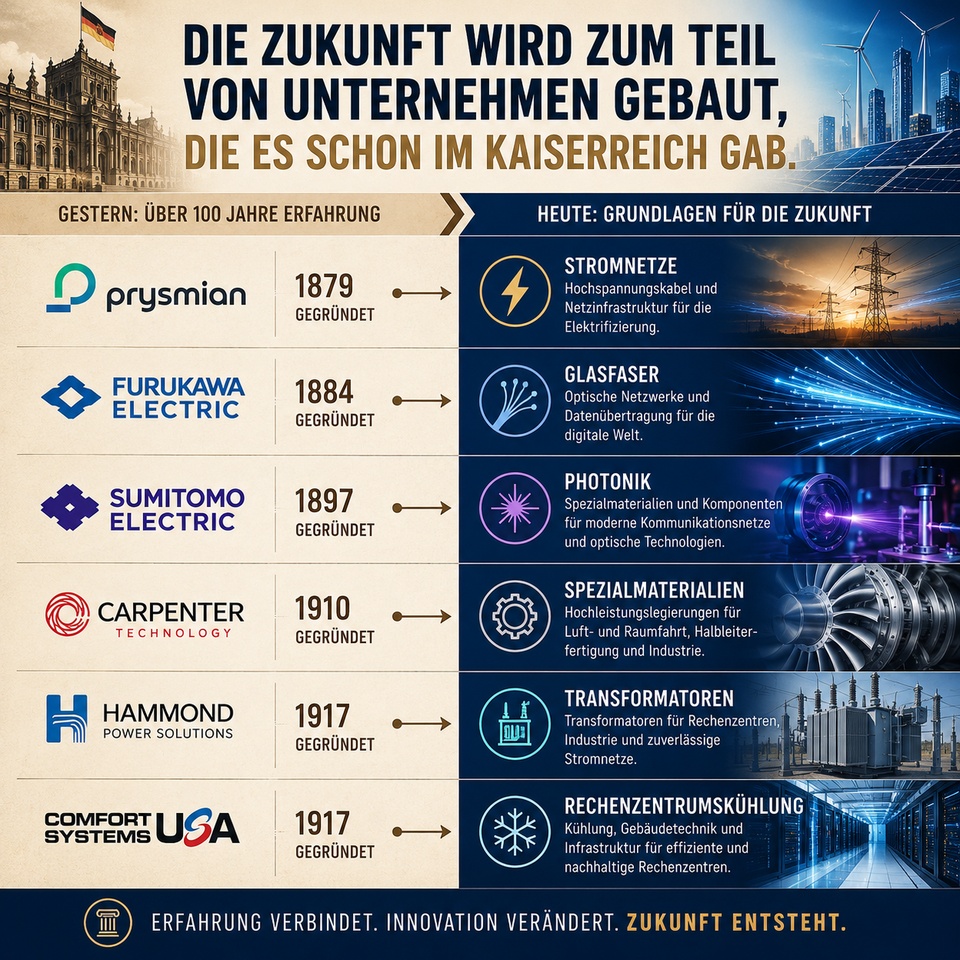
Did you know? The future is being shaped in part by companies that already existed during the German Empire.
When people talk about future technologies or next-gen technologies, the first thing that comes to mind is startups. In my research, however, I keep coming across companies that have been around for more than 100 years!
A few examples from my portfolio:
• Prysmian (1879)
$PRY (-7,34%)
Electric highways, high-voltage cables, and grid infrastructure for electrification.
• Furukawa Electric (1884)
$5801 (-11,32%)
Fiber optics, optical networks, and data transmission.
• Sumitomo Electric (1897)
$5802 (-5,78%)
Photonics, specialty materials, and components for modern communication networks.
• Carpenter Technology (1910) $CRS (-20,58%)
Specialty alloys for aerospace, semiconductor manufacturing, and high-performance systems.
• Hammond Power Solutions (1917)
$HPS.A (-6,35%)
Transformers for data centers, industry, and power grids.
• Comfort Systems USA (1917)
$FIX (-12,91%)
Cooling, building services, and infrastructure for modern data centers.
The more I delve into AI, energy, photonics, or data centers, the more often I come across companies like these.
New technologies can emerge within just a few years. The industrial infrastructure behind them often takes decades to develop.
That is precisely why it’s not just the companies making headlines that benefit from technological upheavals. Often, those who have been laying the groundwork for generations also benefit.
Another example is Caterpillar $CAT (-4,63%). The company was founded as early as 1925 and today supplies, among other things, the emergency power systems that play a key role in many data center projects.
3434
4 ComentáriosThat’s an interesting angle, Oliver! However, if you take a really close look at the history, there’s actually a rather curious fact hidden behind your phrase “there were in the Empire”:
Strictly speaking, only two companies on your list were actually founded during the Empire: Furukawa and Sumitomo. Prysmian was founded in Milan in 1879—but Lombardy had already seceded from the Austrian Empire 20 years earlier and had long since become part of the Kingdom of Italy (and the U.S. and Canadian companies were founded in republics and the British Empire, respectively). The paradox here is that the only true empire on your list (Japan) is, formally speaking, the only one still in existence anywhere in the world today! 😉
But setting historical geography aside: When it comes purely to the combination of over 100 years of tradition and the fundamental foundation for cutting-edge technologies of the future, there’s actually one very specific giant missing from your portfolio:
IBM $IBM (founded in 1911).
The company that’s building the invisible backbone for global enterprise AI today—and, above all, the actual hardware for tomorrow’s quantum computing—would fit perfectly into this lineup.
How do you view IBM compared to the other infrastructure stocks you mentioned?
•
11
•
Títulos em alta
Principais criadores desta semana
Dados tempo real da LSX · Dados financeiros e EOD da FactSet