After hitting the bull's eye last year with my annual preview for 2025, I'm sharing the preview for 2026 with you today.
20.01. On taking office a year ago, Trump organizes a pompous celebration under the motto "1 year Trump, 49 more ahead". He signs an executive order converting the constitution into a non-binding letter of recommendation.
23.01. At the World Economic Forum, Trump announces punitive tariffs for all Democratic-ruled states in the USA. The S&P500 falls by double digits.
25.01. After the Trump cronies have stocked up on shares, Trump announces an agreement with the Democratic-ruled states and a temporary suspension of the tariffs. The S&P500 rises.
27.01. A video of Trump from 23.01. is leaked on X (formerly Twitter). Lip readers are sure that Trump whispers to JD Vance in this video: "Unbelievable, the trick is still working".
28.01. Trump explains in an address to the nation that by "trick" he meant Tony Hawk's kickflip. Despite his advanced age, Tony Hawk is "still great" 🇺🇸. The USA cheers. U S A. U S A. U S A.
14.02. Merz and Bärbel Bas are spotted making out in a Berlin hipster bar. The DAX swings wildly in all directions.
17.02. Exclusive interview with Merz and Bas in Bild "Yes, it's love". The DAX throws up.
07.03. Surprisingly, Musk himself becomes the first person to fly to Mars. Once there, he renames Mars X. And SpaceX. And himself. He also buys the letter X for 27,964 $TSLA (-3,46%) shares, which from now on can only be used in exchange for subscription fees. Xavier Naidoo destroys his aluminum hat in anger.
08.03. X realizes that his X rocket no longer has enough fuel to fly from X back to Earth. X then sends 50 women with X to X and writes on X that he will create a new colony on X and that he no longer needs all the bullshit on Earth. Tesla shares fall to three fifty. Trading with $DOGE (-0,03%) is suspended.
10.03. Nvidia buys Tesla. $NVDA (-0,93%) falls.
21.03. Holding hands, Merz and Bas announce the "summer of reforms". The DAX falls to -7 points.
01.04. During a flyover, an airplane discovers a shiny golden hut in the middle of the Amazon region. An April Fool's joke?
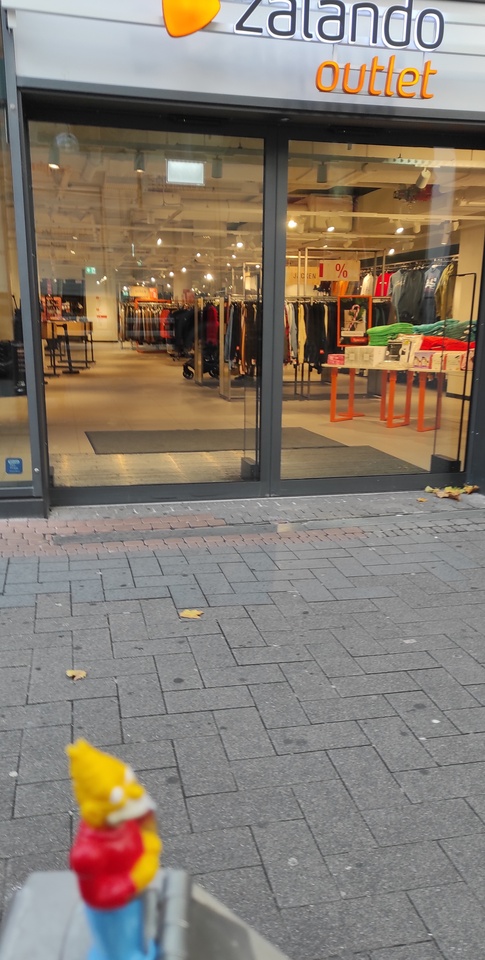
11.04. Nvidia buys $ZAL (+0,41%) (Zalando). Jen-Hsun Huang launches his own leather jacket collection. The fashion industry is beside itself with excitement. Nvidia with new ATH.
29.04. As predicted by @DonkeyInvestor predicted, reaches $BTC (-0%) reaches 50k after a boring, wave-like downward movement. @stefan_21 spends @DonkeyInvestor buys a beer.
14.05. A team of scientists has approached the golden hut in the Amazon. The hut is actually made of pure gold. It is inhabited by an oddball native who claims to be able to make gold from wood. The price of gold falls by 20%. Bitcoin rises to 100k.
16.05. getquin launches a new "Wealth Family" subscription. For just €500 a year, a whole family can enjoy the Wealth features. In addition, the deposits can be viewed among each other and child-friendly advertising with Checker Tobi is played.
20.05. Wealth Family is a success. However, the divorce rate among getquin users rises sharply, as many realize that their partner has leveraged the house.
25.05. A sensation. The Native American was not lying. He can produce gold by the kilogram from tiny amounts of wood. Scientists from all over the world are trying to understand how he does it. Gold falls to 0. Bitcoin rises to 150k - as predicted by @stefan_21 predicted.
10.06. In the run-up to the World Cup, Trump surprisingly announces punitive tariffs on goals scored by foreign teams. Every goal scored against the USA is subject to a tariff of 2 goals for the USA. Infantino gets a gold watch and nods his approval.
14.06. Out of anger over the soccer tariffs, a French customs official surnamed Zidane refuses Trump entry to the G7 summit. He headbutts Trump back into Air Force One.
14.06. Trump is furious. While still on the plane, he posts that he will leave the G7 and take over the chairmanship of the BRICS states. The S&P500 falls. Emerging markets rise.
19.07. The USA becomes soccer world champion for the first time. The last Italian witnesses to Italy's first World Cup title in 1934 applaud the well-deserved victory.
21.07. It is still not clear how the indigenous people manage to produce gold from wood. Gold regains some of its value.
04.08. Peter Schiff shoots the Native American, who takes his golden secret to his grave. Gold rises again to 2k. Bitcoin falls to 36k - as predicted by @Epi predicted.
20.08. In the middle of the summer slump, Olaf Scholz opens an escape room in a Berlin savings bank. Unfortunately, he has forgotten the exit.
20.09. In the election in Berlin, Trump is surprisingly elected Chancellor with 32 million votes. Something's not right. Geez Berlin, another election gone wrong.
03.10. On German Unity Day, Bas and Merz announce the result of the summer of reforms:
Private health insurance companies and all statutory health insurance funds will be merged into one fund. The share price of $ALV (+0,7%) (Allianz) falls.
With immediate effect, pension contributions are paid into a sovereign wealth fund that replicates the wikifolio of @Epi replicates. Olaf Scholz is angry, but immediately forgets why.
Every German has more than one vote in future elections. The number of votes corresponds to the remaining life expectancy in years.
Under the motto "performance must be worthwhile", inheritance tax is increased and wage tax is reduced by the same amount.
Nobody expected this. The DAX rises to a new ATH.
20.10. @DonkeyInvestor celebrates its birthday. Like every year, the party of the year and the whole of getquin is invited. All of getquin? No, @DividendenWaschbaer must stay outside.
03.11. getquin announces a new subscription: getquin Bugfree. For just 1,000 euros a year, subscribers get all bug fixes for free. Unfortunately, there are no more bug fixes for everyone else.
17.11. The BRICS countries, under the leadership of Trump, announce that they will use the Trump Coin $TRUMP (+0,05%) as a currency.
02.12. Trump pulls an exit scam on his own coin. All BRICS states go bankrupt. The USA barely survives due to the strategic Bitcoin reserve.
03.12. Trump announces that the break-up of the BRICS states has been planned for a long time and has always been his goal. Zidane is awarded the Medal of Freedom.
24.12. A warm light appears over all major American cities and over Grünheide. A Christmas miracle?
25.12. The lights turn out to be gigantic spaceships in the shape of an X. The S&P500 falls.
26.12. The spaceships are commanded by X, who has returned from X. He wants to take over the USA. He wants to take over the USA. And the mayoralty of Grünheide.
31.12. The USA, now called USX, surrenders without a fight. X is the new god-king of the USX for life. The S&P500 no longer cares about anything. 2027 will be wild.
What are your tips for 2026?
You can find the preview for 2025 here: https://getqu.in/MBdhb5/