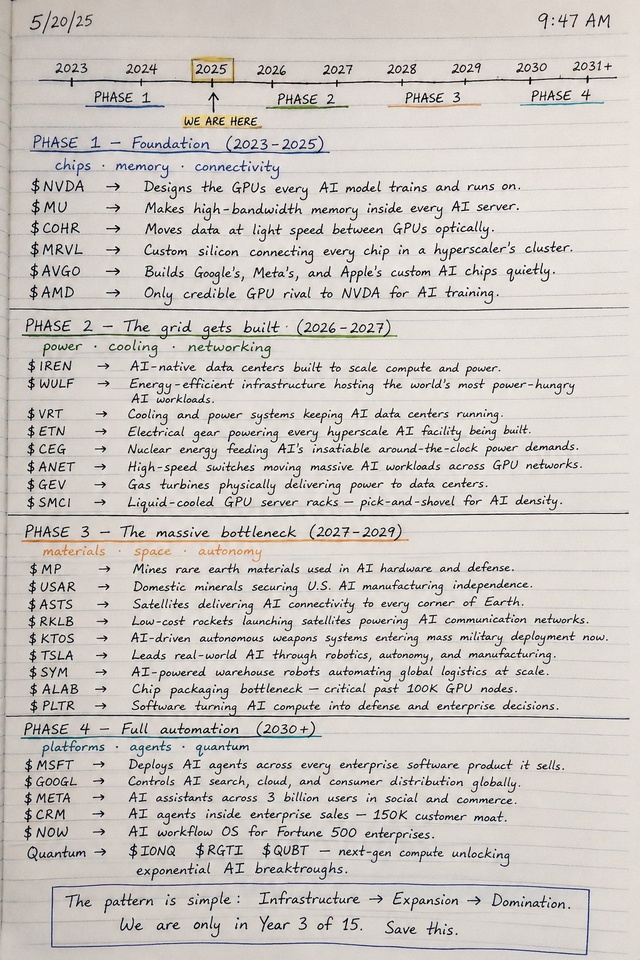
You'd make millions by knowing whats coming and buying dips until 2030+
Pay attention, we just finished Phase 1 2023-2025
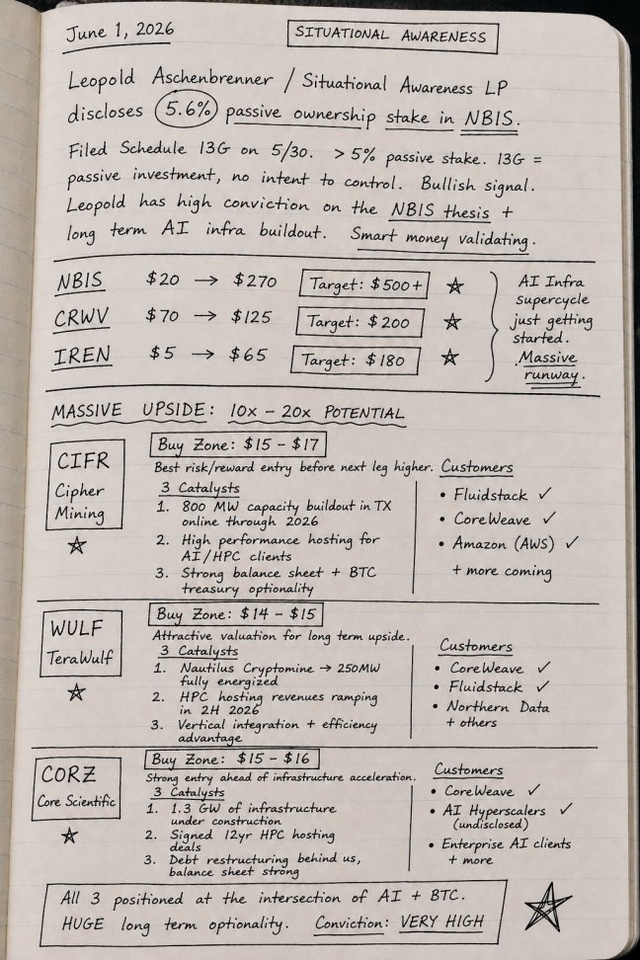
chips · memory · connectivity
$NVDA (+0,19%) → Designs the GPUs every AI model trains and runs on.
$MU (+0,26%) → Makes high-bandwidth memory inside every AI server.
$COHR (+5,89%) → Moves data at light speed between GPUs optically.
$MRVL (+1,8%) → Custom silicon connecting every chip in a hyperscaler's cluster.
$AVGO (-0,49%) → Builds Google's, Meta's, and Apple's custom AI chips quietly.
$AMD (+5,54%) → Only credible GPU rival to NVDA for AI training.
PHASE 2 — The grid gets built (2026–2027)
power · cooling · networking
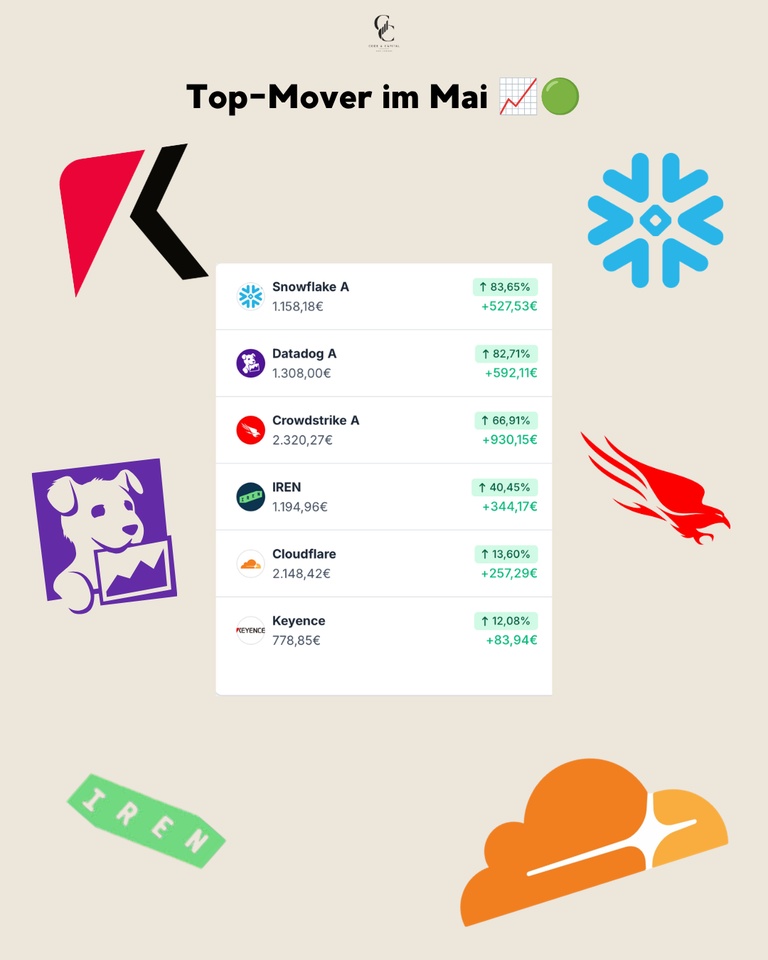
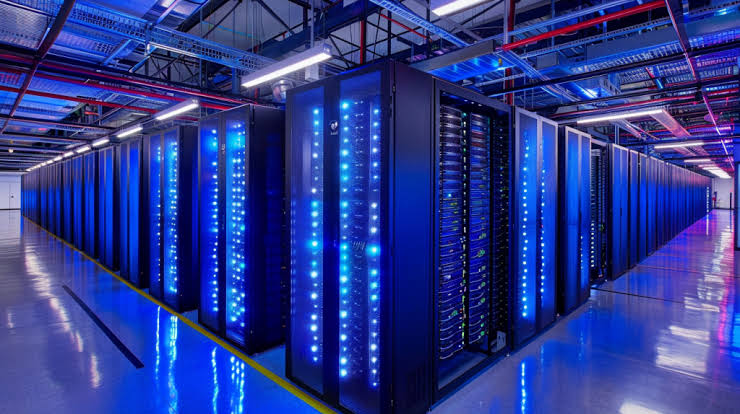
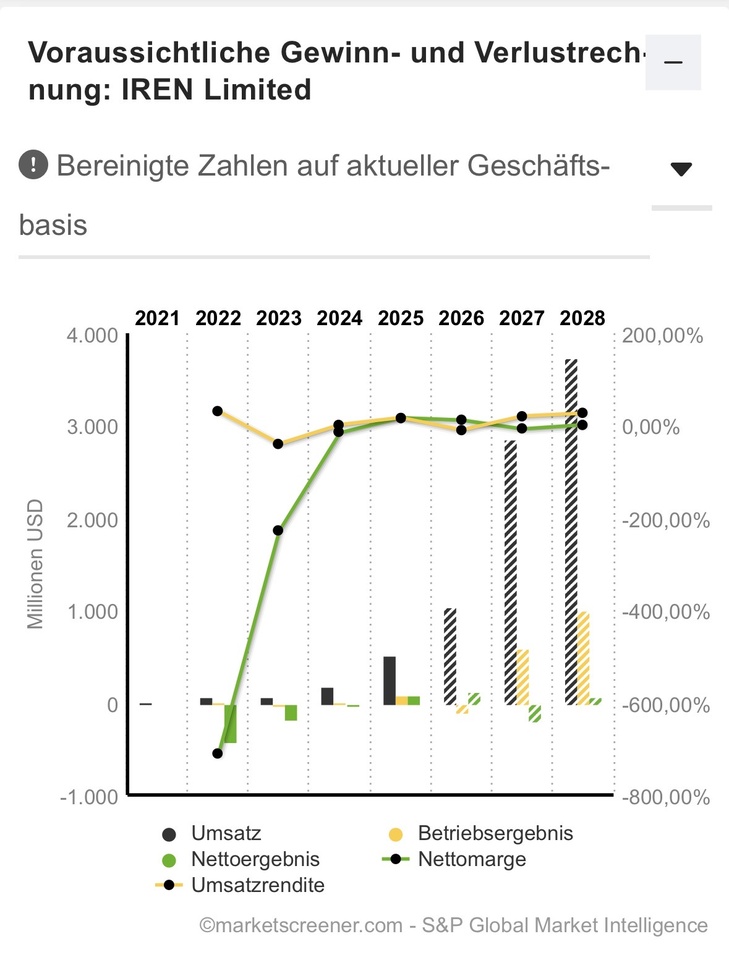
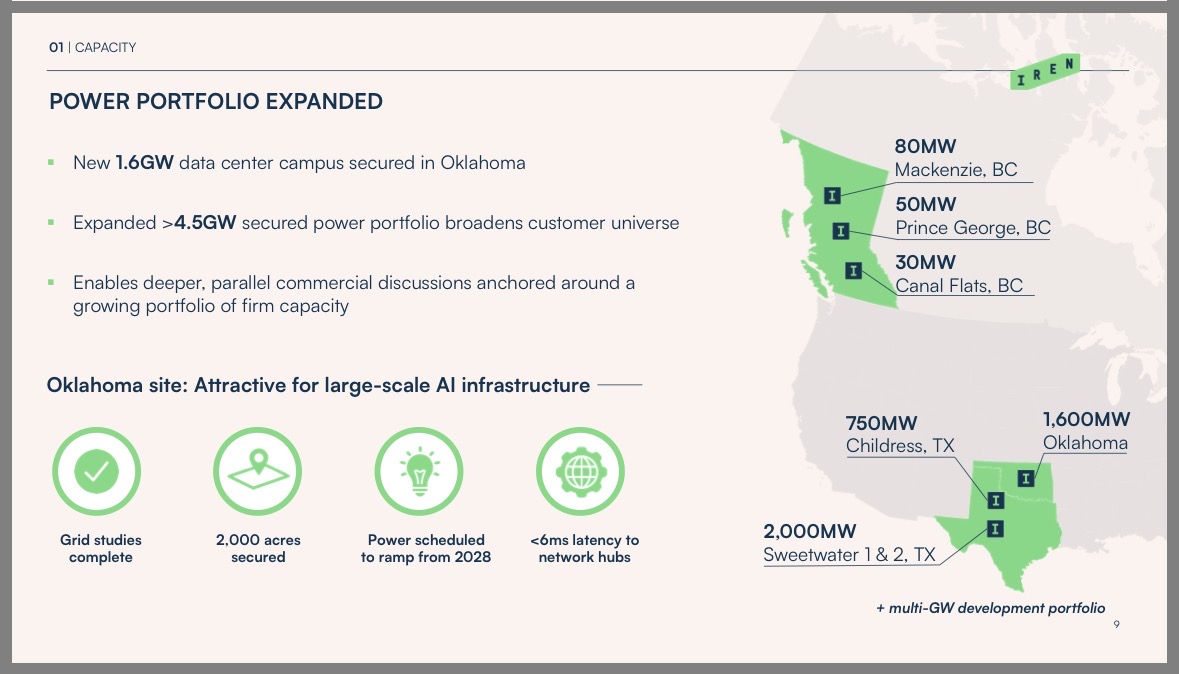
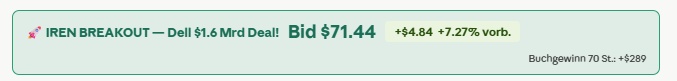
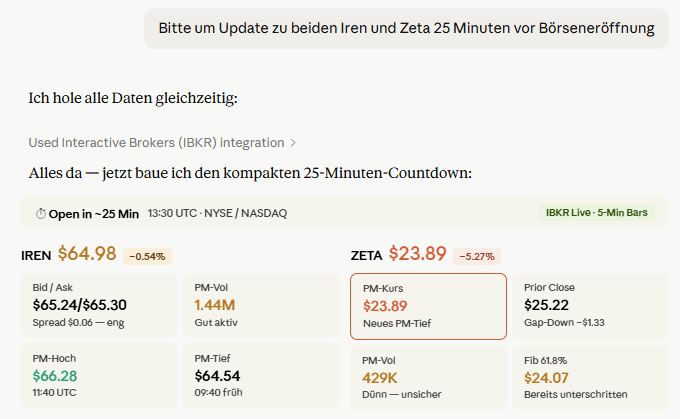
$IREN (+5%) → AI-native data centers built to scale compute and power.
$WULF (+3,08%) → Energy-efficient infrastructure hosting the world's most power-hungry AI workloads.
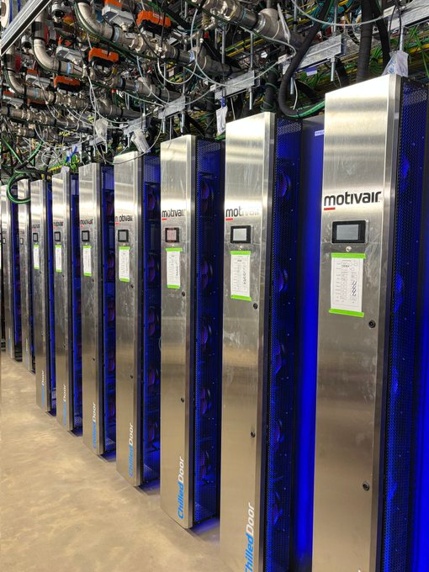
$VRT → Cooling and power systems keeping AI data centers running.
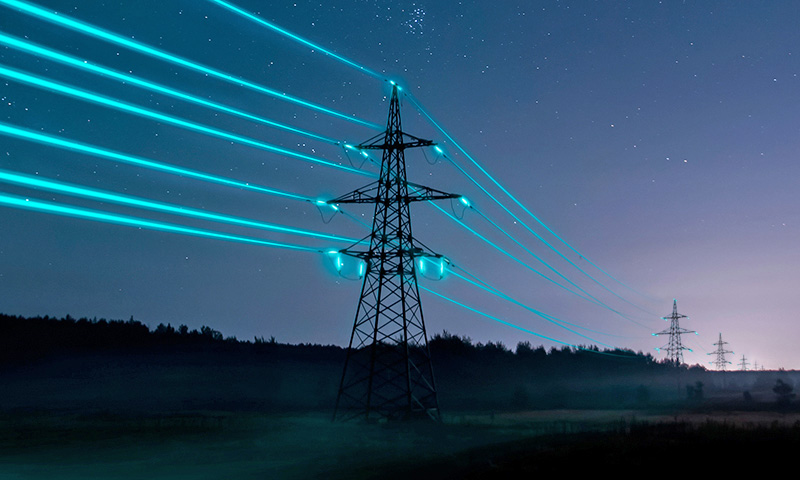
$ETN → Electrical gear powering every hyperscale AI facility being built.
$CEG → Nuclear energy feeding AI's insatiable around-the-clock power demands.
$ANET → High-speed switches moving massive AI workloads across GPU networks.
$GEV → Gas turbines physically delivering power to data centers.
$SMCI → Liquid-cooled GPU server racks — pick-and-shovel for AI density.
PHASE 3 — The massive bottleneck (2027–2029)
materials · space · autonomy
$MP → Mines rare earth materials used in AI hardware and defense.
$USAR → Domestic minerals securing U.S. AI manufacturing independence.
$ASTS (-17,22%) → Satellites delivering AI connectivity to every corner of Earth.
$RKLB (-12,68%) → Low-cost rockets launching satellites powering AI communication networks.
$KTOS → AI-driven autonomous weapons systems entering mass military deployment now.
$TSLA (+1,99%) → Leads real-world AI through robotics, autonomy, and manufacturing.
$SYM (-0%) → AI-powered warehouse robots automating global logistics at scale.
$ALAB (+1,27%) → Chip packaging bottleneck — critical past 100K GPU nodes.
$PLTR (-2,58%) → Software turning AI compute into defense and enterprise decisions.
PHASE 4 — Full automation (2030+)
platforms · agents · quantum
$MSFT (-0,15%) → Deploys AI agents across every enterprise software product it sells.
$GOOGL (+0,55%) → Controls AI search, cloud, and consumer distribution globally.
$META (-0,59%) → AI assistants across 3 billion users in social and commerce.
$CRM (-0,51%) → AI agents inside enterprise sales — 150K customer moat.
$NOW (-1,4%) → AI workflow OS for Fortune 500 enterprises.
Quantum
$IONQ $RGTI $QUBT — next-gen compute unlocking exponential AI breakthroughs.