May was dominated by strong figures and a massive rally in the tech and cloud sector. While April was still characterized by a general recovery, excellent quarterly figures and the unbroken AI boom continued to fuel the markets in May. The Nasdaq in particular benefited greatly from this and reached new highs. Even though volatility was noticeable in isolated cases, investors made strong gains in growth stocks.
My portfolio was able to take advantage of this strong momentum and achieve an outstanding performance, but was narrowly beaten by the extremely strong performance of the Nasdaq 100:
📊 Monthly performance: +9,33%
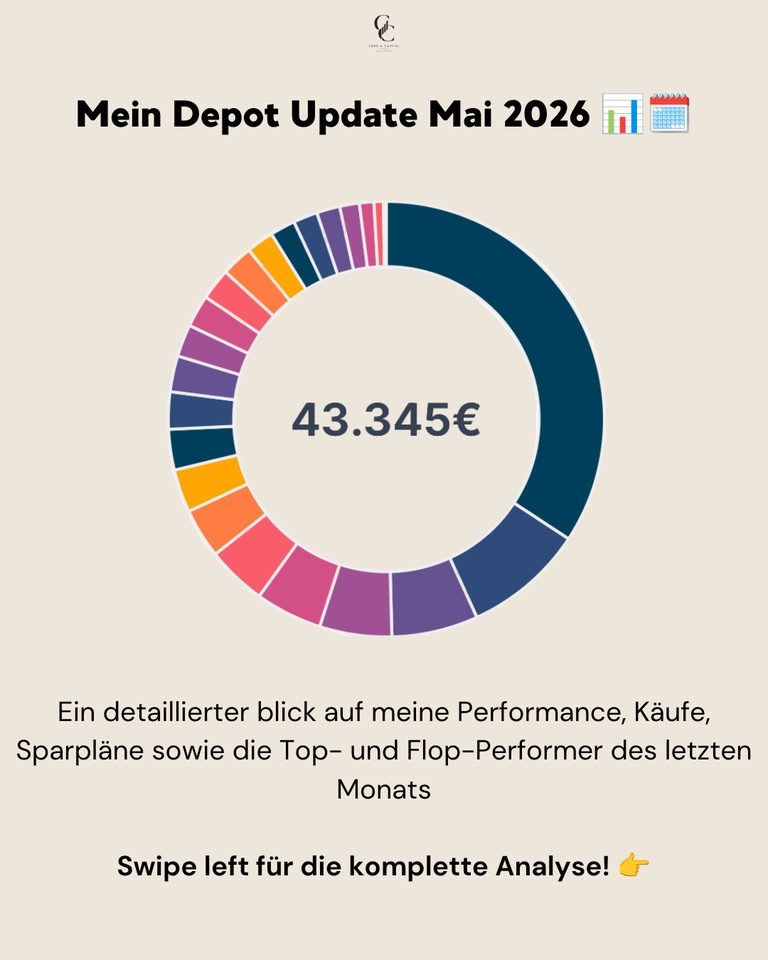
📊 Portfolio value: ~43.345 €
📊 Performance max. (06.01.2022): +43,84%
📊 Performance YTD: ~+10,44%
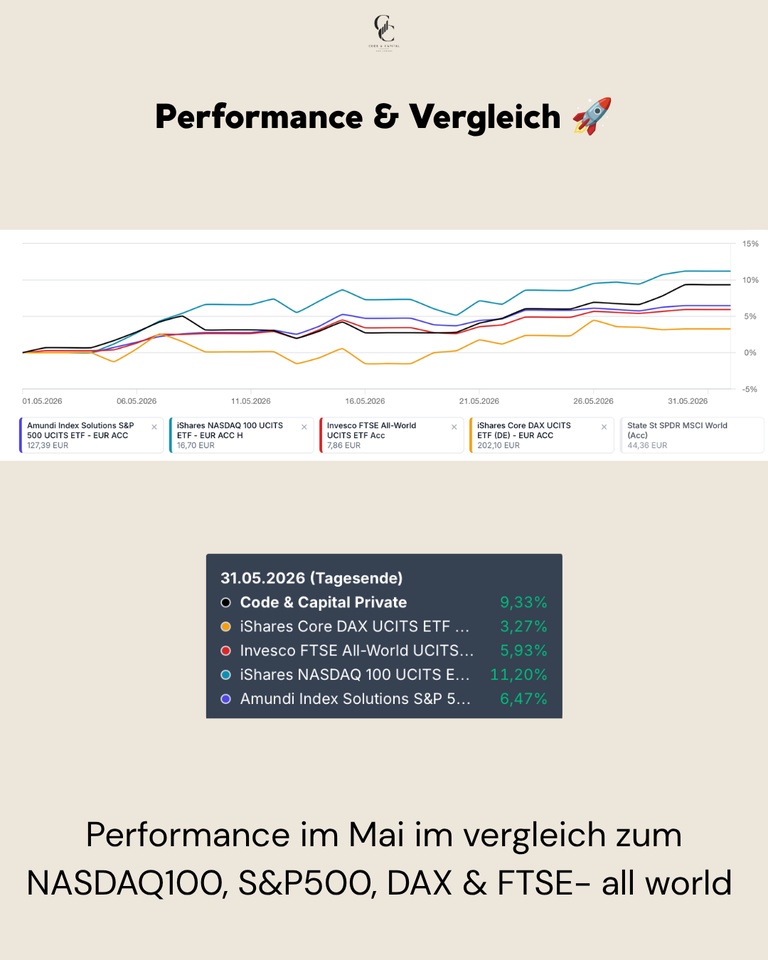
Performance & comparison 🚀
Performance in May was exceptionally strong, driven by my high weighting in US tech stocks. While European indices such as the DAX made rather moderate gains, US stocks dominated the action. My portfolio did extremely well with a whopping gain of over 8 % and clearly outperformed the broad market.
Performance in comparison (01.05.-31.05.2026):
My portfolio: +9,33%
NASDAQ 100: +11,20%
S&P 500: +6,47%
FTSE All-World: +5,93%
DAX: +3,27%
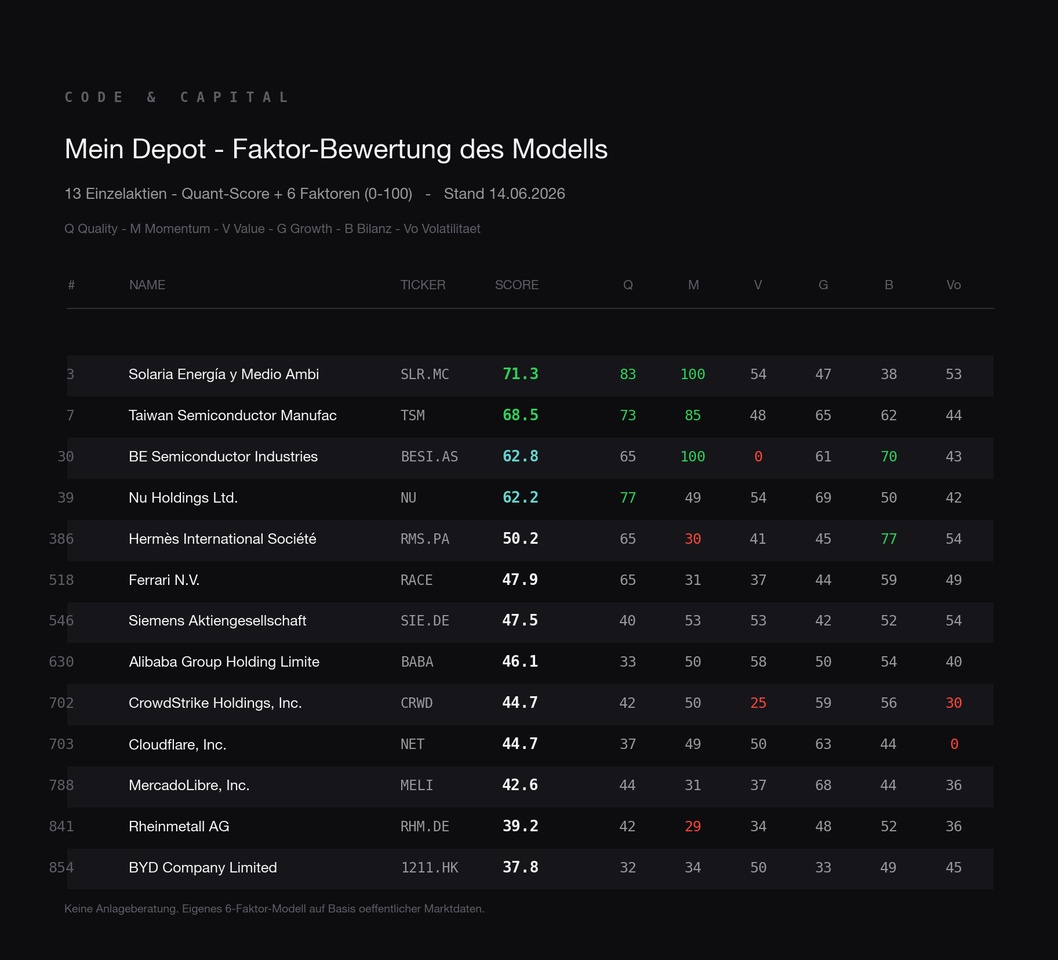
Buying, selling & allocation 💶
In the month of May, € 300.00 flowed into the MSCI ACWI USD (Acc)
$ACWI and € 50.00 in the MSCI World Small Cap
$WSML (-0,49%). In addition, smaller savings plan tranches were invested in Solaria Energia
$SLR (-2,75%) (150,30 €), Rheinmetall $RHM (+2,1%) (14,00 €), Ferrari
$RACE (-1,47%) (€6.00) and Hermes
$RMS (-0,78%) (€ 3.01) were invested.
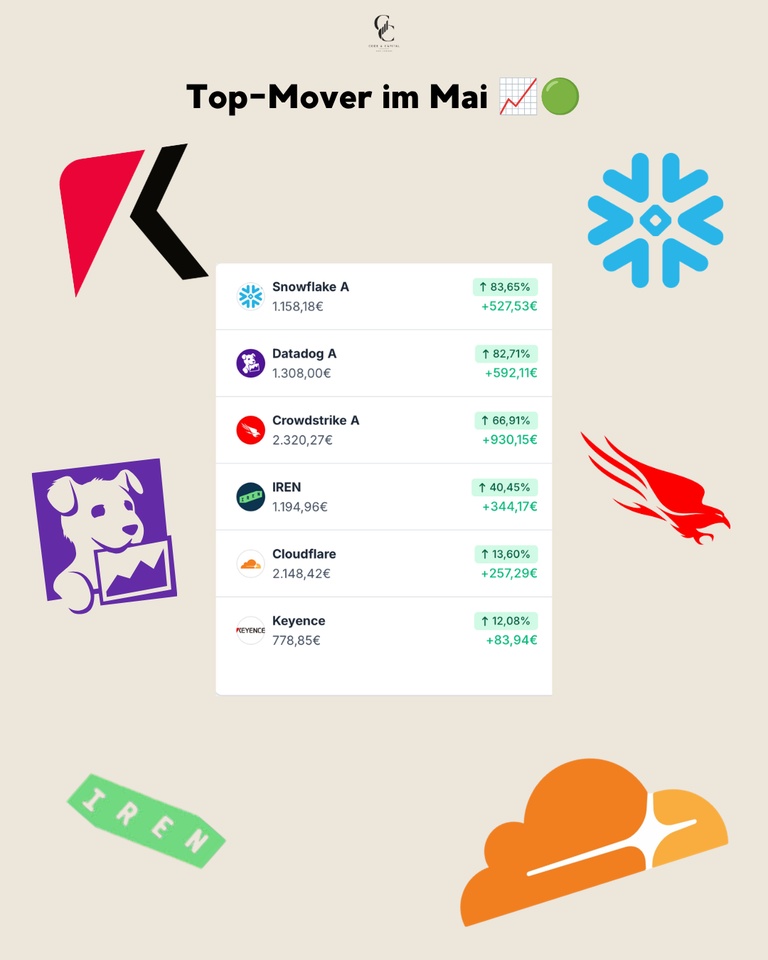
Top movers in May 🟢
The list of winners in May is led by outstanding developments in the cloud and cybersecurity sector - an absolute feast for tech investors.
The absolute frontrunner was $SNOW (-0,64%) with a veritable price explosion of +83,65% (+€ 527.53), closely followed by $DDOG (-1,74%) with +82,71% (+592,11 €). Both values showed incredible momentum. Also $CRWD (-0,42%) was convincing across the board and delivered a strong +66,91% (+€ 930.15), which was the biggest gain in the portfolio in absolute terms. $IREN (-3,87%) continued its strong trend and recorded a further +40,45% (+344,17 €). The outstanding tech performance was rounded off by $NET (+1,73%) with a solid +13,60% (+€ 257.29), while Keyence also $6861 (-2,32%) with +12,08% (+€83.94) also developed extremely positively.
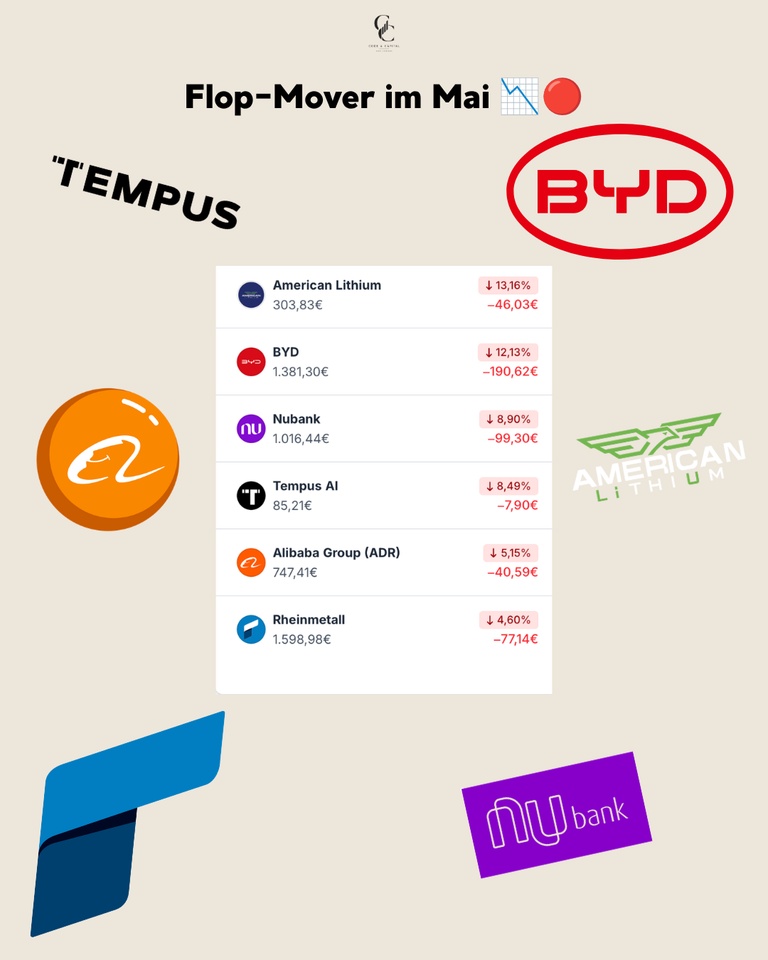
Flop movers in May 🔴
Despite the generally extremely strong sentiment, there were also some stocks that consolidated or showed weakness in May.
American Lithium was the worst performer, falling by -13,16% (-46.03 €), still unable to find a bottom in the current market environment. With $1211 (-2,01%) the minus of -12,13% (€ -190.62) was due to falling EV sales and the ongoing price war in China. $NU (-1,33%) After the strong previous months, the share price fell by -8,90% (-99.30 €) after the strong previous months. Also $TEM (-1,8%) also recorded a slight setback of -8,49% (-7.90 €), similar to $BABA (-2,24%) with -5,15% (-40,59 €). $RHM (+2,1%) also lost ground and lost -4,60% (-77.14 €), indicating further profit-taking in the defense sector.
Conclusion 💡
May was an outstanding month that impressively demonstrated how much a targeted positioning in the tech and cloud sector can pay off.
❓ Question for the community
This was my month in numbers, what was your best buy in May? Which stock surprised you the most?
👇 Write it in the comments!
➡️ Follow @codeandcapital for transparent portfolio updates!
🔗 Link in bio: Wikifolio, Getquin & Parqet Portfolio
🗞️ Newsletter: codeandcapitalquant.beehiiv.com