
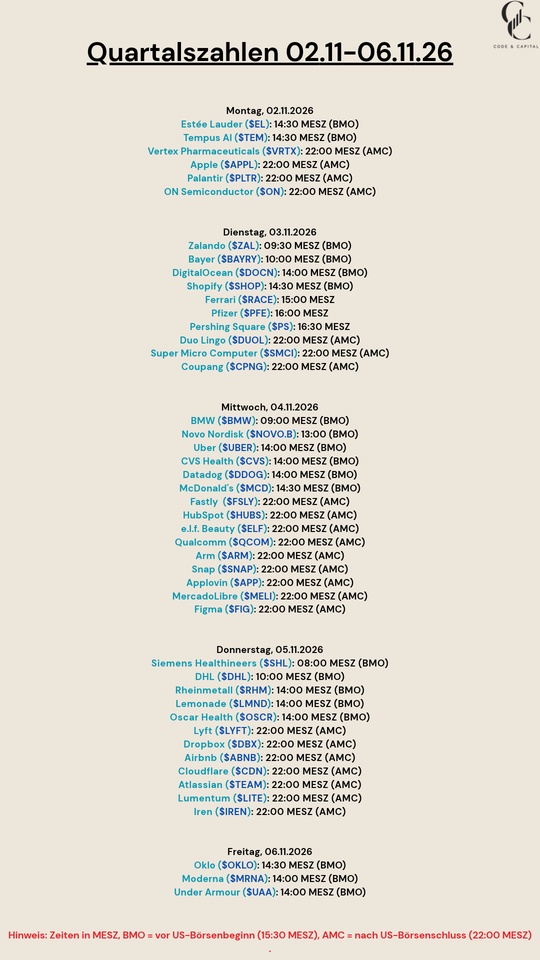
$EL (+2,78%)
$TEM (-5,74%)
$VRTX (+1,64%)
$AAPL (-1,58%)
$PLTR (-5,23%)
$ON (-2,2%)
$ZAL (-0,52%)
$BAYN (+5,27%)
$DOCN (-5,9%)
$SHOP (-4,87%)
$RACE (-1,38%)
$PFE (+1,26%)
$PS (-6,99%)
$DUOL
$SMCI (-1,07%)
$CPNG (-0,37%)
$BMW (-0,05%)
$NOVO B (+2,56%)
$UBER (+0,57%)
$CVS (-0,26%)
$DDOG (-8,43%)
$MCD (+0,02%)
$FSLY (-6,41%)
$HUBS (-0,47%)
$ELF (-0,64%)
$QCOM (-7,5%)
$ARM (-2,74%)
$SNAP (-3,64%)
$APP (-9,25%)
$MELI (-1,4%)
$FIG (-1,23%)
$SHL (-0,43%)
$DHL (-0,71%)
$RHM (-2,1%)
$LMND (-5,38%)
$OSCR (-1,31%)
$LYFT (-1,37%)
$DBX (+0,03%)
$ABNB (-1,92%)
$NET (-6,48%)
$TEAM (-3,76%)
$LITE (-5,35%)
$IREN (-4,1%)
$OKLO
$MRNA (-0,09%)
$UAA (-0,89%)

Applovin
Azione
Azione
Ticker: APP
APP
Price
Discussione su APP
Messaggi
11913H·
Quarterly Results Nov. 2–Nov. 6, 26
1010

6G·
Opinions on AppLovin
I’ve been looking for this stock for a while now, I think it will benefit from AI in the future like others stocks, software stock for example.
Fundamentals keep growing but the stock keeps going down, I think it’s a nice setup.
What do you guys think? Opportunity or a pass? $APP (-9,25%) is almost -60% YTD
Thanks
11
5 Commenti
Balance seeker@Balance_seeker
6G
•
11
•Visualizza tutti 4 ulteriori risposte

2Settimana·
A hard lesson
I'm tired of waiting it out. $APP (-9,25%) Sold and $VALU (-1,11%) invested. -59%, but fortunately only 0.3% of the portfolio. All small positions are being closed.
1717
3 CommentiWhy close it, the fondamentals didnt change
•
11
•4Settimana·
70K Milestone🥳
In February 2025, I pulled the plug. After my Sparkasse funds had barely moved in 4–5 years, I bought my very first stock with just a few euros and zero prior knowledge. It was the best decision ever!
Since then, I’ve been consistently investing €1,300 every month and selecting my own positions entirely on my own.
My milestones (all reached well ahead of schedule!):
🎯 25K: June 25
🎯 40K: Oct. 25
🎯 60K: May ’26
🏆 Current: €70,000 in September ’26!
I’ve now earned over €15,000 in pure returns, and the feeling is simply indescribable. My goal for the end of this year (12/26) was 70K—I’ve already surpassed that. Let’s see if I can hit 80K before the year is out!
My portfolio:
I currently hold 25 positions (24 individual stocks + Bitcoin). Every month, I decide anew how to allocate the €1,300 among these holdings. My ultimate goal: financial freedom.
Question for you:
1️⃣ What do you think of a 100% stock-picking strategy with 24 stocks? Does it become too much work once you hit 100K, or do you stick with it?
2️⃣ I’m thinking about adding a new position in $APP (-9,25%) . What’s your take on the company right now?
Looking forward to your feedback! 👇 #Milestone #StockPicking #FinancialFreedom #ByeByeSparkasse
24Posizioni
71.168,18 €
29,15%
1616
6 Commenti
4Settimana
It seems to be working, so why change anything? The only question is how you'll react when things aren't going so well. That's why I'm glad I have a 60% allocation to ETFs.
•
33
•4Settimana·
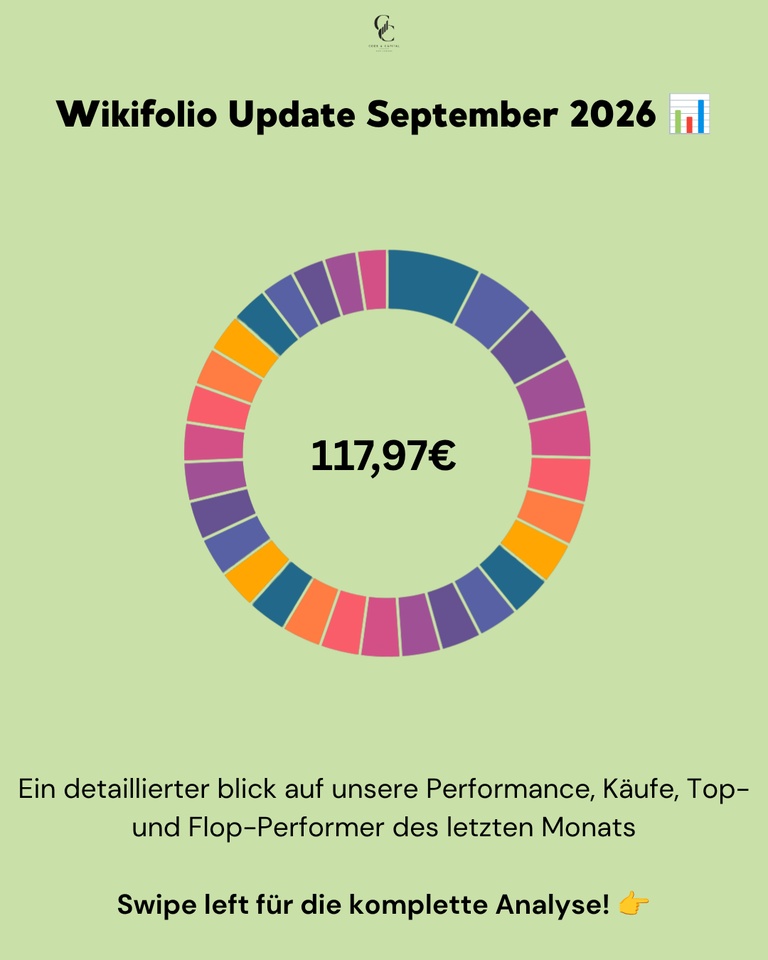
📊 Wikifolio Update September 2026: up 1.03%, tech stocks up, mining stocks down, and 18 of 30 positions swapped on October 1
In August, gold mines were the market's top performers. In September, they were the most expensive. Fresnillo
$FRES (-2,09%) down 15 percent, Micron
$MU (-1,97%) up 17. At the end of the month, the Wikifolio was up 1.03 percent, and one day later, I swapped out 18 of 30 positions.
September was all about interest rates and oil. Brent rose above $100 in the second week and, following a Saudi pipeline outage, briefly hit $110. U.S. inflation stood at 3.4 percent in August. On September 16, the Fed raised the benchmark interest rate by a quarter point to 3.75 to 4.00 percent, for the first time since July 2023. The 10-year U.S. yield subsequently climbed to 5.19 percent, a level last seen in 2007. This hardly bothered tech stocks. The Nasdaq hit a record high on September 21, and AMD has been worth one trillion dollars ever since. The situation was different in Europe. German inflation jumped to 3.3 percent, and the DAX lost about four percent over the month.
📊 Monthly performance: +1.03%
📊 Price as of September 30: €117.97
📊 Largest loss since inception: −14.6%
📊 Max performance: +18% (since March 13, 26)
Next rebalancing: Early January 2027
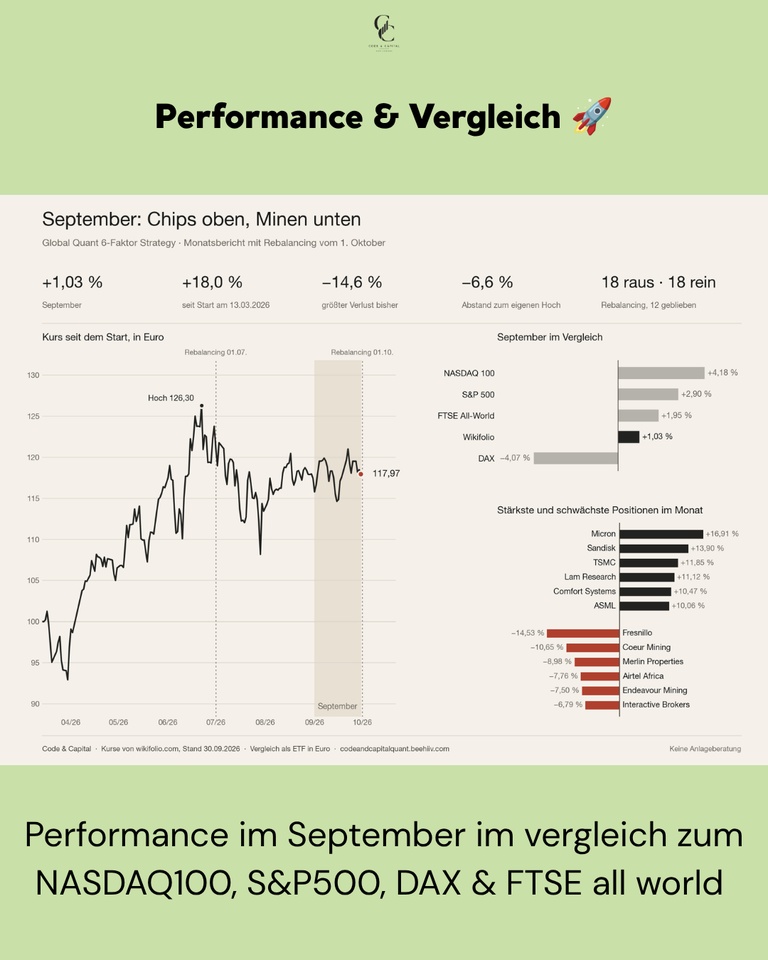
Performance & Comparison 🚀
The U.S. indices posted clear gains when calculated in euros, with the Nasdaq leading the way. The Wikifolio did not keep pace. It lagged behind the Nasdaq, S&P 500, and FTSE All-World, and outperformed only the DAX.
Performance Comparison (September 1–30, 2026, end of day):
Global Quant 6-Factor: +1.03%
NASDAQ 100: +4.18%
S&P 500: +2.90%
FTSE All-World: +1.95%
DAX: −4.07%
You can see what caused this in the two lists below. Tech stocks delivered, while mining stocks and a few individual stocks ate up a good chunk of those gains.
Purchases & Sales 💶
None in September itself. The model trades only on four dates per year, and the third was on October 1. What happened then is detailed in its own section below.
Top Movers in September 🟢
The month belonged to semiconductors and memory stocks. Midway through the month, Intel’s CEO said the company could currently only meet about half of the demand for processors. After that, the entire industry picked up steam. Micron
$MU (-1,97%) topped the list with +16.91%, followed by SanDisk
$SNDK (-10,82%) at +13.90% and TSMC
$2330 at +11.85%. Lam Research
$LRCX (-2,25%) rose +11.12%, ASML
$ASML (-4,98%) +10.06%. In between is Comfort Systems $FIX (-2,72%) , a stock that has nothing to do with chips, up 10.47%. In August, Comfort Systems was still among the losers.
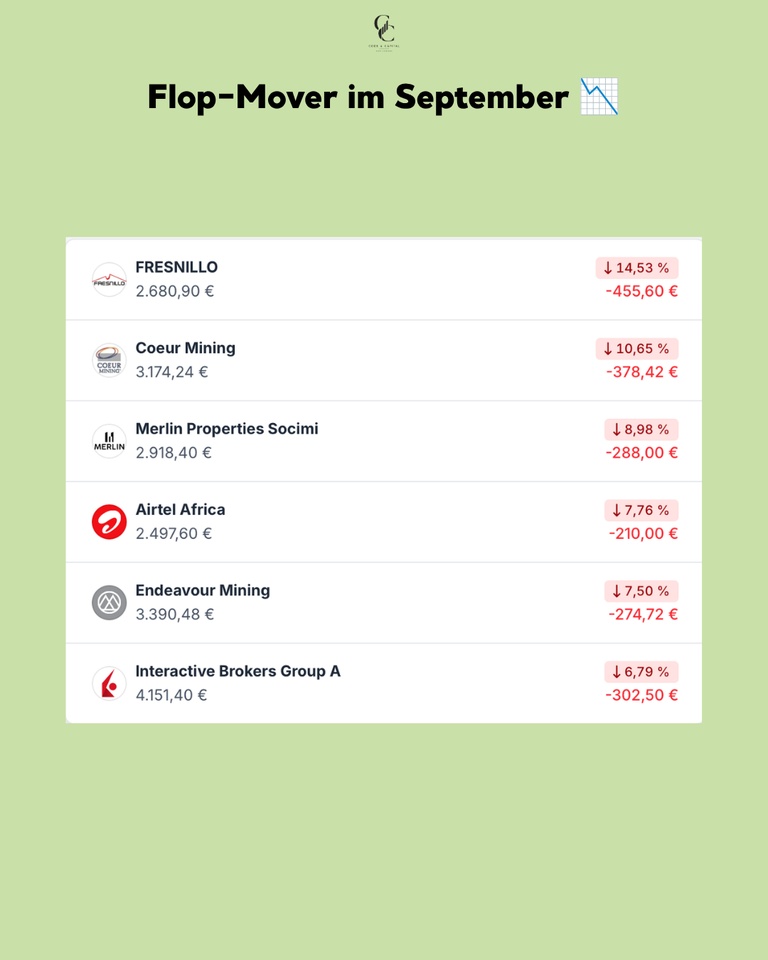
September’s Big Losers 🔴
Gold and silver declined in September, with silver falling much more sharply. Rising yields and a stronger dollar weighed on prices. Mining stocks followed suit. Fresnillo
$FRES (-2,09%) lost −14.53%, Coeur Mining
$CDE (-6%) −10.65%, and Endeavour Mining $EDV (-6,09%) -7.50%. In August, all three were still on the other list with gains of over 25 percent. Merlin Properties fell −8.98%, Airtel Africa
$AAF (-5,69%) down 7.76%, and Interactive Brokers
$IBKR (-4,23%) fell by 6.79%.
Rebalancing on October 1 🔄
On October 1, the third rebalancing since the start took place. I swapped out 18 of 30 positions—more than ever before. In July, it was nine.
All nine banks are out: Bankinter
$BKT (-1,29%) , CaixaBank
$CABK (+0,52%) , BBVA
$BBVA (-4,34%) , UniCredit
$UCG (-1,37%) , BPER
$BPE (-1,09%) , Monte dei Paschi $BMPS (-1,19%) , Banca Mediolanum
$BMED (-0,95%) , Swedbank$SWED A (-0,41%) and HSBC
$HSBA (-2,53%) . In addition, Interactive Brokers $IBKR (-4,23%) , Antofagasta $ANTO (-4,64%) , Coeur Mining
$CDE (-6%) , AppLovin
$APP (-9,25%) , Airtel Africa
$AAF (-5,69%) , Merlin Properties and Solaria
$SLR (-5,11%) . Investor AB
$INVE B (+1,93%) and Pershing Square
$PSH (-1,53%) are also no longer in the portfolio. So four of the six underperformers listed above are no longer in the portfolio.
Six stocks from the healthcare sector were added: Eli Lilly
$LLY (+2,49%) , Bristol-Myers
Squibb
$BMY (+2%) , Vertex $VRTX , Incyte
$INCY (+3,25%) , Illumina
$ILMN (-6,74%) and WuXi AppTec
$603259 . Five are from the semiconductor and storage sectors: Seagate
$STX (-4,94%) , Marvell
$MRVL (-5,75%) , Applied
Materials
$AMAT (-4,6%), Teradyne
$TER (-4,38%) and KLA
$KLAC (-3,2%) . The rest is split among Fortinet
$FTNT (-0,99%) , CF Industries
$CF (+5,18%) , Marathon Petroleum
$MPC (+3,03%) , APA
$APA (+2,8%) , Pop Mart $9992 (+3,74%) , Hong Kong Exchanges
$388 (+0,62%) and Lion Finance
$BGEO (-5,54%) .
Twelve remain: SanDisk, Micron, Western Digital, Nvidia, Lam Research, TSMC, ASML, Alphabet, Comfort Systems, Fresnillo, Endeavour and Newmont. All six of September’s top movers are included.
Two names stand out. Applied Materials and KLA I sold on July 1, up 92 and a gain of 90 percent. Now both are back in my portfolio. The model doesn’t remember what it has sold in the past. It only looks at where a stock stands in the ranking today.
Conclusion 💡
The portfolio looks different after October 1 than it did before. In September, about 41 percent was still in financial stocks; now there are two positions out of 30. Instead, 12 out of 30 are in semiconductors and memory, and six are in the healthcare sector. There’s no sector limit; the model sorts by score, not by industry. Trading won’t resume until early January.
How was your September? And did you hold onto your stocks after the pullback, or did you sell them? 👇
➡️ Every month, you’ll find the complete Wikifolio update here, along with research in between.
📈 Wikifolio $DE000LS9V052 (-1,68%)

+ 1
88
8 Commenti
4Settimana
What are the CAGR and Sharpe ratio of your strategy?
•
11
•1Mes·
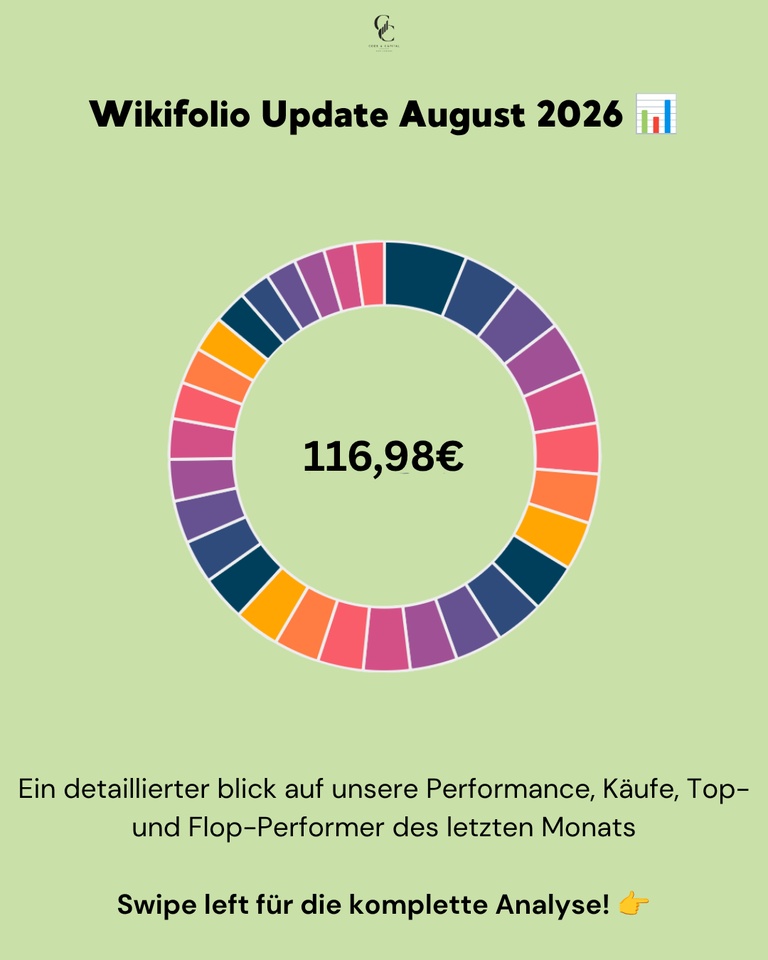
📊 Wikifolio Update August 2026
SanDisk $SNDK (-10,82%) up 28 percent, Western Digital $WDC (-4,37%) down 18 percent. Both in the same sector, in the same month. My model didn’t react to either of these movements, yet at the end of the month it was still up 3.03 percent.
August had two sides. At the beginning of the month, mild inflation data was released, and the S&P 500 hit an all-time high of 7,816 points on August 13. After that, sentiment on the bond markets shifted. The 30-year U.S. yield rose to its highest level in nearly twenty years, and U.S. gross debt exceeded forty trillion dollars. At the end of the month, Nvidia reported $NVDA (-2,63%) quarterly revenue of 96.2 billion, an increase of 106 percent. The next day, Fed Chairman Warsh signaled a pause in Jackson Hole, and the market priced in an interest rate hike in September.
📊 Monthly performance: +3.03%
📊 Max. Performance: 16.1%
📊 Price as of Aug. 31: €116.85
📊 Next Rebalancing: October 1, 2026
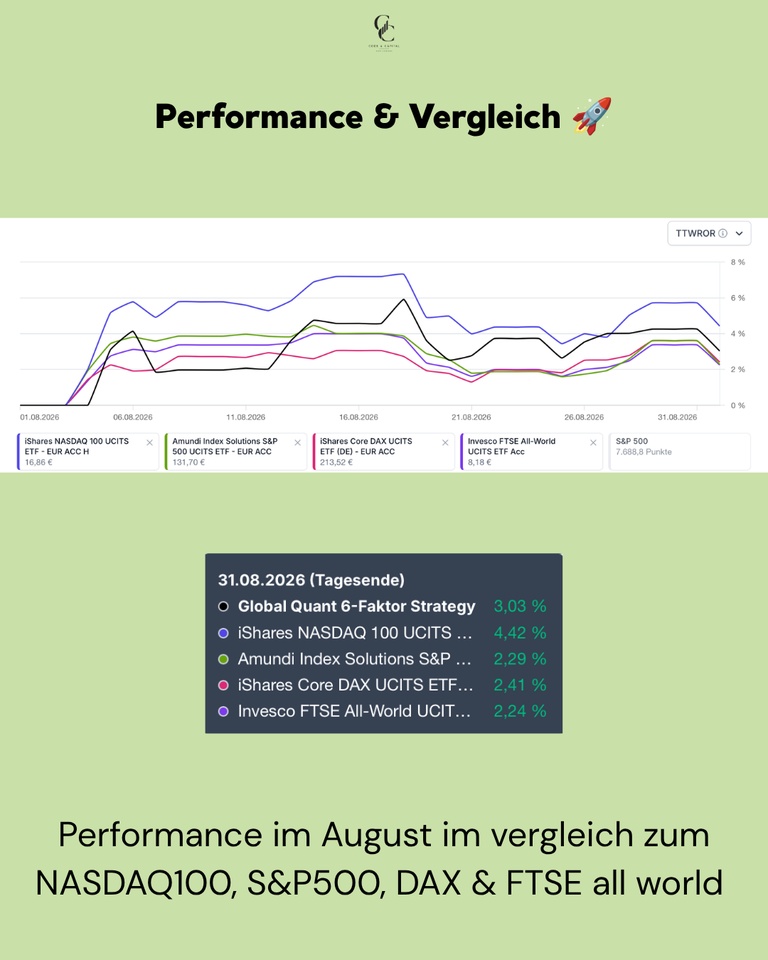
Performance & Comparison 🚀
August was a positive month for all major indices. The Nasdaq led the way, driven by Nvidia. The model performed in the middle of the pack and outperformed the broad indices.
Performance Comparison (August 1–August 31, 2026, end of day):
Global Quant 6-Factor: +3.03%
NASDAQ 100: +3.57%
S&P 500: +2.74%
FTSE All-World: +2.27%
DAX: +2.03%
Purchases & Sales 💶
None. The model trades only quarterly; the last rebalancing took place on July 1. Nothing happens between those dates, even if individual positions diverge significantly. That is precisely the point of the rules. The next rebalancing is scheduled for October 1, when a larger portion of the portfolio will be replaced.
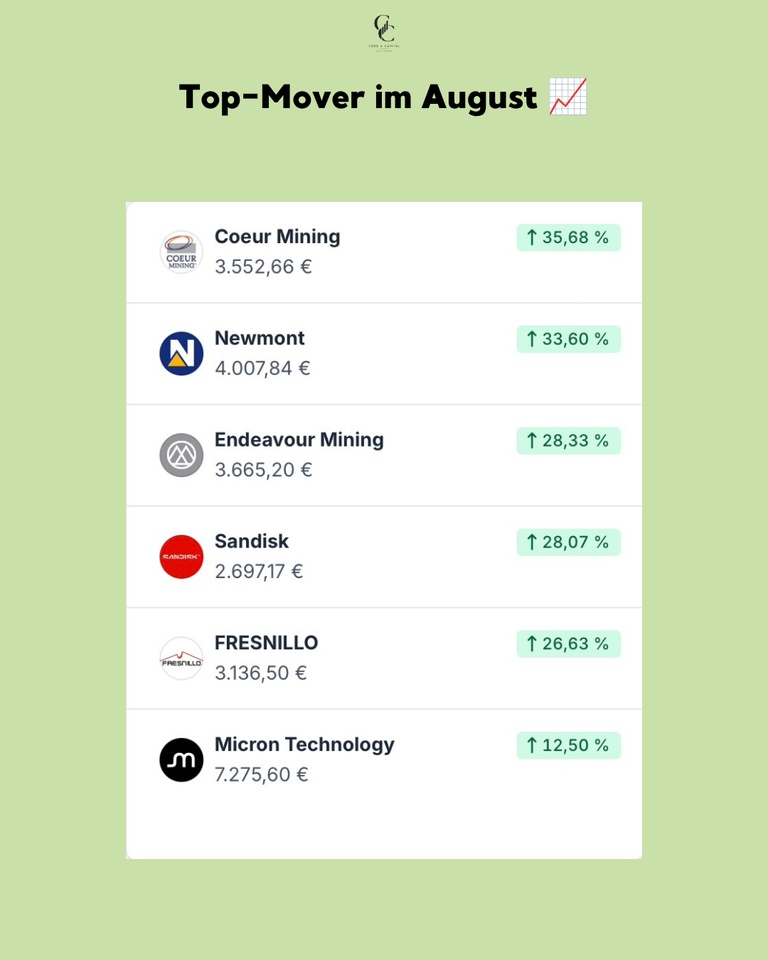
Top Movers in August 🟢
The month belonged to gold mining stocks. Over the course of the month, gold rose at times to nearly $4,700, reaching its highest level since May. By the end of the month, it had given back some of those gains. The move was driven by a weaker dollar combined with ongoing central bank purchases. Mining stocks react to this with leverage because their margins rise disproportionately. Coeur Mining $CDE (-6%) topped the list with +35.68%, followed by Newmont $NEM (-4,07%) at +33.60% and Endeavour Mining at +28.33%. Fresnillo $FRES (-2,09%) rose +26.63%. All four have been in the portfolio since the spring. In addition, the storage stocks performed well. SanDisk $SNDK (-10,82%) rose by +28.07%, and Micron $MU (-1,97%) by +12.50%.
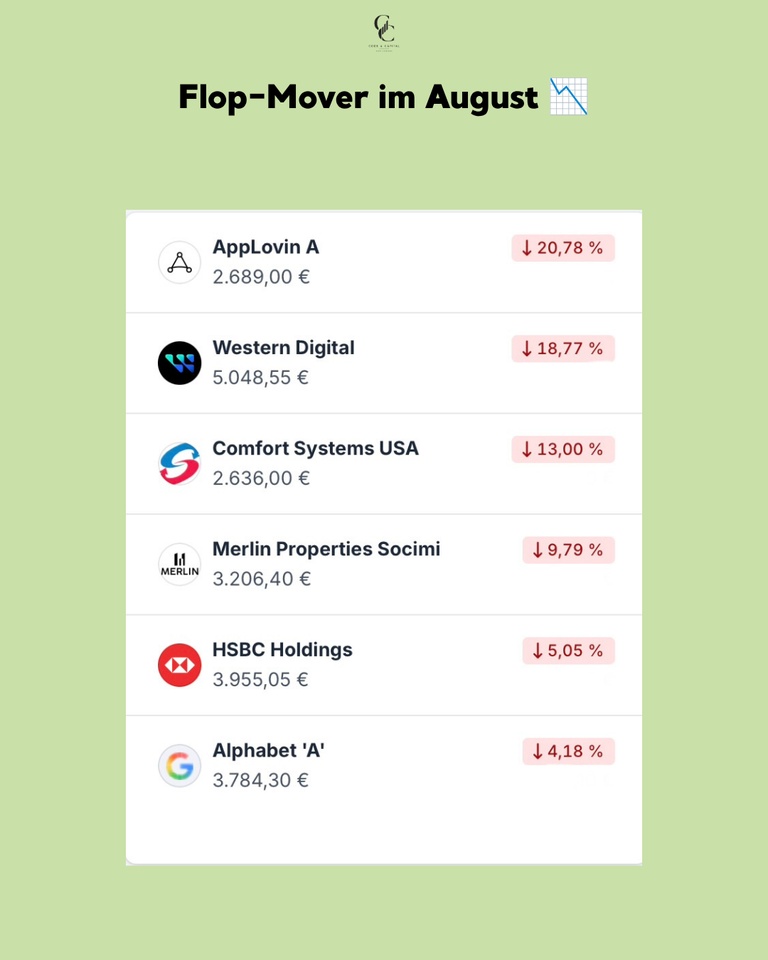
August’s Biggest Losers 🔴
AppLovin $APP (-9,25%) suffered the biggest loss at -20.78%. Western Digital $WDC (-4,37%) fell -18.77%, while SanDisk gained nearly thirty percent over the same period. Comfort Systems $FIX (-2,72%) fell by -13.00%, and Merlin Properties $MRL (-1,21%)
-9.79%. Among financial stocks, the decline was limited; HSBC $HSBA (-2,53%) lost -5.05%. Alphabet $GOOG (+0,06%) fell -4.18%.
Conclusion 💡
August demonstrated the value of a diversified portfolio. While technology stocks diverged and AppLovin fell 20 percent, gold mines carried the month. None of these positions are in the portfolio based on personal opinion; they’re there because the ranking placed them at the top. October 1 will be interesting because a large portion of the commodity stocks are on the sell list.
❓ Question for the Community
Did the volatility in August make you get cold feet, or did you stubbornly hold onto your positions? And how much gold do you currently have in your portfolio?
👇 Let us know in the comments!
➡️ Every month, you’ll find the full Wikifolio update here, along with research from the model in between.
🗞️ Newsletter: codeandcapitalquant.beehiiv.com
📈 Wikifolio: https://www.wikifolio.com/de/de/w/wf0gquant6
+ 1
1010


2Mes·
AppLovin Falls Short on Revenue!
Here's the hot stuff from AppLovin Corporation
$APP (-9,25%) (NASDAQ: APP) Q2 2026 Earnings Release, delivered fresh on August 5, 2026, after the U.S. market closed:
🚀 Top-Line Performance & AdTech Boost
The U.S. specialist in AI-powered advertising and app monetization platforms continued its growth trajectory in the second quarter of 2026, though its revenue fell just short of Wall Street’s sky-high expectations:
Total revenue: Climbed by +38% YoY to $1.92 billion (compared to $1.39 billion in the same quarter last year; within the company’s own guidance range of $1.915–$1.945 billion, but just below the consensus estimate of $1.94 billion).
Growth drivers: The ongoing scaling of the AI recommendation engine AXON continues to ensure high advertising efficiency and attract budget from app developers and e-commerce clients.
🔮 Profitability & Soaring Margins
In terms of net income, AppLovin is showing incredible strength and demonstrating the extremely high scalability of its software model:
Net Income: Hit the mark exactly at $1.27 billion.
Pre-Tax Income: Came in at $1.51 billion and significantly exceeded expectations of ~$1.49 billion.
Adjusted EBITDA: Reached $1.61 billion with its usual massive margin in the range of ~84–85%.
🤖 Financial Results & Initial Market Reaction
Cash on hand: Ended the quarter with $3.05 billion in cash and cash equivalents.
Market reaction: Following the stock’s massive rally ahead of the earnings release, market participants reacted in after-hours trading with some profit-taking (~ -7% in after-hours trading), as revenue growth narrowly missed the sometimes extremely bullish consensus estimates.
⚡ 💡 Jack’s Take
AppLovin remains an absolute cash cow in the ad tech landscape! The AXON AI engine continues to drive double-digit growth rates (+38%) with an operating EBITDA margin of just under 85%. The fact that the stock is giving up some ground in after-hours trading is simply due to Wall Street’s extremely high standards. For those betting on highly profitable AI monetization, this stock continues to deliver top-notch fundamentals!

2Mes·
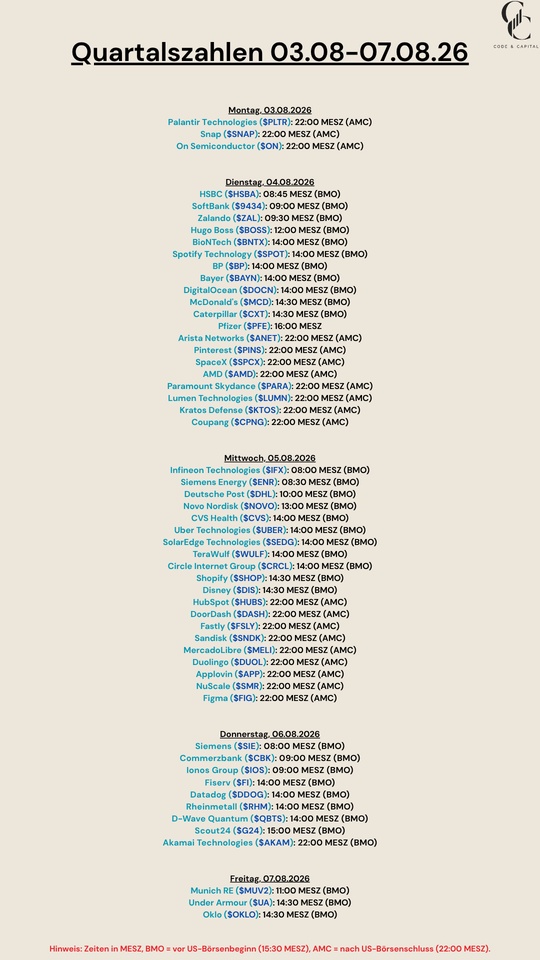
Quarterly Results August 3–7, 2026
$PLTR (-5,23%)
$SNAP (-3,64%)
$HSBA (-2,53%)
$9434 (+1,33%)
$ZAL (-0,52%)
$BOSS (+0,19%)
$BNTX (-0,76%)
$SPOT (+7,14%)
$BP. (-0,32%)
$BAYN (+5,27%)
$DOCN (-5,9%)
$MCD (+0,02%)
$CAT (-2,99%)
$PFE (+1,26%)
$ANET (-5,43%)
$PINS (+9,46%)
$SPCX (-4,17%)
$AMD (-5,15%)
$PARA (+0,71%)
$LUMN (+2,11%)
$KTOS (-3,37%)
$CPNG (-0,37%)
$IFX (-4,37%)
$ENR (-6,07%)
$DHL (-0,71%)
$NOVO B (+2,56%)
$CVS (-0,26%)
$UBER (+0,57%)
$SEDG (-0,37%)
$WULF (-4,36%)
$CRCL (-5,38%)
$SHOP (-4,87%)
$DIS (+0,24%)
$HUBS (-0,47%)
$DASH (-1,25%)
$FSLY (-6,41%)
$SNDK (-10,82%)
$MELI (-1,4%)
$DUOL
$APP (-9,25%)
$SMR
$FIG (-1,23%)
$SIE (-3,4%)
$CBK (-1,73%)
$IOS (-0,62%)
$FI (+2,93%)
$DDOG (-8,43%)
$RHM (-2,1%)
$QBTS (-6,65%)
$G24 (+2,08%)
$AKAM (-4,95%)
$MUV2 (+1,83%)
$UA (+0%)
$OKLO
1313
2Mes·
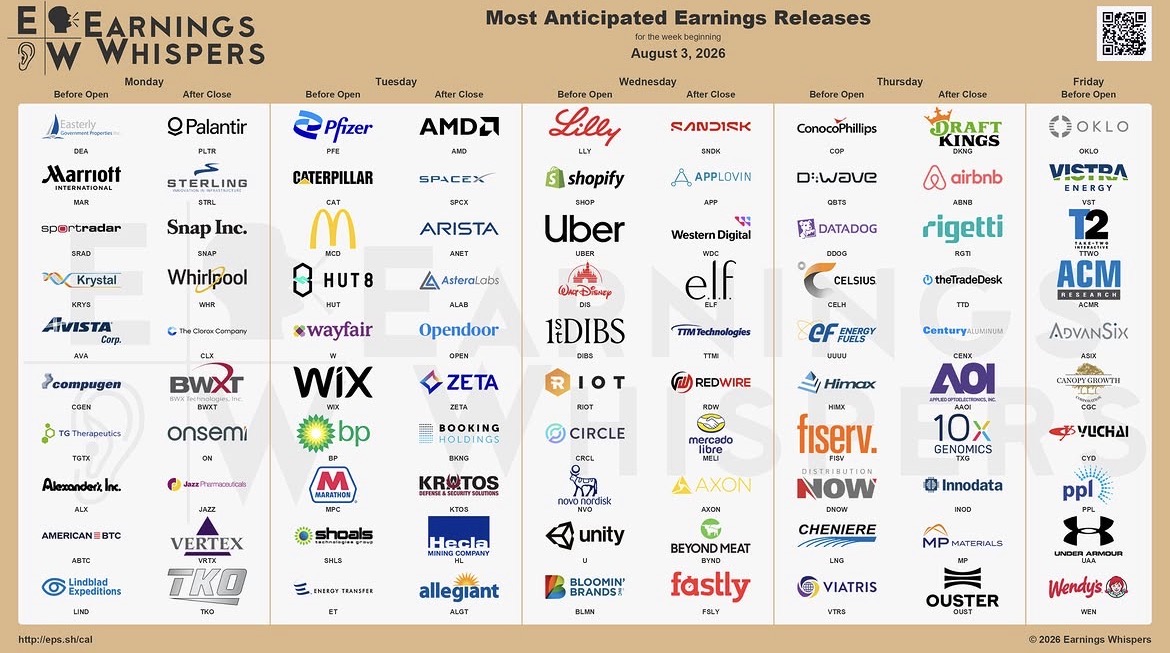
Let's move on to the next round!
$MAR (-0,38%)
$KRYS (+2,79%)
$PLTR (-5,23%)
$STRL (-5,39%)
$SNAP (-3,64%)
$WHR (+1,81%)
$CLX (-0,82%)
$BWXT (-3,92%)
$ON (-2,2%)
$VRTX (+1,64%)
$PFIZER
$CAT (-2,99%)
$MCD (+0,02%)
$HUT (-6,44%)
$WIX (-2,71%)
$W (-2,88%)
$BP. (-0,32%)
$SHLS
$AMD (-5,15%)
$SPCX (-4,17%)
$ANET (-5,43%)
$ALAB (-7,62%)
$OPEN (-3,01%)
$ZETA (-3,57%)
$BKNG (-1,39%)
$KTOS (-3,37%)
$HL (-5,67%)
$LLY (+2,49%)
$SHOP (-4,87%)
$UBER (+0,57%)
$DIS (+0,24%)
$RIOT (-3,87%)
$CIRC
$NOVO B (+2,56%)
$U (-1,94%)
$SNDK (-10,82%)
$APP (-9,25%)
$WDC (-4,37%)
$ELF (-0,64%)
$MELI (-1,4%)
$AXON (-0,54%)
$TTMI (-1,05%)
$RDW (-6,75%)
$QBTS (-6,65%)
$DDOG (-8,43%)
$CLA (+0%)
$FI (+2,93%)
$LNG (+3,29%)
$UUUU (-4,79%)
$HIMX (-5,12%)
$ABNB (-1,92%)
$RGTI (-5,28%)
$TTD (-4,43%)
$AAOI (-6,71%)
$TXG (-13,89%)
$INOD (-0,7%)
$OUST
$MP (-2,75%)
$OKLO
$VST (+0,44%)
$TTWO (-1,15%)
$ACMR (-2,69%)
$WEED (-1,67%)
$UAA (-0,89%)
2626
13 Commenti
And all this while on vacation🫣😂😭
•
1010
•