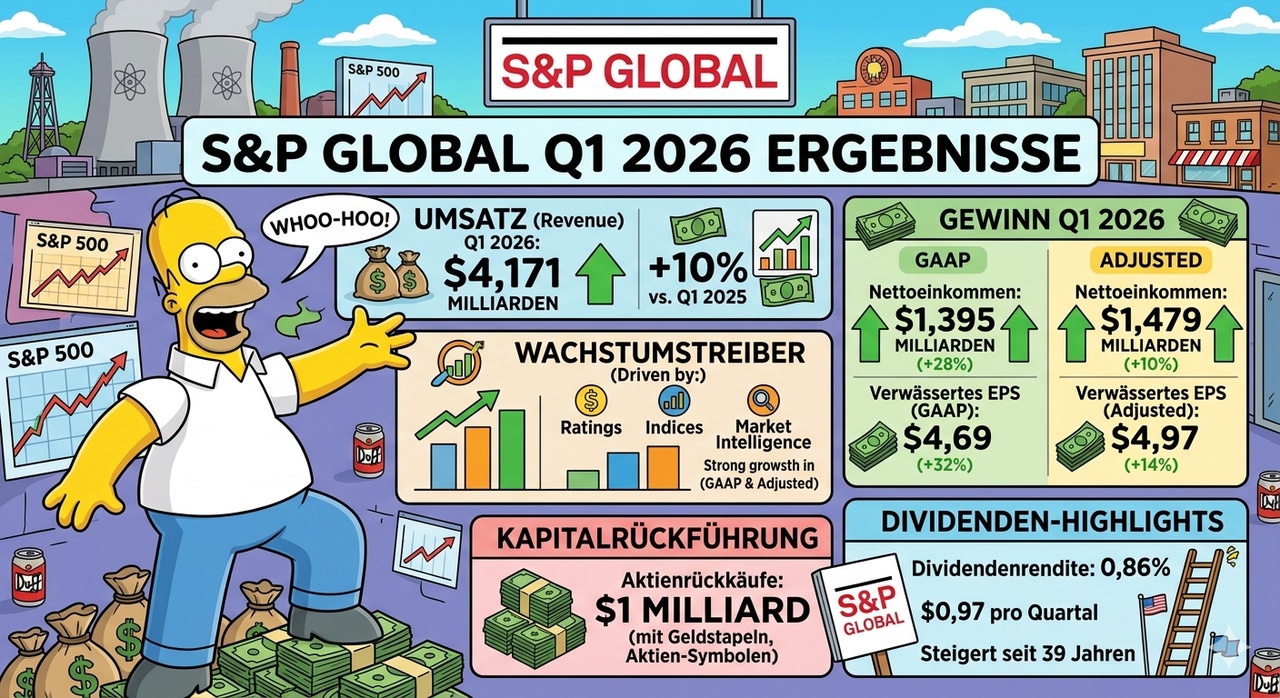
Personally, I don't understand the sell-off after the U.S. market opened. The numbers were good to solid, and the forecast was raised slightly.
Apparently, good numbers aren't enough anymore.

Posts
96Hello, friends of joyful investing,
I’d like to share another milestone with you—one that came sooner than expected:
The portfolio has surpassed the 400k mark.
First off: This is just a snapshot. Markets aren’t a one-way street, and things can easily swing back in the other direction. Still, I’m happy about it and am consciously savoring the moment.
My strategy: Quality Growth with a strong moat
I continue to follow a quality growth approach. I look for companies with
• a strong, hard-to-attack moat (network effects, switching costs, technology leadership, market standards),
• high and stable margins that demonstrate the business model’s pricing power,
• high return on equity and the ability to profitably reinvest earnings,
• tailwinds from global megatrends such as AI, the cloud, cybersecurity, the digitization of payments, and healthcare.
My goal is actually quite simple: to invest in outstanding companies and then watch them grow as compounders over the years. Trade less, hold more.
Deliberately Concentrated
The concentration in the portfolio is intentionally high. I am convinced that companies like $NVDA (+0.94%), $GOOGL (+1.14%) , $MSFT (-0.57%) , $META (+0.48%) , $AMZN (-0.01%) , $AVGO (+2.02%) , $CRWD (+0.81%) , $ANET (+1.37%) and $ASML (+0.96%) will continue to benefit significantly from these megatrends in the future. This is complemented by high-quality companies with near-monopoly positions such as $V (+0.08%) , $MA (-0.35%) , $SPGI (-0.24%) , $MCO (-0.35%) and $CTAS (-0.26%) , which consistently deliver high margins.
Conclusion
Patience and conviction pay off when you invest in the right companies.
I’m sticking to my strategy and seeing how things play out.
What do you think: focus on quality, or is a broad diversification better? I look forward to hearing your thoughts!

Step 0: Real-Time Data & Context (as of August 2026)
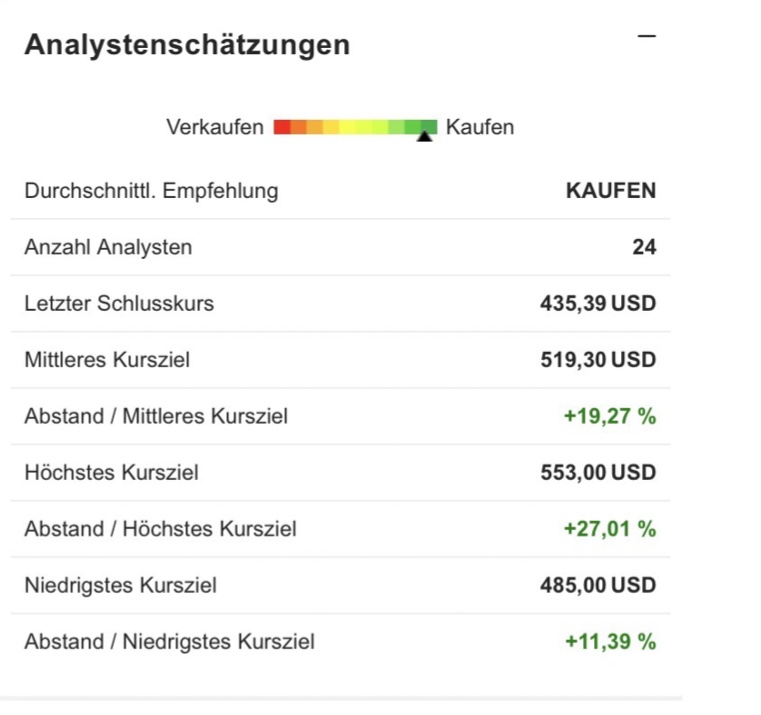
Current Price: ~$435.40 USD
Market Cap: ~$127.6 billion USD
Dividend Yield: ~0.9%
Cyclicality: Moderate dependence on global bond issuance volume (ratings), cushioned by extremely stable, recurring data and index subscriptions.
Point 1: Business Model & Disruption Check
S&P Global is the backbone of global financial markets and divides its business into four main pillars:
1. S&P Global Ratings: Credit ratings for countries, companies, and bonds.
2. S&P Dow Jones Indices: Licensing fees for indices such as the S&P 500 or Dow Jones (driven by the global ETF boom).
3. Market Intelligence & Commodity Insights: Data, analytics, and benchmark prices (e.g., Platts for energy/commodities) following the successful integration of IHS Markit.
Disruption Check: Extremely low. Ratings and financial data are based on decades of trust, historical data, and regulatory anchoring. Generative AI does not pose a threat but is used as an accelerator to monetize proprietary data feeds even more efficiently.
Point 2: Competitive Moat & Market Position (9.5/10 points)
The competitive moat is among the widest in the entire global economy:
Duopoly / Legal Oligopoly: Together with Moody’s, S&P Global dominates over 80% of the global ratings market. Virtually no large corporation or government can successfully place bonds on the capital market without an S&P rating.
Irreplaceable Licenses: The S&P 500 is the world’s most important stock index. Every fund provider and ETF issuer must pay licensing fees to S&P to track it.
Enormous pricing power: Customers simply cannot switch to the competition, which allows S&P to implement annual price increases without significant customer attrition.
Point 3: Financials & Deep Risk (8.5/10 points)
Growth: In Q2 2026, revenue climbed 10.4% year-over-year to $4.15 billion (beating analyst estimates). The main driver was strong bond issuance volume (+25% billed issuance), largely fueled by AI infrastructure financing from hyperscalers.
Margins & Cash Flow: An outstanding operating margin of ~54.3%. The asset-light model requires virtually no reinvestment, allowing nearly all profits to flow into free cash flow.
Capital Allocation: Strict discipline—consistent share buybacks and dividends that have been rising for decades.
Point 4: Valuation & Peer Group (6.5/10 points)
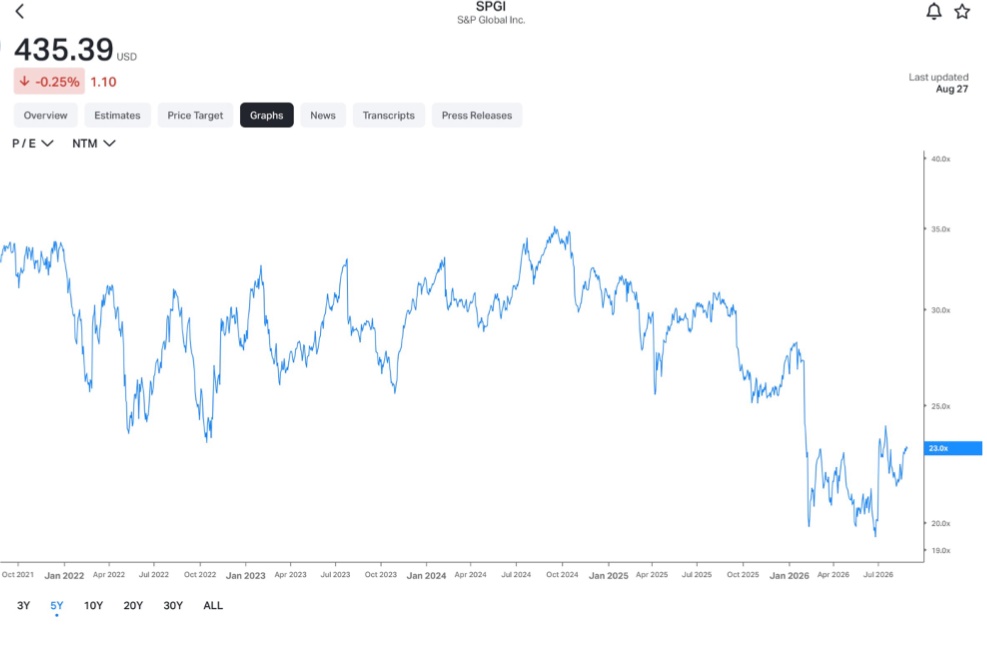
With a P/E ratio of 23, the stock is moderately valued from a historical perspective (the P/E ratio has often ranged from 30x to 35x in recent years).
Compared to its peer group (Moody’s, MSCI, FactSet), S&P Global is trading at a slight discount, primarily due to the temporary correction over the course of the year.
Margin of Safety: The P/E ratio isn’t “cheap,” but for a monopoly-like quality company with a margin exceeding 50%, the current level is attractive.
Point 5: Technical Analysis (6.0/10 points)
After reaching an all-time high, the stock went through a months-long consolidation phase and formed a solid base in the $360–$400 range.
Since the Q2 earnings report, the stock price has been steadily recovering toward $435.
The downtrend from the first half of the year has been broken, and momentum is slowly turning positive again.
CONCLUSION & INVESTMENT RATING
Calculation (Mode 1 Formula):
(Moat (doubled) + Financials + Valuation + Chart + Pre-Mortem) / 6
(19.0 + 8.5 + 6.5 + 6.0 + 8.0) / 6 = 48.0 / 6 = 8.0 / 10 points
Veto Check: No veto whatsoever. An absolute long-term performer (“monopolist”) in the global financial architecture.
The Verdict:
S&P Global is the prime example of a “Buffett-style company”: impregnable moats, irreplaceable products, and massive cash flow margins. Due to the correction over the past few months, the valuation has shrunk from astronomical heights back down to a reasonable level.
Recommendation:
A top candidate for savings plans or long-term incremental purchases. Anyone looking for a crisis-proof core investment with consistent dividend growth and unbeatable pricing power can gradually build positions at this level.
I’m currently considering establishing an initial position there. What do you think? Are you invested?
And everyone else.....
+ 1
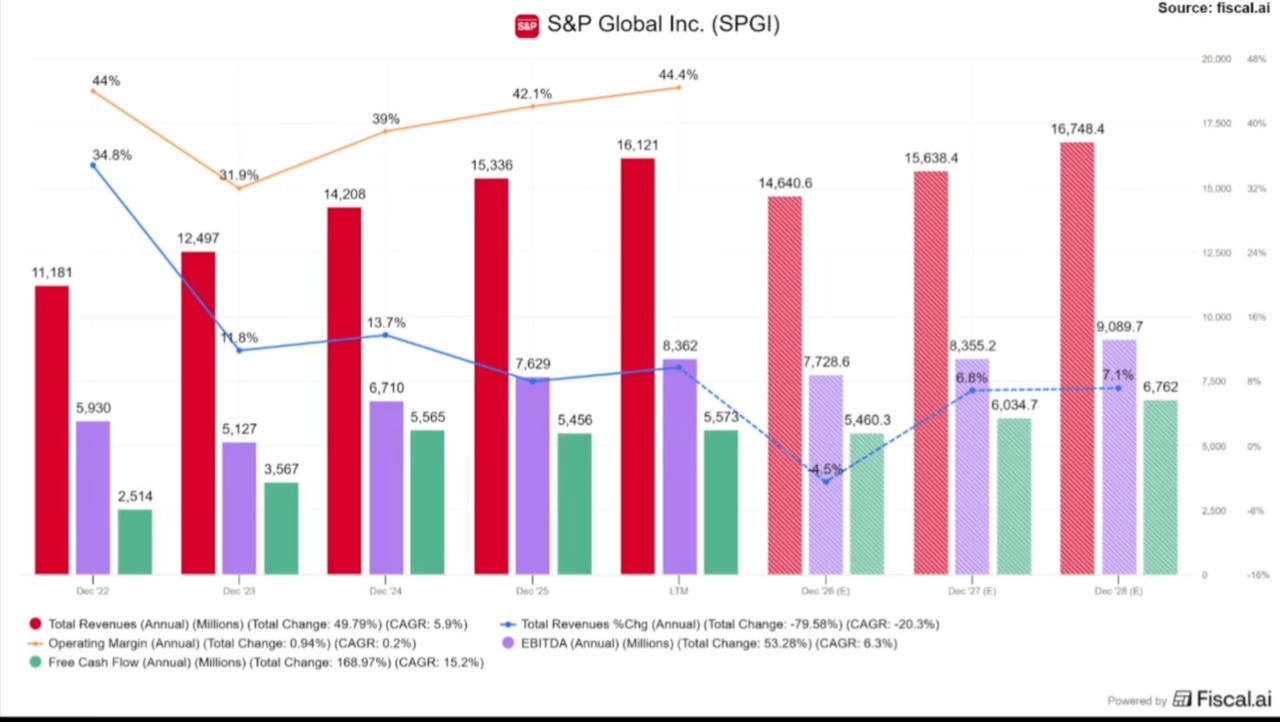

$MC (-1.14%)
$MBG (-0.19%)
$ULVR (-2%)
$PYPL (-0.61%)
$NBIS (+2.06%)
$SPGI (-0.24%)
$UPS (-0.48%)
$KO (-0.41%)
$GLW (+2.34%)
$BA (+0.11%)
$KER (-1.83%)
$ENPH (-1.67%)
$NXPI (+0.85%)
$STX (+5.13%)
$BE (+3.55%)
$V (+0.08%)
$MDLZ (-0.63%)
$000660
$P911 (+3.45%)
$BN (+3.33%)
$RMS (-0.8%)
$BAS (-0.35%)
$AG1 (+1.44%)
$LMND (+0.09%)
$SOFI (+0.45%)
$NDX1 (+1.33%)
$TER (+3.21%)
$GD (+0.13%)
$APH (+2.05%)
$AIR (+0.4%)
$SBUX (-0.74%)
$CMG (+0.4%)
$META (+0.48%)
$FTNT (-0.14%)
$QCOM (+0.6%)
$LRCX (+1.9%)
$HOOD (-0.62%)
$ARM (+2.58%)
$MSFT (-0.57%)
$CVNA (+0%)
$005930
$SU (+0.65%)
$INGA (-0.2%)
$OR (-0.48%)
$BMW (+0.58%)
$BATS (+0.34%)
$MA (-0.35%)
$ADS (-0.08%)
$SHEL (+0.23%)
$RACE (+0.06%)
$RDDT (-0.81%)
$TEM (+1.09%)
$COIN (+0.34%)
$AAPL (-0.45%)
$AMZN (-0.01%)
$CCO (-0.32%)
$LIN (+0.11%)
$ABBV (-1.01%)
$PUM (-0.2%)
$HAG (+0.21%)
$XOM (+0.38%)
$CVX (+0.21%)
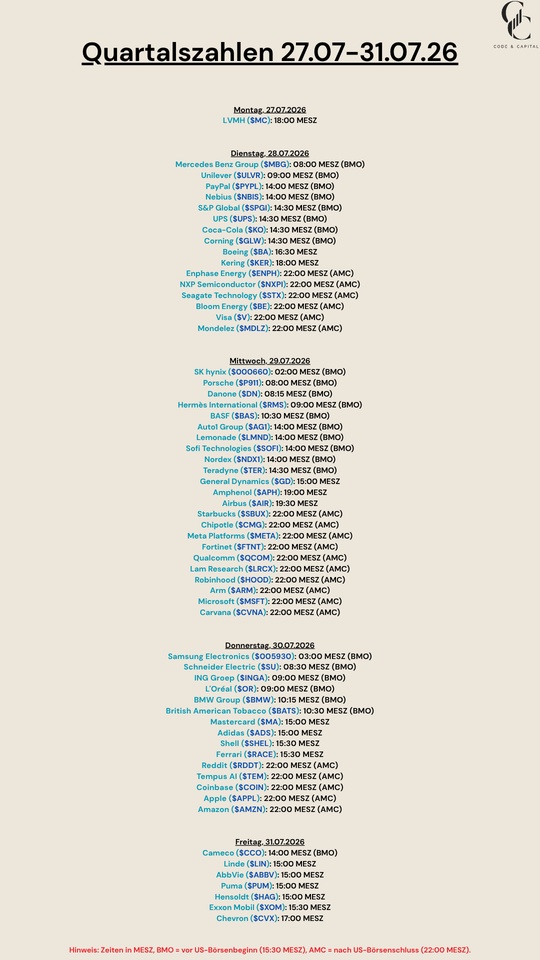
$SPGI (-0.24%) Has your portfolio balance been displayed correctly on eich since the spin-off?

$BLK (+0.12%)
$ENX (-0.71%)
$IVZ (+0.04%) & $SPGI (-0.24%)
The last few weeks have shown me that my portfolio is too cash flow-heavy and that I should focus more on dividend growth and growth stocks again. I have therefore spent the last few days looking at several of my stocks and scrutinizing overlaps, performance and cash flow. The result is a shift of around 10% of the portfolio towards more stability and growth with less risk.
Good and poor underperformers have been removed from the portfolio,
Reduced, the super run,
New additions to the portfolio are the stocks that are currently very attractively valued in my opinion,
Stable stocks with potential for outperformance were added,
Overall, I have reduced the number of positions somewhat, eliminated underperformers and at the same time shifted into stability and growth.
I feel very comfortable with this adjustment and will keep a close eye on what further adjustment potential I find in my portfolio.
In addition, I'm keeping around 10k dry in case things go downhill again if peace between the USA and Iran doesn't materialize after all... I have serious doubts that this will work out.
$VZ (-0.35%)
$DPZ (-0.18%)
$CDNS (+0.32%)
$BARC (-0.38%)
$SPOT (-0.65%)
$BP. (+0.53%)
$SPGI (-0.24%)
$KO (-0.41%)
$UPS (-0.48%)
$AIR (+0.4%)
$SBUX (-0.74%)
$ENPH (-1.67%)
$NXPI (+0.85%)
$STX (+5.13%)
$BE (+3.55%)
$V (+0.08%)
$MDLZ (-0.63%)
$HOOD (-0.62%)
$MBG (-0.19%)
$UBSG (-2.13%)
$DBK (+3.25%)
$LMND (+0.09%)
$SOFI (+0.45%)
$TER (+3.21%)
$ADS (-0.08%)
$ABBV (-1.01%)
$G24 (+0.6%)
$WM (-2.66%)
$APH (+2.05%)
$CMG (+0.4%)
$GOOG (+1.07%)
$META (+0.48%)
$MSFT (-0.57%)
$AMZN (-0.01%)
$005930
$BAS (-0.35%)
$SU (+0.65%)
$INGA (-0.2%)
$ULVR (-2%)
$IDR (-0.71%)
$DHL (-1.07%)
$CAT (+2.15%)
$MA (-0.35%)
$PUM (-0.2%)
$MRK (-0.29%)
$CNHI (+0.15%)
$LLY (-0.78%)
$FSLR (+0%)
$WDC (+3.57%)
$RBLX (-0.2%)
$RDDT (-0.81%)
$SNDK (+5.15%)
$AAPL (-0.45%)
$TWLO (+0.24%)
$EL (-0.95%)
$CL (+0.44%)
$XOM (+0.38%)
$CVX (+0.21%)

Anyone who needs capital or wants to invest comes to S&P Global can hardly avoid S&P Global. The company earns from decisions that others have to make.
A rarity
Sooner or later, every share corrects, but for some it is particularly rare. S&P Global is one of them. Is the recent setback an opportunity?
S&P Global is one of the silent powerhouses of the financial world. The rating business is its foundation. Together with Moody's, S&P almost completely dominates this market.
The principle is simple: issuers pay to have their debt instruments rated. Investors use these ratings as a basis for their decisions. In practice, however, it is about much more than orientation.
The company rates countries, companies and financial products - and thus sets standards to which entire Märktealign themselves with.
A rating is often a prerequisite for obtaining capital in the first place. Many funds, insurance companies and banks are not allowed to invest without a corresponding credit rating.
The economic logic behind this is clear. Bonds with a rating are cheaper to finance than those without. In comparison, the costs for the rating are hardly significant. Issuers gain an immediate advantage that multiplies over the entire term. The willingness to pay for this service is correspondingly high.
Ratings pay for themselves
A study (Quelle) by the Federal Deposit Insurance Corporation shows that municipal bonds without a rating must offer significantly higher yields on average - around 48 basis points more than comparable rated securities.
On the other hand, the cost of a rating is around 8 basis points. Even if two agencies are commissioned, the ratings pay for themselves in the first year. This is a considerable advantage in the long term.
But this is by no means the only advantage. Ratings are now deeply integrated into the financial system. They are embedded in investment guidelines, loan agreements and regulatory requirements. Even if new technologies were to enable better analyses, this would change little. The decisive factor is not only the quality of the rating, but also its acceptance in the system.
This is precisely where the moat lies. There are numerous providers who could also produce creditworthiness analyses. But without recognition by regulators and market participants, they remain meaningless. The name S&P is the real currency.
An elegant business
However, the business does not end with credit ratings. S&P sells data, analyses and software solutions that are deeply integrated into the processes of banks, funds and companies. Decisions are data-driven, and S&P provides the basis for them.
Added to this is consulting. Large corporations and governments have been relying on its expertise for years. It's about market analysis, risk assessment and strategic planning. These long-term relationships ensure stable revenues and strengthen loyalty to the company.
Perhaps the most elegant source of revenue, however, is the index space. The S&P 500 is the global benchmark for equities. Countless ETFs and funds replicate it and pay license fees for it.
This means that S&P earns money every time capital is passively invested. Without own Risiko.
That speaks for itself
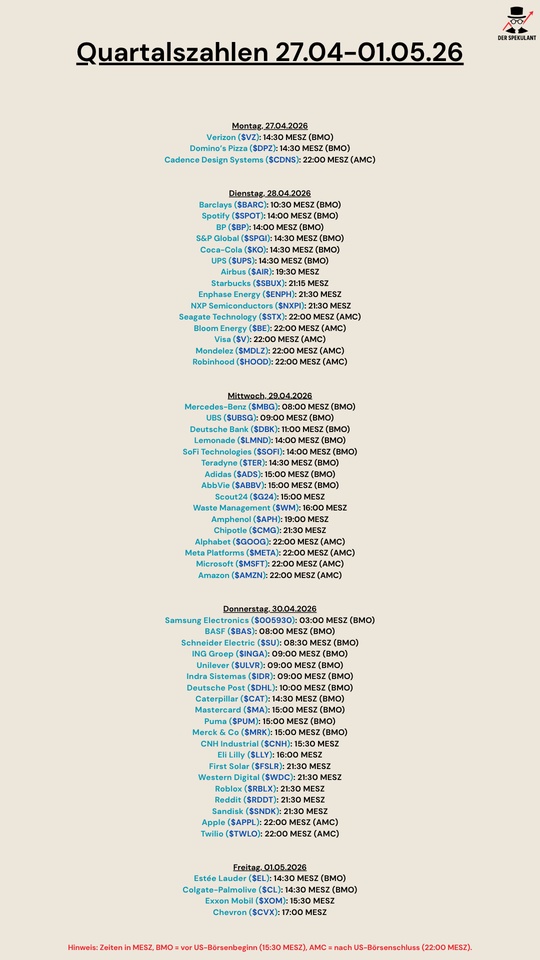
The figures show that this system works. Over the past ten years, S&P Global has more than doubled its turnover from USD 5.66 billion to USD 15.34 billion.
At the same time, profitability has improved somewhat, with a recent operating margin of around 40%.
During this period, earnings more than tripled from USD 5.35 to USD 17.83 per share.
In addition, the company is constantly buying back its own shares. Dilution only took place in the course of the takeover of IHS Markit took place. Apart from acquisitions, the number of shares outstanding is falling steadily - last year, for example, from 315 million to 306 million.
All this has made S&P a long-term outperformer and, if current forecasts are to be believed, this is likely to continue in a similar way.
Earnings are currently expected to rise by 10% this year to USD 19.60 per share.
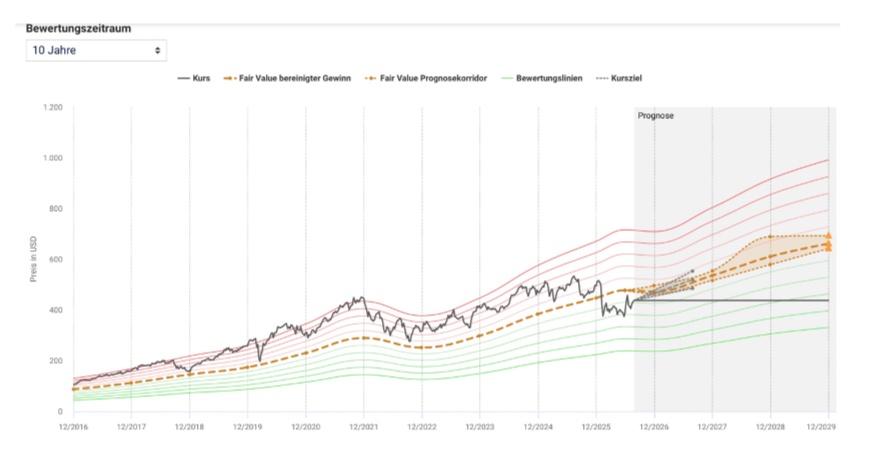
S&P Global thus arrives at a forward P/E of 21.3, which puts the valuation at a similar level to the low of 2022 or 2020.
Disappointing record result
It is also possible that expectations are too low. After S&P presented "disappointing" figures and a "disappointing" outlook in the last quarter, forecasters are likely to be cautious.
In reality, Q4 earnings of USD 4.30 were slightly below expectations of USD 4.33 per share and revenue of USD 3.92 billion was slightly above estimates of USD 3.90 billion.
For 2026, S&P is forecasting a jump in earnings to USD 19.40 - 19.65 per share. The previous forecast was USD 19.82 per share.
In the big picture, this news was almost irrelevant in my view. However, the fact that every fly is made into an elephant on the stock market is nothing new
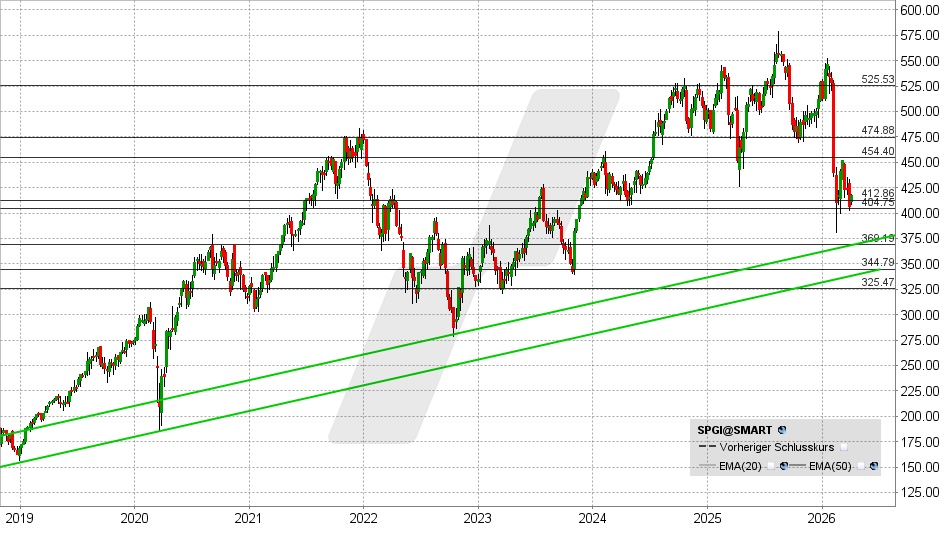
S&P Global share: Chart from 31.03.2026, price: USD 417.59 - symbol: SPGI | Source: TWS
S&P Global appears to be attracting interest at the USD 404 - 413 support zone. If a bottom is formed at this level, this could trigger a recovery towards USD 450 - 455. A procyclical buy signal would be issued above this level.
If, on the other hand, the share falls below USD 404 at the end of the week, further price losses to USD 390 or 370 must be taken into account.
Source
Top creators this week