
$WDC (+0.82%)
$STX (+1.78%)
$LRCX (-0.37%)
And risk big for tomorrow $MUU

Posts
14$STX (+1.78%) , $WDC (+0.82%) , $SNDK (-0.7%) , $LITE (+0.64%) , $ARM (-2.65%) , $MU (-0.66%) ,$BTC (-0.06%) , $ETH (-0.07%) Stock market and Bitcoin performance still have makes new story every years. From both in race to get more high level position and market trends reasonable to have strategy from demand and supply in Q2- Q3 this years.
■ this time semiconductor and memory chips makes point on high level market and bitcoin still movement from traditional weakness in cycle frame time after halving season 2024-2025 (2y high).
■ Partial in get momentum for wave cycle could be better from Quartal season meanwhile cruide oil to hike and gold makes downward for this month. Its not different from wave cycle in market to get average return performance. (JUNE - SEPT)
■ World Cup 2026 "Burger and Beer" 24 hour and perfect in time "Las Vegas" open. There is match point from momentum and makes new momentum and strategy market for United State.
■ Underpressure and Tension from Crude Oil, High Price for stock market and Bitcoin low season, this is not just on strategy to get market trends (every 4 years in frame time). However its gonna be hits to get score onboard from Trump Part 2 and Goal score for "time to buy" ✅️🎯
■ Remember this event (4 years in frame time) 🚀


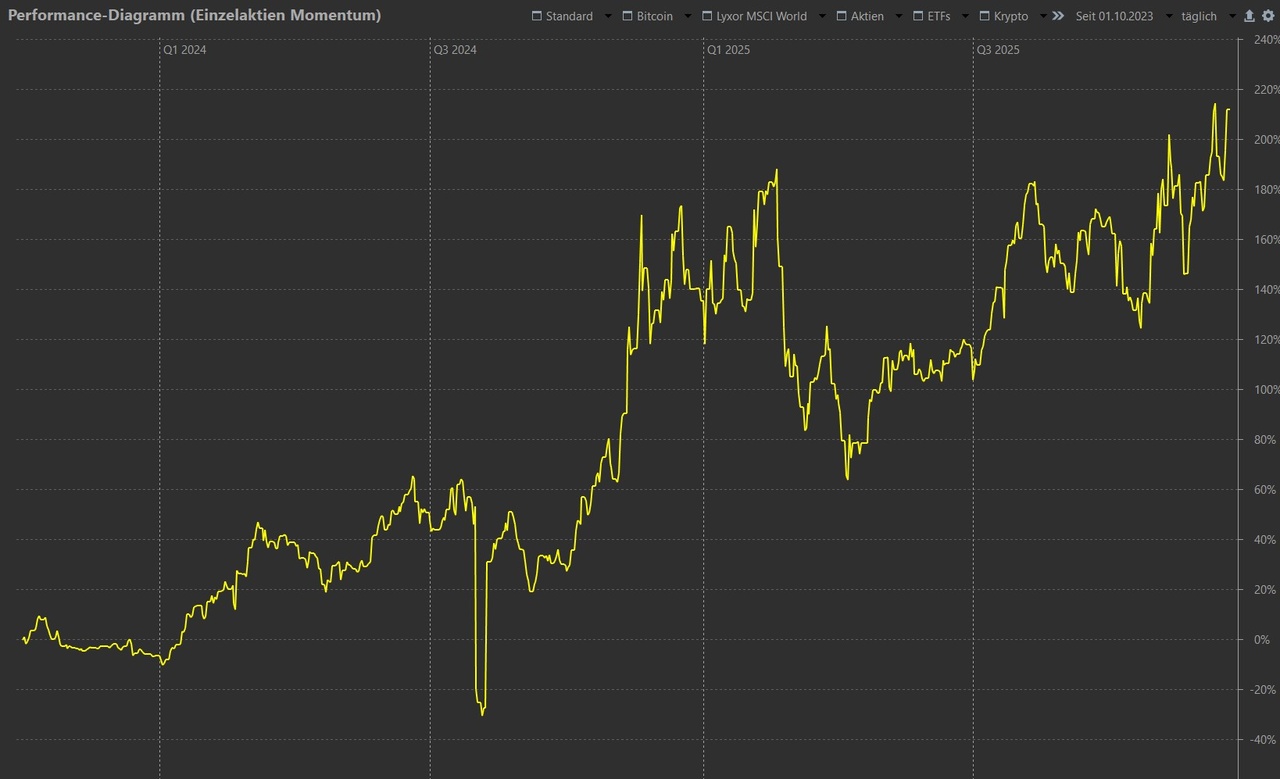
🚀🚀 May (the 5th month since the launch) also delivered a great performance. 🚀🚀
It only ran out of steam a little in the final week. But in the last 30 minutes of trading it has turned upwards again. I am following the algorithm with Western DIgital ($WDC (+0.82%)), Lumentum ($LITE (+0.64%)), Ciena ($CIEN (-2.28%)), Kioxia ($285A (+1.06%)) and Bloom Energy ($BE (-3.51%)) at the start.
The initial value was approx. 22,700 euros. Of this, 60 euros were lost due to capital gains tax on the switch to Kioxia and there was a capital inflow of 1,300 euros. This capital inflow largely flowed outside the algorithm into 1 SanDisk share ($SNDK (-0.7%)), as SanDisk is now one of the most valuable 100 companies in the world and has shown the most explosive momentum signals in the last 12 months, but is still stuck in the MSCI World Small Cap Index. To my surprise, this will remain the case for the coming quarter, which means that I will retain my "special position" for the time being. So it started at the beginning of May with 6 shares and 23,750 euros. And May flushed almost exactly +21% into the satellite portfolio.
+5,000 euros price gain - 21% up in 30 days 🚀
Who started and who performed how?
The overall increase is thus very strongly fueled by Western Digital. But Kioxia was the last and thus smallest position size to be added and has overtaken all other stocks with 71%. Ciena has done a stable job and Bloom Energy and Lumentum have stagnated somewhat without harming the portfolio too much. The special position in SanDisk improved the monthly average slightly. So we did everything right.
YTD the momentum performance is at an outstanding +122% TTWROR. 🤯😍
I hope to close above the 30k mark for June.
Here is a general summary of how the portfolio is made up before the stocks for June are published:
It consists of 3 pots:
Pot 1 selects the momentum stock from the MSCI World with the strongest momentum signal.
Pot 2 selects 4 stocks from the top 30% market capitalization (deciles 8 to 10) with the strongest momentum signal.
Pot 3 selects 3 stocks from deciles 7 to 9 with the strongest momentum signal.
It is to be expected that there will be duplications from the various pots. These are not overweighted, but kept simple. This means that there can be between 4 and 8 stocks in the portfolio.
How will the portfolio change in June?
It's nice to see that almost all stocks ended May on a positive note and even nicer to see that there will still be a change. This means that "from below" a stock has achieved stronger momentum than a stock that was held. In my view, this is the strategy's preferred behavior when it comes to switching.
Micron ($MU) (-0.66%) is back, but Dell ($DELL (+3.83%)) will also make it into the portfolio, displacing Ciena. According to the score, Western Digital would also be narrowly beaten by Intel ($INTC (-2.21%)), but due to the 5% holding threshold there is no change. This means that Intel has once again narrowly missed out on the portfolio.
The composition for June follows:
Evaluation of the pots:
Pot 1
Kioxia wins by a wide margin ahead of Micron and Ibiden ($4062) (+3.1%).
Pot 2
Kioxia
Micron
Dell
Western Digital
A hair's breadth ahead of Intel, Seagate ($STX (+1.78%)) and Murata Manufacturing ($6981)
Pot 3
Absolute dominance of
Kioxia
Bloom Energy
Lumentum
ahead of Ciena and, among others, RocketLab ($RKLB (-0.16%) ).
May the games continue.
Only 35X to the million 🥹

$VRT (-1.5%)
$SNDK (-0.7%)
$AMD (+1.5%)
$STX (+1.78%) all bought today.
$RET
$QTUM
$MSFT (-1.87%) all sold on stop losses 5% gain and 10% on QTUM.
$NLY (-1.8%) sold to go get some quick gains on memory after the oil prices come down.
Im expecting big gains on the portfolio after the oil prices correction. Let’s wait now.
Which ones are you invested in?
+107% Intel $INTC (-2.21%)
+92% Credo Techn. $CRDO
+91% Astera Labs $ALAB (+3.89%)
+73% MediaTek $2454
+72% AMD $AMD (+1.5%)
+72% Seagate $STX (+1.78%)
+71% SanDisk $SNDK (-0.7%)
+67% KIOXIA $285A (+1.06%)
+66% ON Semiconductor $ON (+1.79%)
+61% STMicroelectronics $STM (+1.3%)
+55% Marvell $MRVL (+0.68%)
+51% NXP $NXPI (+1.47%)
+49% Siltronic $WAF (-0.68%)
+47% GLOBALFOUNDRIES $GFS (-1.38%)
+47% SK Hynix $000660
+47% Micron $MU (-0.66%)
+46% Infineon $IFX (+2.35%)
+45% Western Digital $WDC (+0.82%)
+43% Texas Instruments $TXN (-2.37%)
+42% Arm Holdings $ARM (-2.65%)
+41% QUALCOMM $QCOM (+1.47%)
+41% Monolithic Power $MPWR (+0.95%)
+40% Aixtron $AIXA (-1.54%)
+40% Microchip Techn. $MCHP (+2.07%)
+34% Broadcom $AVGO (+3.08%)
+30% Skyworks $SWKS (+1.04%)
+25% Samsung Electronics $005930
+24% Analog Devices $ADI (+0.89%)
+18% TSMC $TSM (-0.54%)
+16% Lam Research $LRCX (-0.37%)
+14% KLA $KLAC (-0.97%)
+13% NVIDIA $NVDA (+2.81%)
+10% Applied Materials $AMAT (-1.85%)
+9% ASML $ASML (-0.09%)
I have AMD. Which one do you have?

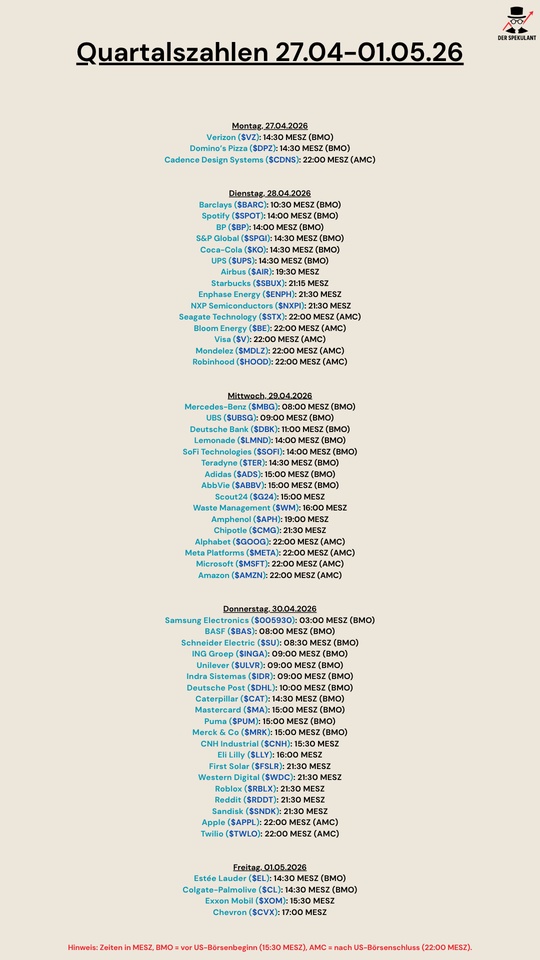
$VZ (+1.25%)
$DPZ (-1.75%)
$CDNS (-1.75%)
$BARC (+0.15%)
$SPOT (-3.82%)
$BP. (+1.21%)
$SPGI (-0.63%)
$KO (+0.28%)
$UPS (-1.03%)
$AIR (+4.08%)
$SBUX (-0.46%)
$ENPH (-0.43%)
$NXPI (+1.47%)
$STX (+1.78%)
$BE (-3.51%)
$V (-1.03%)
$MDLZ (+1.84%)
$HOOD (-2.17%)
$MBG (-0.09%)
$UBSG (+0.5%)
$DBK (+0.73%)
$LMND (-7.38%)
$SOFI (-3.1%)
$TER (-0.24%)
$ADS (-0.04%)
$ABBV (-0.74%)
$G24 (-2.33%)
$WM (+0.78%)
$APH (-0.3%)
$CMG (-3.66%)
$GOOG (-4.12%)
$META (-3.26%)
$MSFT (-1.87%)
$AMZN (-1.11%)
$005930
$BAS (+1.46%)
$SU (+0.02%)
$INGA (+1.16%)
$ULVR (+1.65%)
$IDR (-0.12%)
$DHL (-0.21%)
$CAT (+0.36%)
$MA (-0.55%)
$PUM (-0.99%)
$MRK (+1.83%)
$CNHI (+2.74%)
$LLY (-0.99%)
$FSLR (+1.67%)
$WDC (+0.82%)
$RBLX (-5.62%)
$RDDT (-8.56%)
$SNDK (-0.7%)
$AAPL (+0.02%)
$TWLO (-5.99%)
$EL (-0.21%)
$CL (+1.15%)
$XOM (+1.71%)
$CVX (+0.93%)

Good figures and, above all, a strong outlook caused the share price of $STX (+1.78%) rose by almost 10% after the close of trading. It is now up 260% for the year.
Since around 80% of revenue comes from the sale of storage for data centers, this is probably a good sign for the industry as a whole.
A good start to the reporting season :-)
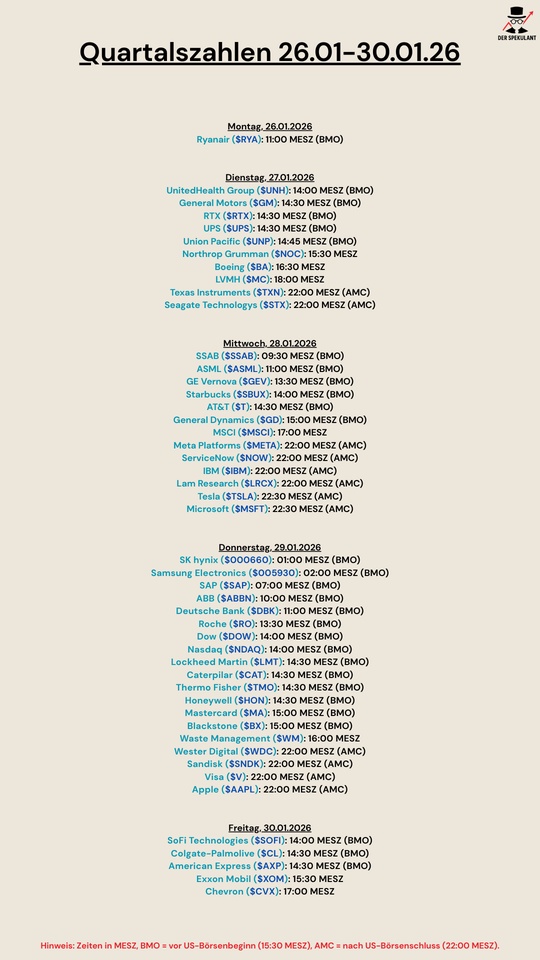
$RYA (-0.54%)
$UNH (-1.46%)
$GM (+2.43%)
$RTX (+0.69%)
$UPS (-1.03%)
$UNP (+1.47%)
$NOC (+3.13%)
$BA (+1.52%)
$MC (-1.65%)
$TXN (-2.37%)
$STX (+1.78%)
$SSAB A (-2.25%)
$ASML (-0.09%)
$GEV (-8.71%)
$SBUX (-0.46%)
$T (+3.17%)
$GD (+1.57%)
$MSCI (+1.02%)
$META (-3.26%)
$NOW (-2.58%)
$IBM (-0.42%)
$LRCX (-0.37%)
$TSLA (-4.07%)
$MSFT (-1.87%)
$000660
$005930
$SAP (-2.42%)
$ABBN (-0.31%)
$DBK (+0.73%)
$ROG (-0.48%)
$DOW (+2.47%)
$NDAQ (+0.31%)
$LMT (+1.37%)
$CAT (+0.36%)
$TMO (+0.61%)
$HON (+0.78%)
$MA (-0.55%)
$BX (-0.83%)
$WM (+0.78%)
$WDC (+0.82%)
$SNDK (-0.7%)
$V (-1.03%)
$AAPL (+0.02%)
$SOFI (-3.1%)
$CL (+1.15%)
$AXP (-1.07%)
$XOM (+1.71%)
$CVX (+0.93%)

Happy New Year everyone! 🎆 Just in time for the start of the year, I would like to share my portfolio update for the Top 8 share pool with you and give you an outlook for 2026.
First things first: no one knows whether 2026 will be a bull or bear year. Predictions for individual assets are often dubious. That's why I'm sticking to my rule-based model and present you with the current top 10.
🔝 My top 8 for the preselection 1st half of 2026:
Rank Share Sector Momentum Score
1 Western Digital ($WDC (+0.82%) IT / Storage solutions 115,2 %
2 Warner Bros. Discovery ($WBD (-0.12%) ) Communication / Media 103,8 %
3 Micron Technology ($MU (-0.66%) ) IT / Semiconductor 103,2 %
4 Seagate Tech ($STX (+1.78%) IT / storage solutions 83,0 %
5 Albemarle ($ALB (-0.56%) Chemicals / Lithium 74,7 %
6 Teradyne ($TER (-0.24%) IT / semiconductor test 67,3 %
7 Newmont ($NEM (+3.58%) ) Commodities / Gold 66,4 %
8 AppLovin ($APP (-3.31%) Software / AdTech 64,4 %
(Closely followed by $HOOD (-2.17%)
and $LRCX (-0.37%)
in 9th & 10th place).
🔍 A few insights into the model:
The sector weighting is exciting this time. We see a strong cluster risk (but also momentum!) in the area of Memory technology and semiconductors.
Interesting: Almost all of the stocks did not perform until the 2nd half of 2025 generated. As my filter weights the most recent past more heavily than the older past, these stocks were flushed to the top. This could be a signal that the trend here is continuing to gather pace.
And which two stocks are we starting 2026 with?
They are still $MU (-0.66%) and $WDC (+0.82%) as these are the two leaders in the ranking within the share pool, in 3rd and 4th place by a relatively large margin.
This means that no action is required for the time being and the next check will not take place until the end of January.
🎯 My goal for 2026: The €50,000 mark
I'm starting with capital of 31.000 €. For motivation, I have created my projections based on various return scenarios:
My personal goal for the end of 2026 is a portfolio value of approx. 50.000 €. This requires a performance of around 60 %. Sporty? Yes. Impossible with momentum? No.
What is your assessment?
Especially with the memory values ($WDC (+0.82%) , $MU (-0.66%) , $STX (+1.78%) are often a divisive issue. Do you still see the sector as the leader in 2026 or will it soon run out of steam? 💬
I wish you all a successful year on the stock market and, above all, good health! 🍀
Foreword
I know what you're thinking. Is it time for finance porn again? You normally only see figures like this in dubious YouTube videos, WhatsApp or Telegram groups. But behind this theoretical performance is not a "magic trick", but a tough, quantitative set of rules. You will not only see the historical backtest returns below, but I will of course also show you the real returns that have been achieved since the start of the project. In the end, decide for yourself how realistic and how high the average annual return can be.
Introduction
Many private investors invest based on gut feeling, news headlines or "hot tips". I have decided to tune out the noise and put my trust in the bare figures. After months of development and intensive backtesting, today I present to you the logic of my S&P 500 Hybrid Momentum Model.
My goal: to motivate you to understand momentum not as "gambling" but as quantitative engineering and, of course, to get as close as possible to the returns of the backtest.
🔍 The origin: From ETF to individual stocks
It all started with classic momentum ETFs and strategies such as GTAA (Global Tactical Asset Allocation). But I wanted to know: Could this principle be transferred to individual stocks to significantly beat the market? After hundreds of backtests, analyzing various universes (SPY, QQQ) and sectors, I now have my set of rules.
💡 The basic idea: "Buy high, sell higher"
Winners" statistically continue to run, while "losers" continue to fall - Buying at the ATH is historically more profitable than buying at the ATL.
While value investors act according to the motto "buy low, sell high", momentum uses the statistical tendency: Winners keep on running.
🧩 The concept: a selective powerhouse
My approach is a purely quantitative set of rules that isolates the strongest trends in the S&P 500:
The Universe: Focus on the 500 most liquid US large caps (S&P 500).
The selection: A pool of 8 stocks is selected through a time-weighted momentum scoring filtered. More recent price developments (last 6 months) weigh more heavily in order to capture trend reversals early.
The anchors: Oil & crypto proxies flow in as strategic counterweights to generate additional performance in specific cycles (inflation/risk-on).
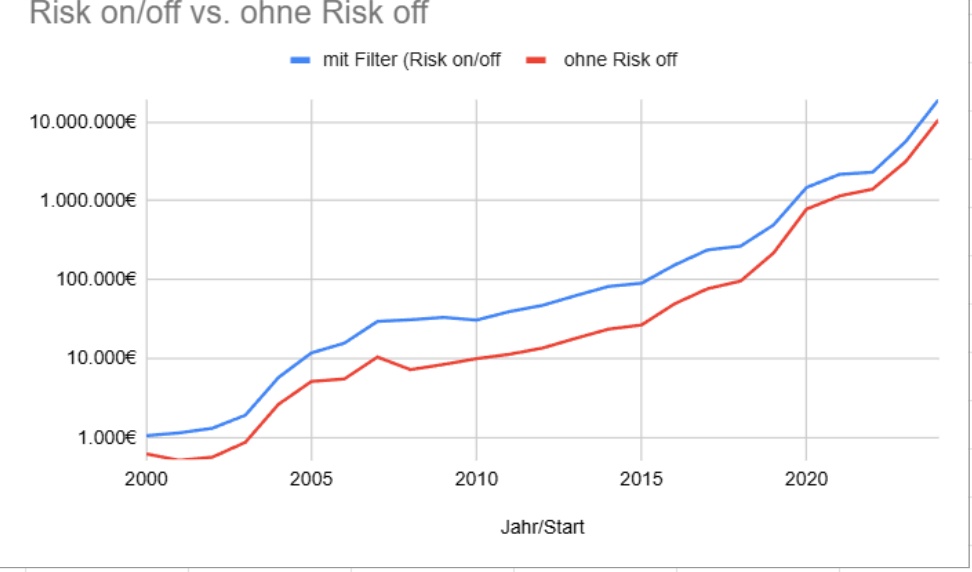
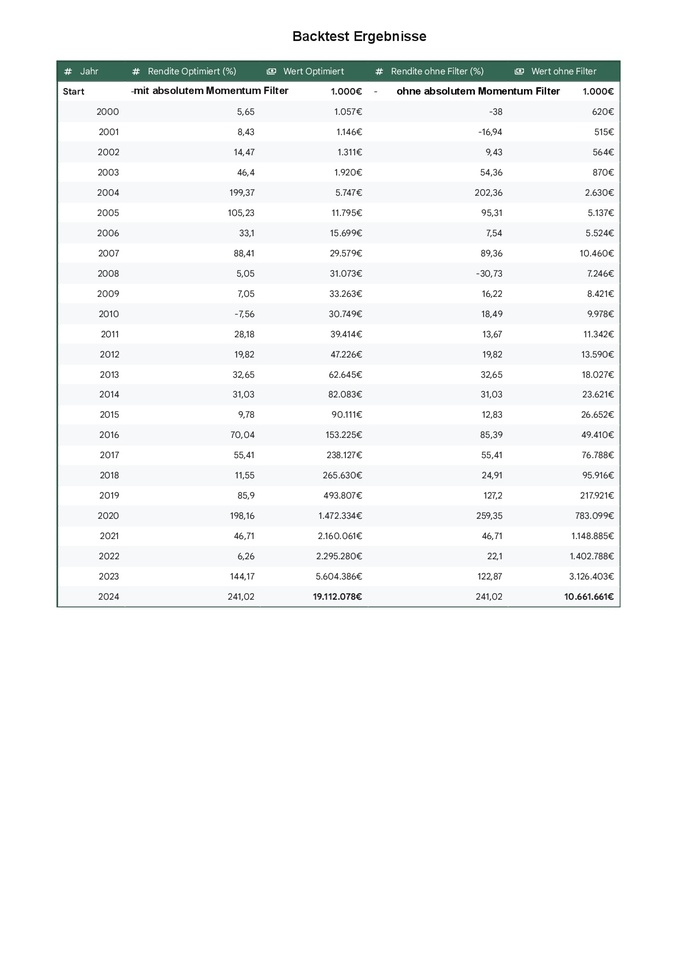
The safety belt (absolute momentum): To avoid massive drawdowns like in 2000 or 2008, the S&P 500 Index acts as a market filter. If the signal is negative, the model consistently switches to cash or money market cash or money market ETFs.
⚙️ Execution: focus on the leaders
A review takes place every month. Only the top 2 assets with the highest average score are held.
📊 Performance & live results
The theoretical data (2000-2024) shows an impressive CAGR of 56 %. I have been actively implementing the model since the end of 2023 - with approx. 80% of my total portfolio out of full conviction:
Returns
⚠️ Transparency on risk & volatility
High potential returns require iron discipline. The strategy is not for the faint-hearted:
Conclusion
I will provide regular updates here on how the model assesses the current phase. This is not the only way to be successful - but it is my systematic way.
Become the engineer of your own portfolio. Test, optimize and stay disciplined.
Do you have any questions about the topic or anything else? Let me know in the comments! 👇
#Momentum
#Investing
#SP500
#SystematicTrading
#Finanzen
#TradingStrategy
#Backtest
#Wealth
Risk warning: No investment advice. Historical prices do not guarantee future profits. Any investment can lead to a total loss.
PS: The strategy can now also be viewed/bookmarked as a wikifolio:
Top creators this week


