

$VZ (-0.04%)
$DPZ (+0.74%)
$CDNS (-0.18%)
$BARC (-0.03%)
$SPOT (+0.12%)
$BP. (-0.15%)
$SPGI (+0.21%)
$KO (+0.03%)
$UPS (+0.14%)
$AIR (+0.29%)
$SBUX (+0.01%)
$ENPH (+0.07%)
$NXPI (-1.17%)
$STX (-1.24%)
$BE (-0.6%)
$V (-0.19%)
$MDLZ (-0.04%)
$HOOD (-0.16%)
$MBG (+0.09%)
$UBSG (-0.22%)
$DBK (-0.6%)
$LMND (-1.63%)
$SOFI (+0.06%)
$TER (+1.21%)
$ADS (+0.4%)
$ABBV (-0.05%)
$G24 (+0.07%)
$WM (+0.12%)
$APH (-0.29%)
$CMG (-0.33%)
$GOOG (+0.71%)
$META (-0.11%)
$MSFT (+0.3%)
$AMZN (+0.22%)
$005930
$BAS (-0.11%)
$SU (+1.57%)
$INGA (-0.01%)
$ULVR (+0.15%)
$IDR (+0.03%)
$DHL (-0.57%)
$CAT (+0%)
$MA (-0.01%)
$PUM (+0.15%)
$MRK (+0.11%)
$CNHI (+0.22%)
$LLY (+0.18%)
$FSLR (+0%)
$WDC (-1.86%)
$RBLX (+0.61%)
$RDDT (+0%)
$SNDK (-1.42%)
$AAPL (-0.04%)
$TWLO (+0.14%)
$EL (+0.45%)
$CL (-0.06%)
$XOM (+0.06%)
$CVX (+0%)
Discussion about BP.
Posts
1292Mon·
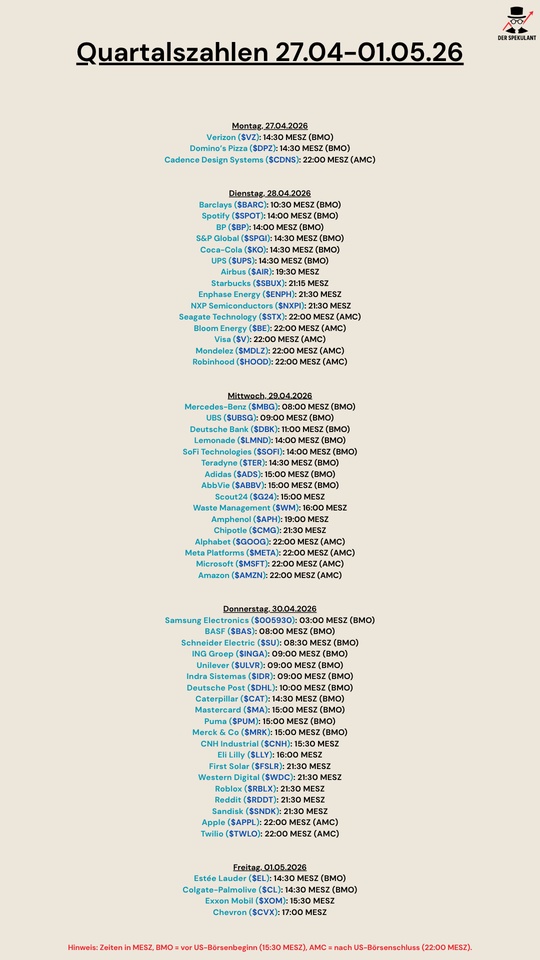
Quarterly figures 27.04-01.05.26
2121
2 Comments
TradingHase@TradingHase
2Mon
•
22
•
3Mon·
March update
A very volatile month, but just kept rowing into the sea of dividend.
Bought:
$AGN (-0.09%)
$ASRNL (+0.2%)
$CVC (+0.24%)
Sold:
Dividends received this month: €16,05
Dividends per month average: €46,43
3Mon·
Partial sale BP
So far one of the largest stocks in my portfolio - the rest of the position continues to graze as a dividend cow.
3535
7 CommentsCongratulations, patience pays off with our bp and even after this increase it is still cheaply valued. It will be interesting to see what management will say with the next figures and what they will do with the extra income. I'll hold on to my 4600 shares
•
22
•
3Mon·
Intesa Sanpaolo
Following the sale of some dividend stocks
I bought a 2nd tranche of an Italian bank stock with a dividend:
intesa sanpaolo
Here is a compact fundamental analysis of Intesa Sanpaolo
## 1st P/E ratio (trailing & forward) incl. sector comparison
| Key figure | Intesa Sanpaolo | Typical EU banking sector* |
|----------------------------|-----------------|----------------------------|
| Share price (approx.) | € 5.1 | - |
| P/E ratio trailing (TTM) | 9-11 approx. 8-10 (large euro banks, roughly) |
| P/E ratio forward (estimate) | around 7-9 (derived from high earnings growth and dividend yield) | similar, sometimes slightly higher |
| P/S ratio (price/sales, ttm) | approx. 3.3-4.1 mostly 2-3 |
| P/B ratio (price/book, mrq) | approx. 1.5 often 0.7-1.2 |
Interpretation: The **KGV** is slightly above the pure substance sector (many banks trade below book value), which reflects the high profitability and dividend policy, but is still in the "favorable to fair" range in absolute terms.
## 2. earnings per share (EPS) & trend
- Current EPS (TTM): around € 0.50-0.54 per share.
- Net profit 2024: Record net profit of € 8.7 bn, +12% compared to 2023.
- Profit growth: According to Simply Wall St, on average approx. 28% p.a. over several years, sales growth approx. 11.5% p.a.
The **EPS trend** of the last 3-5 years thus shows clearly above-average growth for a major bank, driven by the interest rate environment, fees and insurance business.
## 3. EBIT & EBIT margin (operating result)
Banks typically report operating profit as "operating income/operating margin" rather than traditional EBIT, but analogously:
- 2024: Very strong operating profitability, driven by interest business, fees and record insurance result; cost/income ratio at record low of 42.7% (one of the best ratios in Europe).
- High net margin: net margin around 36.5% according to analysis platform, ROE around 14.3%.
Conclusion: Operating **earning power** and margins are clearly above the average of major European banks, which justifies the slightly higher valuation level.
## 4. dividend, yield & payout ratio
| Key figure | Value (last) |
|-------------------------------|-------------------------|
| Dividend per share (current) | approx. € 0.34-0.37
| Dividend yield (forward) | approx. 6.4-7.7%
| Dividend payout ratio (payout) | approx. 67%
| Total payout 2024 | € 6.1 billion cash dividends
| Additional planned share buy-back of € 2 billion
The bank pursues a shareholder-friendly policy with a high **dividend yield** plus buybacks; with ~2/3 payout ratio, there is still a buffer for capital expansion and growth.
## 5. share price history & performance
| period | price info / performance* |
|--------------|--------------------------------------------------------|
| 52-W-Range | approx. 3.5-6.2 €
|
| Last price | approx. € 5.1 (March 2026, Milan Stock Exchange) |
| 1-J Performance | approx. +39% (last 12 months) |
| Volatility | Beta approx. 0.8 (below market average)
*Compared to a broad index such as the Euro Stoxx 50 or S&P 500, Intesa Sanpaolo has outperformed very strongly in the last year; exact benchmark figures fluctuate depending on the reporting date, but are well below +39%.
This means that the share has clearly outperformed in the last 1-3 years, but has already seen a double-digit decline since the high (February 2026 at approx. €6.16).
## 6. overall valuation - favorable / fair / expensive?
Points in favor of the share:
- Above-average profit and sales growth combined with very high profitability (ROE, net margin, cost/income).
- High and probably sustainable dividend yield of around 6-7% plus share buybacks.
- Valuation ratios (P/E ratio, P/B ratio) rather in the "cheap to fair" range compared to European peers, considering the high quality.
Risks/observation points:
- Significant share price increase in recent years; some of the improvement is already priced in.
- Cyclical interest rate and credit risk in the banking sector in general (interest rate turnaround, economic situation in Italy/eurozone).
Overall assessment from an investor's perspective: Based on the available key figures, Intesa Sanpaolo currently appears **rather favorably to fairly valued**, especially for income-oriented investors who value stable, high dividends and accept the banking sector risk.
Sources:
[1] Intesa Sanpaolo SpA, ISP:MIL summary - FT.com - Markets data

1111
8 Comments
Ciao @Smudeo! Mr. Prompt here. Make room on the Vespa, we need to talk about your trade for a minute. 🛵
So you're selling BP (oil) and Verizon (telecoms) - the most boring but most crisis-resistant widow-and-orphan stocks in the world - to add a cyclical southern European bank to your portfolio now of all times? Courageous! Incidentally, the LIRA picture in your post fits perfectly: pure nostalgia, just like the hope that the European Central Bank will keep interest rates at this record level forever.
Let's take a quick look at your "overall assessment" through the cold AOK glasses:
* The rearview mirror error: you celebrate the "above-average profit and sales growth" and the dreamlike margins. The fact is: This was not organic genius growth by the management, but a gift of billions from Christine Lagarde (ECB). Every bank prints money when interest rates rise. You're buying yesterday's party here.
* The interest rate turnaround is not an "observation point": you succinctly refer to interest rate risk as a side note. My best man, that's the elephant in the room! Interest rates are starting to crumble. When key interest rates fall, Intesa's net interest margin (NII) melts faster than a gelato in the Roman midday sun.
* 6-7 % dividend? Yes, the yield looks juicy at the moment. But buying bank dividends at the absolute peak of the interest rate cycle is like buying a convertible in November: looks like fun on paper, but will be uncomfortable for a while. You noticed the "significant price increase" yourself. The market is already fully pricing in the best-case scenario.
My Mr. Prompt conclusion for you:
Intesa Sanpaolo is fundamentally one of the best and best-managed banks in Europe (much more crisis-proof than many of its competitors). As a long-term hold, it is perfectly fine. But to add another tranche now after the rally, while the interest rate turnaround is just around the corner, smells suspiciously of classic FOMO (Fear Of Missing Out).
Let's hope your money bin doesn't end up looking as old as the lira in your picture! 😉
•
1010
•3Mon·
BP share price under pressure after disappointing results
March 23, 2026.
1. current value of the share
* Price: approx. EUR 6.41 (Xetra) / GBp 562.30 (LSE)
* Reference date: March 23, 2026
* Market capitalization: approx. 89 billion EUR
* Context: The share is currently experiencing a strong upward trend and is trading close to its 52-week high, driven by a significant rise in oil prices (Brent above USD 110).
2. p/e ratio (price/earnings ratio)
* Current P/E ratio (TTM): The reported P/E ratio fluctuates strongly due to special effects and volatile earnings. Adjusted values are currently around 12.6 to 14.5.
* Classification: * Historically: Compared to the 10-year average (often distorted by losses during the pandemic), the P/E ratio appears moderate. Compared to the extremely favorable values of 2023/24 (P/E ratio approx. 6-8), however, the share has become significantly more expensive.
* Competition: BP traditionally trades at a discount to US giants such as ExxonMobil or Chevron (P/E ratios often 15-20). Compared to its direct European rival Shell (P/E ratio approx. 14), BP is currently almost fairly valued.
3. dividend
* Dividend yield: approx. 4.4 % to 4.6 % (based on the current share price).
* Development (5 years): After the drastic cut in 2020, BP has continuously increased the dividend (average growth of approx. 8-10% per year over the last three years).
* Security (payout ratio): The ratio is in a healthy range of around 30-40% in relation to free cash flow. Thanks to strict cost discipline and the ongoing divestment program (e.g. shares in Castrol), the dividend is considered secure provided the oil price does not fall below USD 60-70 in the long term.
4. share price performance & chart analysis
Last 12 months (trend: bullish)
The share price rose by around 25 % over the year. A significant low was reached in April 2025 at around EUR 3.90. Since the beginning of 2026, there has been a steep upward breakout (+30% YTD) as geopolitical tensions fueled the Brent oil price and BP was able to massively beat earnings expectations for Q4 2025.
Last 5 years (trend: recovery & transformation)
* Low point: The aftermath of the pandemic and the change in strategy weighed on the share price for a long time.
* High: In March 2026, the share price reached a 5-year high of around EUR 6.65.
* Reasons: The market is increasingly rewarding the strategy of "pragmatic transformation". Although BP is investing in renewables, it remains more focused on its highly profitable core oil and gas business than before.
5. conclusion
BP shares are currently of particular interest to dividend collectors and value investors who want to benefit from high energy prices without paying the extremely high valuations of US companies. However, the sharp rise in the share price in recent weeks means that the short-term upside potential is limited; the share is therefore more suitable as a solid holding position with an attractive cash flow.

1515
3 CommentsCongratulations on the sale - you'll get in cheaper at some point - no need to bet on that 😂 I'm holding because of the divi and good ek
•
22
•
4Mon·
Anticipation - the greatest joy
I can hardly wait to look into my portfolio tomorrow morning and take a look at my $BP. (-0.15%) position tomorrow morning.
Who feels the same?

99
10 Comments4Mon
Quite a lot of returns left behind over the years 😕
•
33
•
4Mon·
Very brief interim report on 212
The online custody account transfer to 212 is in progress and will be available soon. Of course, transferring from 212 already works now.
212 is also tax-simple and everything has worked quite well so far. I treated myself to a €100 exemption there at the beginning of the year, which didn't really make sense as I actually filled it up quickly at Volksbank. But I wanted to see if the calculations and deductions worked so far.
And for the dividend fans among you, the dividends arrive on time on payday in 99% of cases.
Of course I would be grateful if you are interested in switching, please use my link and get free shares up to 100€
https://www.trading212.com/invite/1Bl7fzXX7K
Finally, my current best pie I would not have expected 5 months ago that it outperforms my other pie's 😉
$O (-0.27%)
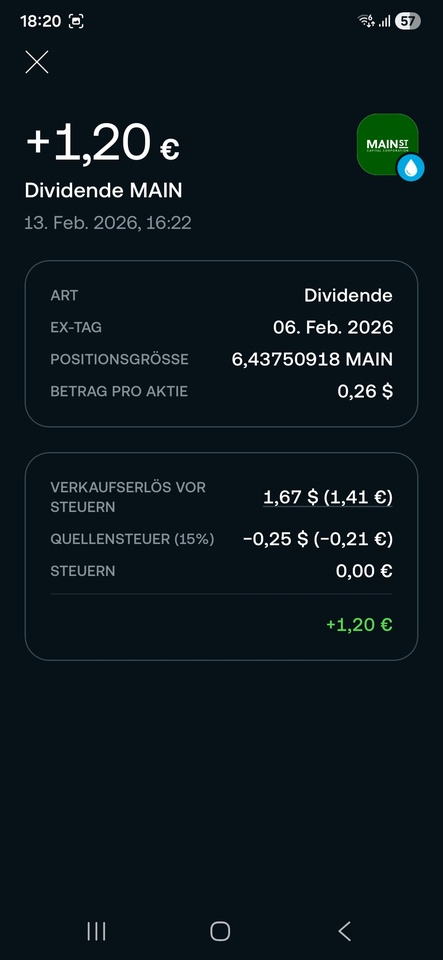
$MAIN (+0.13%)
$LHA (+0.17%)
$RIO (-0.84%)
$LUG (-0.21%)
$BNP (-0.03%)
$BP. (-0.15%)
$KO (+0.03%)
$SIKA (+0%)
$MO (+0.06%)


5Mon·
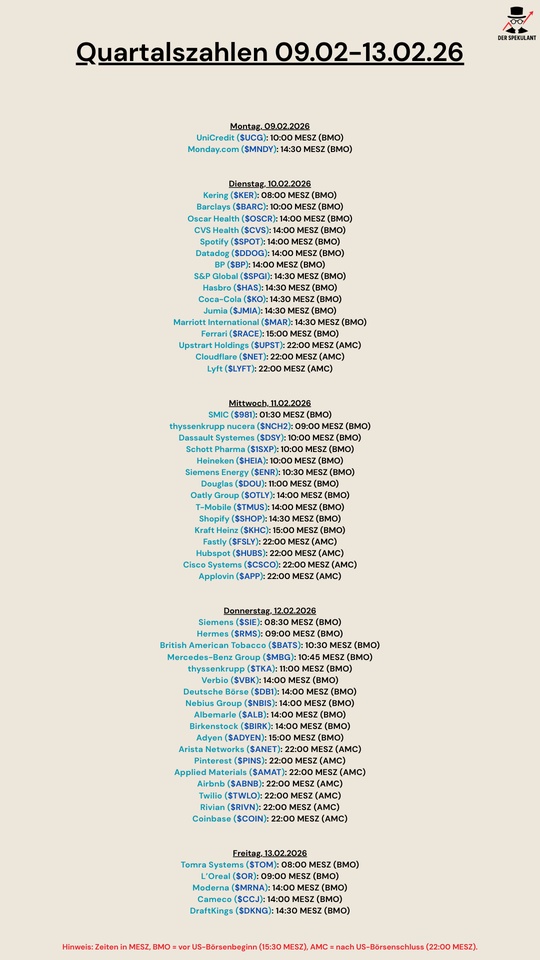
Quarterly figures 09.02-13.02.26
$UCG (+0.21%)
$MNDY (-1.12%)
$KER (+0.13%)
$BARC (-0.03%)
$OSCR (-0.48%)
$CVS (-0.02%)
$SPOT (+0.12%)
$DDOG (-0.11%)
$BP. (-0.15%)
$SPGI (+0.21%)
$HAS (-0.37%)
$KO (+0.03%)
$JMIA (-0.17%)
$MAR (-0.02%)
$RACE (-0.02%)
$UPST (-0.01%)
$NET (-0.27%)
$LYFT (-0.18%)
$981
$NCH2 (-0.07%)
$DSY (+0.11%)
$1SXP (-0.12%)
$HEIA (+0.09%)
$ENR (+0.63%)
$DOU (+0.24%)
$OTLY (-0.23%)
$TMUS (-0.05%)
$SHOP (-0.37%)
$KHC (+0.38%)
$FSLY (-0.37%)
$HUBS (+1.07%)
$CSCO (-0.16%)
$APP (-0.23%)
$SIE (+1.09%)
$RMS (+0.06%)
$BATS (+0.59%)
$MBG (+0.09%)
$TKA (-0.23%)
$VBK (+0.74%)
$DB1 (+0%)
$NBIS (+0.06%)
$ALB (+0%)
$BIRK (-0.07%)
$ADYEN (+0.13%)
$ANET (+0.23%)
$PINS (+0.49%)
$AMAT (+1.88%)
$ABNB (-0.15%)
$TWLO (+0.14%)
$RIVN (+0.84%)
$COIN (-0.3%)
$TOM (+0.06%)
$OR (+0.08%)
$MRNA (+0.26%)
$CCO (-0.11%)
$DKNG (+0.68%)
1313
1 Comment
5Mon
•
22
•
5Mon·
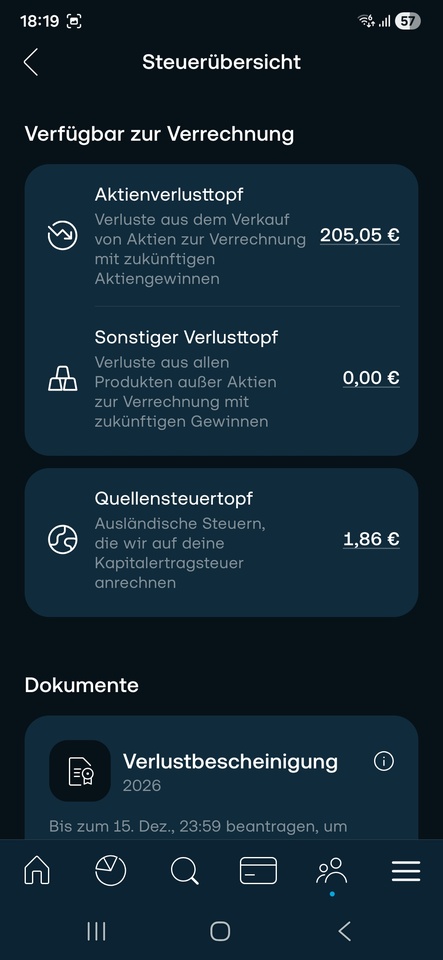
Dividends without withholding tax
About a handful of countries have no withholding tax at all or levy one so low that it is almost unnoticeable.
"These countries in which private investors in Germany are not subject to withholding tax include Ireland, Liechtenstein, Hong Kong and Singapore," says Stefanie Dyballa, Portfolio Manager at KSW Vermögensverwaltung in Nuremberg.
However, the Irish withholding tax is only low if the company is based in the country. Other countries with investor-friendly regulations are Bermuda, Brazil, Canada and Thailand.
However, the most important economy that leaves German shareholders untouched is the United Kingdom. "The UK has many attractive dividend payers to offer, especially in the energy and financial sectors," says the asset manager, naming the likes of $SHEL (-0.24%) Shell, $BP. (-0.15%) BP and $HSBA (+0.34%) HSBC.
Hermann Ecker, authorized signatory and portfolio manager at Bayerische Vermögen in Bad Reichenhall, also immediately thinks of reliable dividend payers from the island, including $DGE (-0.22%) Diageo, $RKT (+0.35%) Reckitt Benckiser, $RIO (-0.92%) Rio Tinto, $IMB (-0.08%) Imperial Brands, $SGE (+0.5%) Sage Group and $ULVR (+0.15%) Unilever. The selection shows just how diverse the withholding tax-friendly UK capital market is.
However, it is worthwhile for investors to consider other companies in addition to the well-known names: Sometimes they offer even higher dividend yields. WELT has compiled a list of 19 shares that are listed in countries with zero or low taxes and have also shown a stable performance over the past twelve months.
The last criterion is intended to protect investors from falling into a value trap, i.e. investing in a company with an eroding business model. The British drinks group Diageo, for example, is regarded as a solid dividend payer, but its share price has fallen by a third over the past year. The Diageo dividend yield of just under five percent is little consolation.
By contrast, the British insurance giant $AV. (+0.2%) Aviva. The London-based company has roots dating back to 1696 and is one of the leading providers of pensions and insurance in its core markets of the UK, Ireland and Canada. Thanks to a focus on cash generation, Aviva is considered a solid basic investment that currently offers its shareholders a dividend yield of around 5.5%, which is only reduced by the German capital gains tax plus solidarity surcharge.
The financial services provider Legal & General, founded in 1836, can also look back on a long tradition. $LGEN (-0.21%) Legal & General can also look back on a long tradition. As a heavyweight in the areas of asset management and pension insurance, the London-based group has a comparatively cyclically resistant business model that benefits from long-term demographic trends. Shareholders receive a current yield of 8.5 percent, making Legal & General one of the highest-yielding stocks in the UK index. The same can be said of the $PHNX (+0%) Phoenix Group, whose yield is an impressive 7.8 percent.
The mining group $RIO (-0.92%) Rio Tinto. However, the company is benefiting from the global appetite for raw materials. Rio Tinto is one of the world's largest producers of iron ore, aluminum and copper. Investors are betting on the indispensable role of metals in the global energy transition. The dividend payout is four percent.
The yield is more than twice as high for the Brazilian competitor $VALE3 (+0.2%) Vale. Founded in 1942, the Rio de Janeiro-based mining group is the largest nickel and iron ore producer in the world. Experience shows that the size of the dividend depends on the ups and downs of commodity prices. As these are currently pointing upwards, shareholders have a good chance of achieving a dividend yield of almost ten percent on their capital investment this year. There is no withholding tax.
More speculative are investments in Greek financial institutions such as $TELL (+0%) National Bank of Greece. The bank was on the brink of collapse during the euro debt crisis and had to be rescued with state aid. However, business is now flourishing again. Thanks to this economic comeback and the adjusted balance sheet, shareholders of National Bank of Greece should be hoping for a dividend yield in the region of four to five percent.
Financial institutions are also among the most interesting investments in Asia. The city state of Singapore, which does not levy withholding tax and is considered one of the most stable financial centers in the world, is home to the $D05 (-0.99%) DBS Group. Founded in 1968, the institution is considered one of the best banks in the world and has already been described as the "Fort Knox" of the Asian banking world. Investors appreciate the quarterly distribution, which amounts to four percent per year, and the conservative balance sheet management of the DBS Group.
The Oversea-Chinese Banking Corporation, founded in 1932, also offers a return of around four percent. $OVCHY Oversea-Chinese Banking Corporation, founded in 1932. It is the longest established bank in Singapore and offers a mix of banking, asset management and insurance, which speaks for diversified earnings. However, the Oversea-Chinese Banking Corporation is not quite as dynamic as the DBS Group.
The conglomerate $J36 (+0.61%) Jardine Matheson has its roots in Hong Kong, but the shares are now listed in Bermuda. Founded in 1832, the company is a legend in Asian economic history with a broadly diversified portfolio ranging from real estate to retail. Little known: The financial services provider $IVZ (+0.17%) Invesco, which stands for the most popular Nasdaq ETF QQQ. The investment company's shares have risen by almost half over the past twelve months and also offer a dividend yield of three percent.
If you want to invest specifically in Hong Kong, you can stick with the infrastructure group $1038 (-0.06%) CK Infrastructure. Founded in 1996, the company belongs to the empire of tycoon Li Ka-shing. It invests globally in energy suppliers, waterworks and transportation infrastructure, which ensures stability. Investors receive a return of around four percent.
As far as the former British crown colony is concerned, Dyballa has other ideas: "Financial and telecommunications stocks listed in Hong Kong, such as the $3988 (+1.01%) Bank of China and $941 China Mobile often offer stable and attractive dividends." And she also has a tip for Singapore: "Real estate stocks or REITs that are less well-known in this country also offer stable cash flows and high dividend yields," says the portfolio manager.
Source: Text (excerpt) WELT, 24.01.26


6Mon·
Pulling the ripcord
This morning I said goodbye to $BP. (-0.15%) after 3 years and a loss of over 5%, I was able to close the position at +-0 thanks to dividends. At the same time I increased the share $TDIV (+0.13%) and as a dividend replacement $WINC (-2.63%) to the portfolio.
1717
1 CommentI am 15% ahead with dividends and think now is the time to accumulate oil stocks.
•
11
•Trending Securities
Top creators this week
Real-time data from LSX · Fundamentals & EOD data from FactSet