Spotify
https://open.spotify.com/episode/78HuGo6FBV8n8QP13j0nv0?si=HyU-ZI0vS1a9df1oPAOysA
YouTube
https://openyoutu.be/h1lWmR-b8GY
Apple Podcast
https://podcasts.apple.com/de/podcast/170-tesla-hims-hers/id1695869891?i=1000798489341
Posts
770I'd also like to send warm greetings from my vacation in Sardinia ☀️🏝️
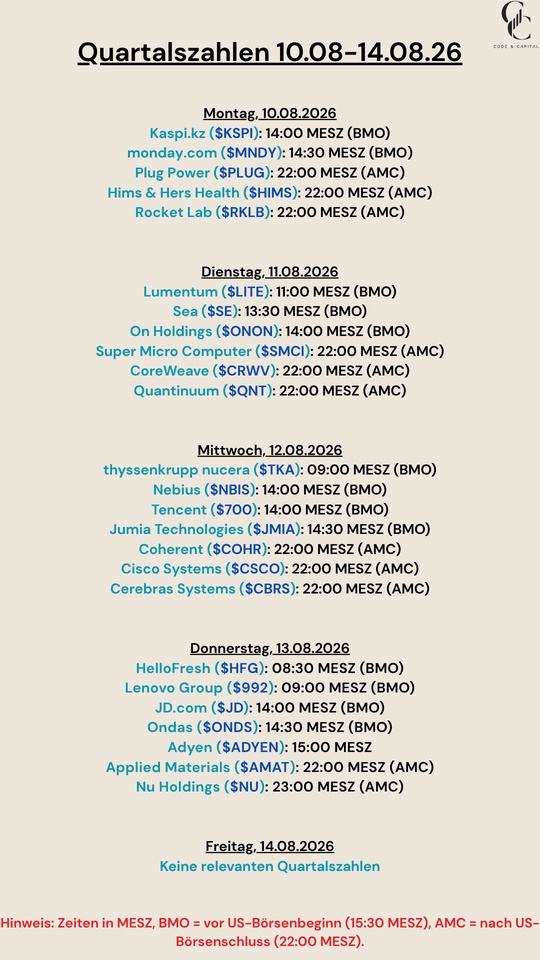
$KSPI (+3.17%)
$MNDY (+1.02%)
$PLUG (-1.02%)
$HIMS (-1.15%)
$RKLB (-1.54%)
$LITE (-14.26%)
$ONON (+2.29%)
$SMCI (-5.68%)
$CRWV (-7.15%)
$QNT (-2.69%)
$TKA (+2.07%)
$NBIS (-8.2%)
$700 (-1.63%)
$JMIA (-1.87%)
$COHR (-10.96%)
$CSCO (-1.09%)
$CBRS
$HFG (-1.02%)
$992 (-6.47%)
$JD (+0.44%)
$ONDS (-3.02%)
$ADYEN (-0.36%)
$AMAT (-1.59%)
$NU (-0.16%)
Top Performer
$AOF (+2.84%) +26%
$CTAS (+1.55%) +21%
$PAYX (+1.46%) +17%
$CNQ (+0.43%) +17%
$DPZ (-0.54%) +16%
Low Performer
$KLAC (-0.93%) -40%
$ENPH (+1.72%) -31%
$WSO (+4.18%) -27%
$HIMS (-1.15%) -24%
$JEDI (-0.63%) -22%
Good day for $HIMS (-1.15%) ! The FDA Peptide Panel approves BPC-157.
Thats an important step for $HIMS (-1.15%) to legally offer highly demanded compounded peptides, unlocking a massive new recurring revenue stream. BPC-157 is incredibly popular in the wellness and fitness communities for recovery, and this advisory vote removes a big regulatory hurdle for $HIMS (-1.15%) . Its going to be interesting to see if other Peptides will also get approved in the process.
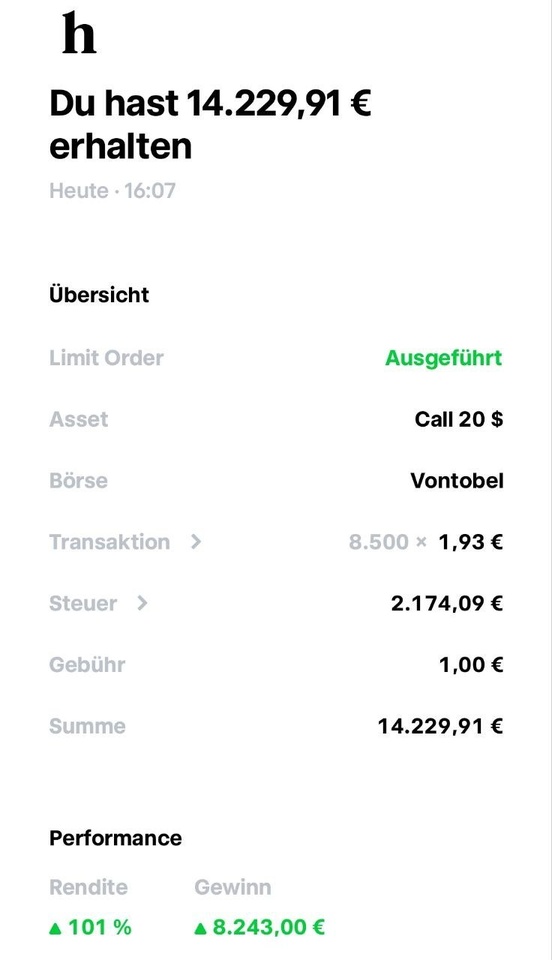
$HIMS (-1.15%) I bought more shares of Aufzug. Total gain of 500%. The additional shares purchased in February are up 136%.
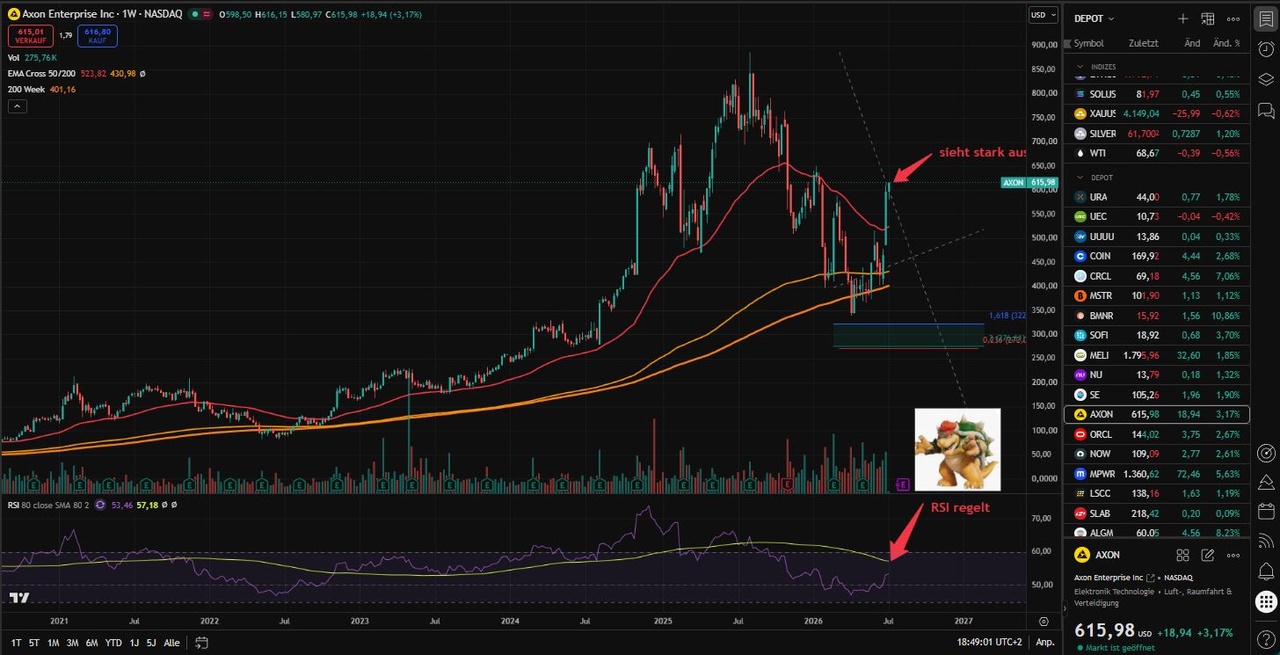
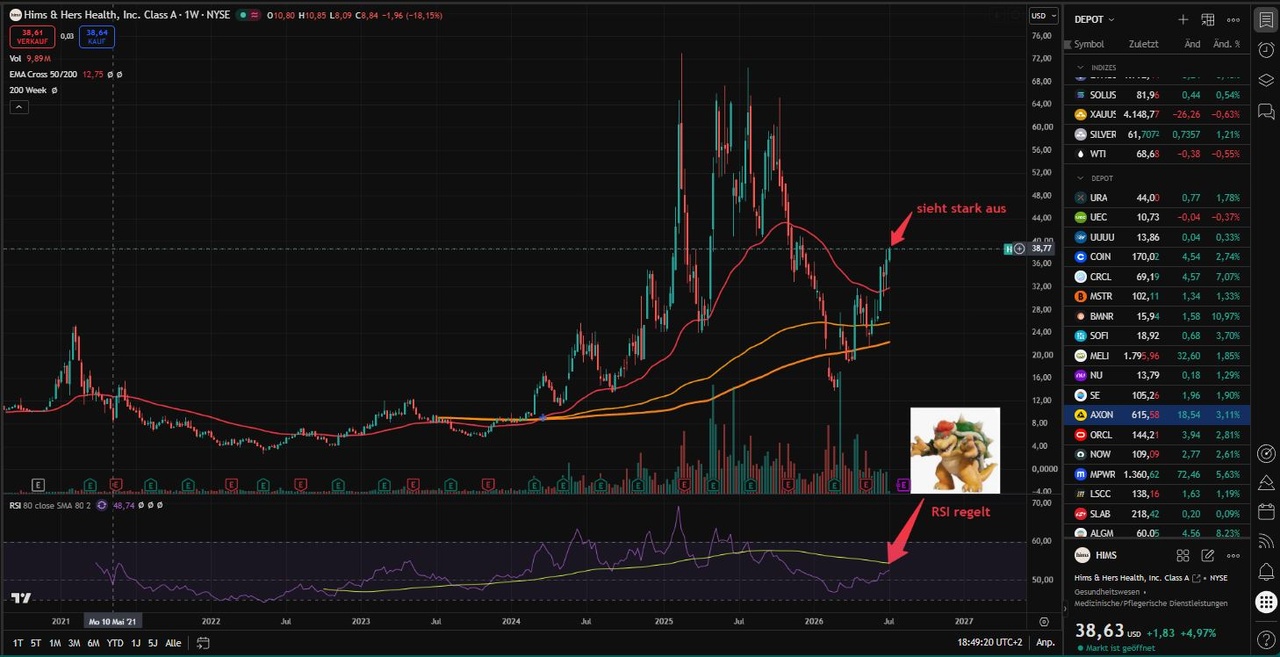
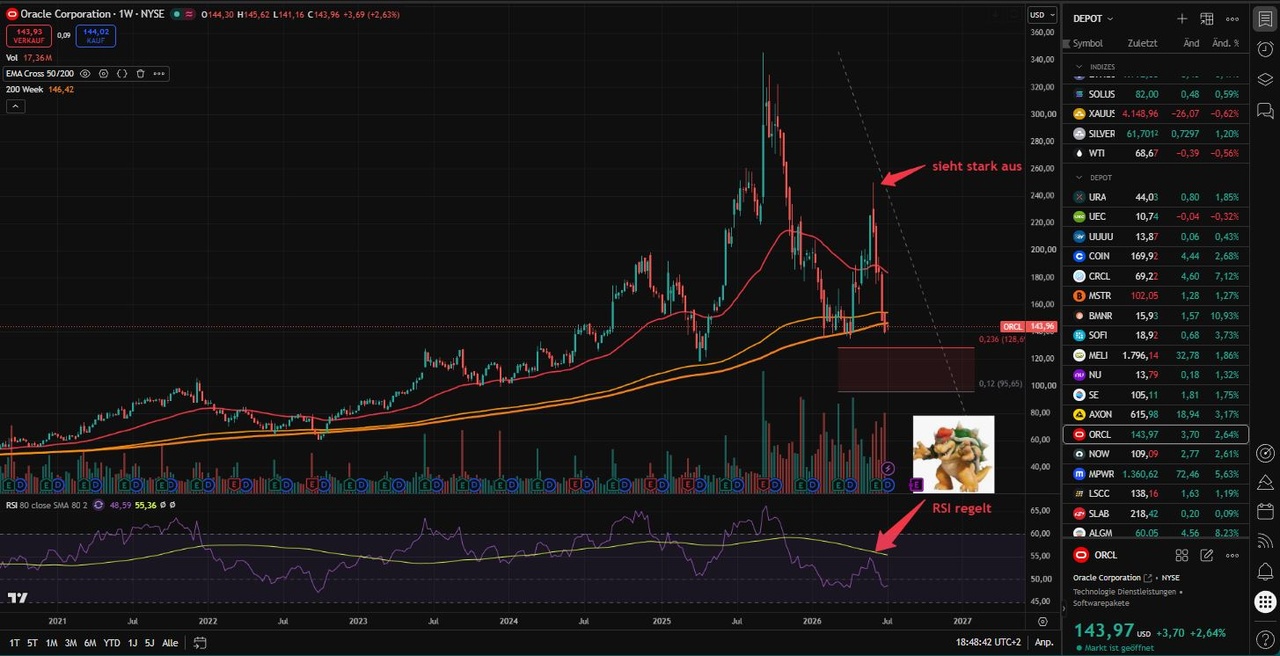
As described in the post below regarding the three different scenarios, the up/down scenario is the most tricky and suggests fakeouts. As $ORCL (-4.93%) we saw most recently now threatens to $AXON (+3.45%) and $HIMS (-1.15%) . I’m invested in Axon myself, but I’m not buying more yet. Why?
Same scenario as with $ORCL (-4.93%) . Oracle broke out of the 50s, but the RSI was still below the yellow moving average—which is essentially the final boss. I always affectionately call it “Bowser.” After hitting the RSI moving average, the price dropped significantly. (Fakeout confirmed)
This is exactly the scenario we’re seeing now with $AXON (+3.45%) and $HIMS (-1.15%) . The price suggests strength, including a breakout from the 50-week line, but Bowser is already waiting in the wings.
Instead, for both stocks, I’m keeping an eye on the price ranges they came from (Axon $320, Hims $15–20). So there could be good entry points this fall that you can take advantage of.
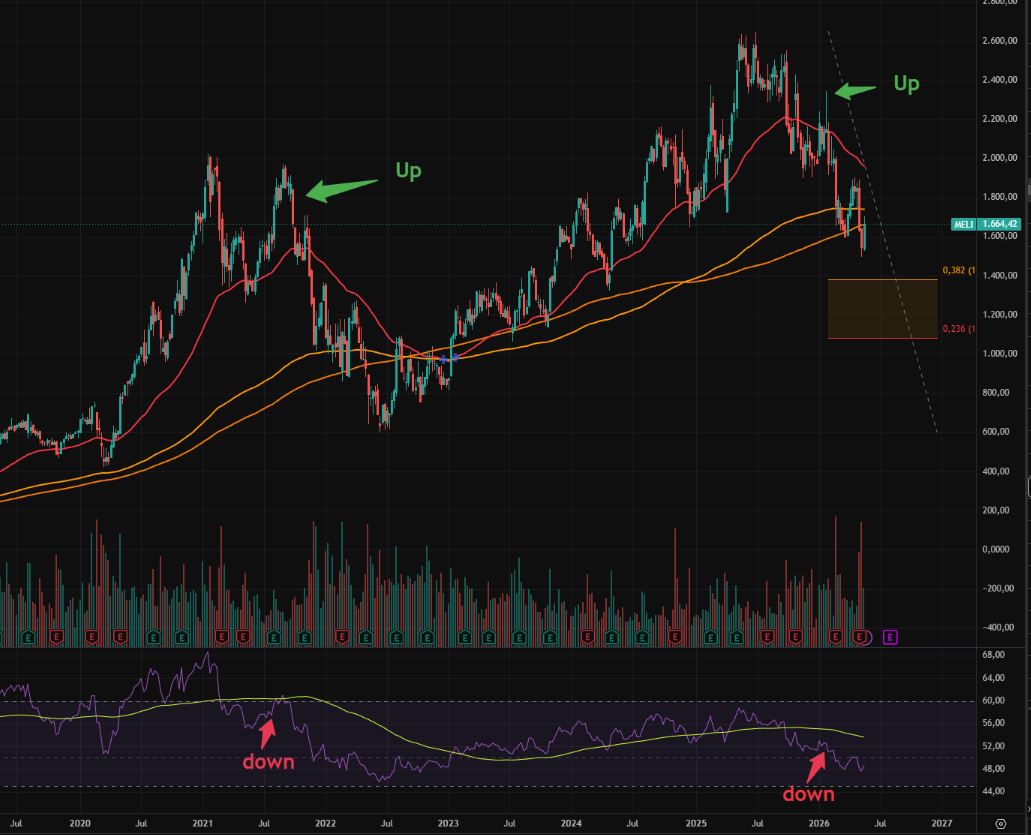
Today we are going back into the chart-based deep dive. Something that I have noticed again and again is the talk of a "falling knife" under various purchases. One should wait for the bottom to form first, without being able to tell the creator exactly what it is. That is why I am now going to go into this topic, where I believe there could be a legitimate bottom formation. The fact is that there is never any certainty on the market, only a game of probabilities. The higher these are, the better. The best way to profit from trends over 1, 2 or 5 years is to use the weekly chart and the 50-week line (shown in red below) as the main average to work with. This always serves as a mean reversion in a bullish trend. As long as the price is above it, the trend is intact. If the price breaks sustainably below it (2-3 weekly closes below it), the trend is broken. One asset that adheres particularly well to this is Bitcoin. Another point to increase its probability of success and to create a kind of confirmation is the weekly RSI. Here, too, there is an average line where the indicator is either above or below the average. These two values result in 4 possible states:
Up - Up (price and RSI above average) (trend following)
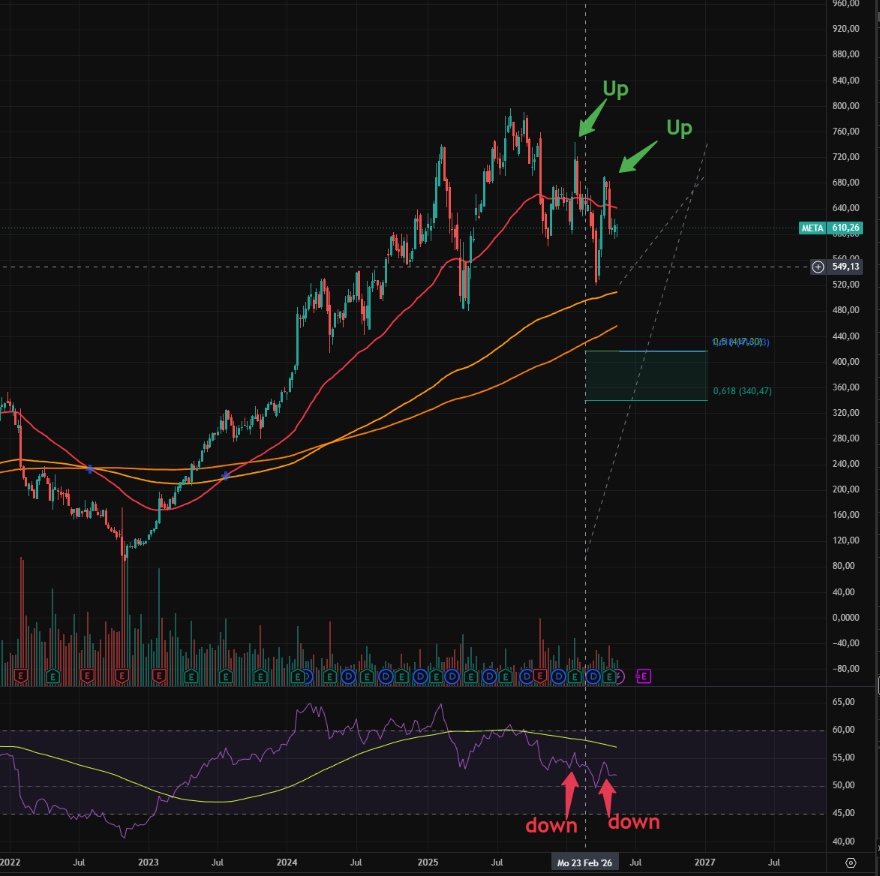
Up - Down (price above average - RSI below average) (fake-out risk)
Down - Up (price below average - RSI above average)
Down - Down (price below average - RSI below average) (wait and see, "falling knife")
The up - up scenario is virtually nothing other than the trend-following strategy, which is practiced by some. The exact opposite case (down - down) is the so-called bottom fishing. This is exactly where we find the purchases posted on Getquin, where people supposedly reach for the falling knife. I will now list the examples.
Up - Up (50s in red - RSI average yellow)
Currently: Krypro Miner, Energy, Semis
IREN
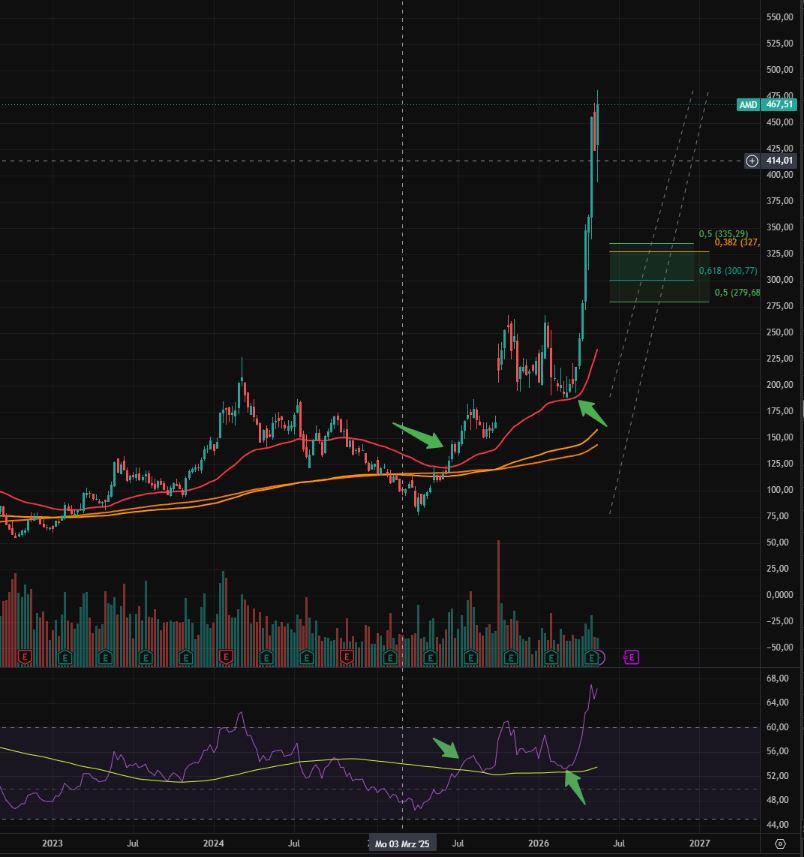
AMD
Such values are a trend follower's wet dream for a certain period of time. As long as both are above it, it is an easy hold.
But now we come to the main focus, the "falling knife" assets.
Down - Down (50s in red - RSI average yellow)
Currently: software, cloud, Bitcoin, Ethereum, e-commerce, neo-banks
Bitcoin (runs like Swiss clockwork)
Here you can see particularly well that up-up are always buy signals and down-down are always sell signals. As long as a value is in a down-down state, you can speak of a "falling knife" zone. You can buy here, but you don't have to. The technical chart confirmation, at least with a higher probability in my opinion, is always only present when there is a change to an upward trend. Bitcoin, software, etc. would therefore still not be a buy or buy later.
Bitcoin
IGV - Software ETF
SoFi
Wait and see, drink tea, wait for Up-Up
Special cases :
Up-Down
Cases where the price is above the 50 but below the RSI average have, in my opinion, a higher probability of "fake-outs" and are very deceptive and dangerous for buying or re-buying:
Example MeLi 2021 and 2026 (fake-out confirmed)
META (possible fake-out), even double
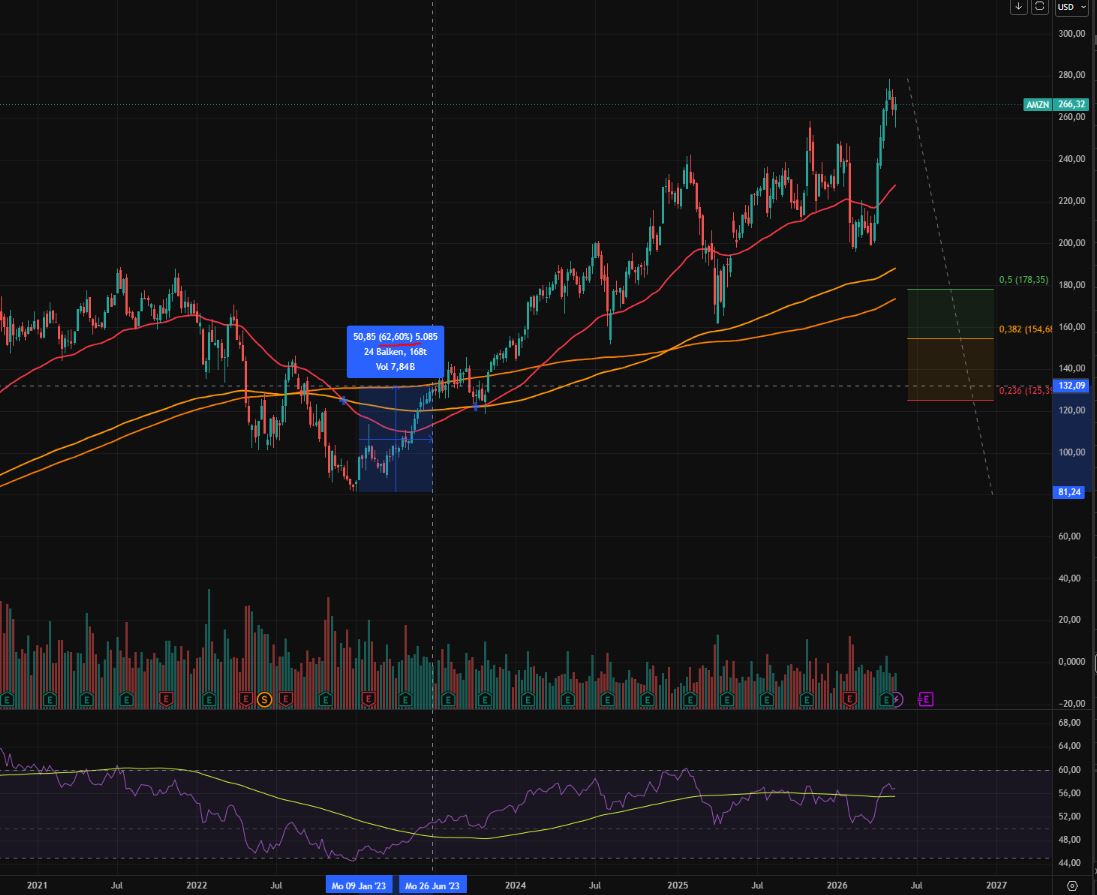
So how could we act now? Bottom fishing is fine if you accept further downside. If, on the other hand, you quickly get your panties in a bunch during corrections, the up-up signal would be something to work with. However, the up-up signal also has a price, namely the distance from the bottom to the up-up buy signal. I've looked through tons of charts and the return you give up is usually between 50-100%. It's more or less a deal: you forgo the first 50-100% return in the next trend, but you buy a kind of confirmation through the buy signal. Finally, here are a few examples of "yield sacrifice":
Bitcoin 2022
AMD
Amazon 2023
What do you think about this topic?
Do you also have indicators for buy signals or similar?
What is the bottom formation for you?
But for now, have a nice Whitsun. The weather is calling.


+ 6

The mood was so bad that many people predicted the company’s downfall and called it a “penny stock.”
That was a sign of total capitulation among retail investors—and a good time to buy more if you still believed in your investment thesis.
Looking back, I’m very proud that I actually dared to invest a somewhat larger amount.
You might want to hold onto the stock for now. Hims stock has risen 40% in 30 days because the company has reached a groundbreaking agreement with Novo Nordisk to sell Novo Nordisk’s highly sought-after GLP-1 weight-loss drugs, such as Wegovy and Ozempic, directly through its own platform. $HIMS (-1.15%)
Markets are unpredictable.
You can’t know when they’ll top, bottom, or reverse.
What you can do is read the trend.
That’s where Elliott Wave and Fibonacci can help: not to predict the future with certainty, but to understand whether a stock or index is in an impulse, a correction, or a reversal zone.
For long-term investors, this is useful for timing trims, adds, and re-entries.
Not for trading every move, but for managing capital better.
And yes, no capital gains tax would make technical analysis much easier.
But in the real world, taxes matter — so for strong growth names, fundamentals still count a lot.
There’s no perfect timing.
Only better probabilities.
$NBIS (-8.2%)
$RKLB (-1.54%)
$OSCR (+0.64%)
$NOVO B (+2.53%)
$HIMS (-1.15%)
$SOFI (+1%)
$UNH (+0.87%)
$ASTS (+0.67%)
$ETH (-4.47%)
$GOOG (-3.21%)
$DLO (-1.21%)
$AMZN (-11.03%)
$BTC (-2.79%)
$ISP (-0.8%)
$DGX (-6.14%)
$BABA (-1.67%)
Top creators this week