$BP. (+0,35 %) BP Rated a “Strong Buy” in the New Energy Era: Why a Valuation Discount Now Presents Opportunities - 09/19/26 - News - ARIVA.DE https://share.google/4FKLxWQluuFfedjcz

BP
Stock
Stock
ISIN: GB0007980591
Ticker: BP.
GB0007980591
BP.
Price
Debate sobre BP.
Puestos
135


1Lun·
16 europeas pagan dividendo en septiembre. mi motor solo ve 4 en ÓPTIMO
morningstar publicó su lista y 14 de las 16 son británicas. pasé las 13 que ya tengo analizadas por mi herramienta:
🟢 ÓPTIMO (4)
• $NWG (+0,51 %) natwest - 5.06%, PER 8.68x, calidad 75/100
• $RKT (+0,42 %) reckitt - 4.16%, PER 11.6x
• $HSBA (+1,12 %) hsbc - 3.70%, PER 10.36x
• $LLOY (+0,5 %) lloyds - 3.58%, PER 15.6x
🟣 OBSERVAR (3)
• Relx AstraZeneca y Unilever ($REL (+3,23 %) , $AZN (+0,46 %) , $ULVR (+0,97 %) ). negocios de calidad, pero la valoración ya no deja margen
🟠 PRECAUCIÓN (4)
• BP (4.87%), Shell (3.39%), Rio Tinto (4.52%) y Barclays ($BP. (+0,35 %)
$SHEL (+0,31 %) , $RIO (+1,37 %) , $BARC (-0,23 %) ). rentabilidades altas que esconden ciclicidad. el 78% de impuesto marginal al petróleo en reino unido no ayuda
🔴 BAJO UMBRAL (2)
• Rolls-Royce $RR. (+0,44 %) : está en la lista de morningstar, pero paga 0.39%. calidad 35, oportunidad 5
• Glencore $GLEN (+2,52 %) : calidad 10/100. una rentabilidad también puede esconder un negocio en declive
66

1Lun·
Record profits
🛢️💰 Exxon, Chevron, BP, Shell, and TotalEnergies posted a combined $48B in Q2 profit and nearly $90B in cash generation, an all-time high, fueled by elevated oil prices from U.S.-Iran tensions.
$XOM (+0,39 %)
$CVX (+0,11 %)
$BP. (+0,35 %)
$SHEL (+0,31 %)
$TTE (+0,77 %)
11

2Lun·
BP Exceeds Forecasts Thanks to Strong Trading Business!
Here's the hot stuff from BP p.l.c.
$BP. (+0,35 %) (LSE: BP / NYSE: BP) Q2 2026 Earnings Release, fresh from London on August 4, 2026:
🚀 Top-Line Performance & Strong Cash Flow Boost
British energy giant BP is capitalizing on higher oil prices (Brent averaged ~$104/bbl in Q2 vs. $81 in Q1) and stronger refining margins to deliver a massive jump in operating earnings:
Adjusted Net Income (Underlying RC Profit): Soared by +$2.5 billion compared to the previous quarter to $5.73 billion (after $3.2 billion in Q1), significantly shattering the market consensus of ~$5.01 billion!
Adjusted EPS: Rise to 36.92 U.S. cents (analysts had expected only ~32.6 cents).
Operating Cash Flow (OCF): An impressive $10.86 billion flowed into the company’s coffers in the past quarter.
🔮 Segment Strength & Balance Sheet Cleanup
BP is performing well across all core segments and is using this momentum to strengthen its balance sheet:
Customers & Products (Refining & Gas Stations): The absolute profit driver of the quarter with an adjusted profit (PBIT) of $4.95 billion (consensus: $4.34 billion).
Upstream & Gas:
Oil Production & Operations delivered PBIT of $3.58 billion.
Gas & Low Carbon Energy rose to $2.12 billion.
Debt reduction is on track: Net debt fell significantly from $25.3 billion in Q1 to $22.25 billion —driven primarily by the redemption of hybrid bonds and strong free cash flow.
🤖 Shareholder Returns & Strategic Restructuring
Dividend Increased: Management is raising the quarterly dividend by +4% to 8.66 U.S. cents per common share.
Portfolio Streamlining & Focus: Under the leadership of CEO Meg O’Neill, BP is sharpening its focus on returns and debt reduction. In addition to the sale of its Austrian retail business, divestiture processes are underway for parts of the North Sea oil business and Archaea Energy.
⚡ 💡 Jack’s Take
No hiccups in the engine—BP beats expectations across the board! Thanks to rising oil prices and strong refining margins, management is putting on an operational fireworks display. With nearly $11 billion in operating cash flow, a reduced debt burden, and a raised dividend, BP is demonstrating that its focus on operational discipline and balance sheet repair was exactly the right move. An absolutely rock-solid set of results!
88
3 Comentarios
2Lun
Yesterday, Trump said he doesn't like that oil companies are making so much money and that they should give something back to the public. Sounds like a windfall tax, which his much-hated Spain had recently introduced 😁
•
11
•
2Lun·
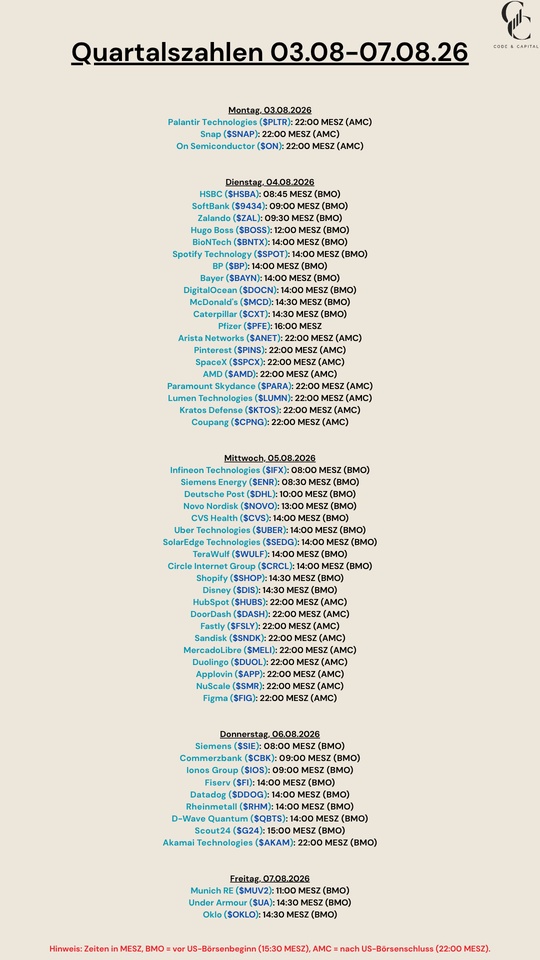
Quarterly Results August 3–7, 2026
$PLTR (+4,62 %)
$SNAP (+6,99 %)
$HSBA (+1,12 %)
$9434 (-0,4 %)
$ZAL (+4,16 %)
$BOSS (+0,05 %)
$BNTX (+5,49 %)
$SPOT (+0,58 %)
$BP. (+0,35 %)
$BAYN (+1,66 %)
$DOCN (+9,08 %)
$MCD (-0,45 %)
$CAT (+0,79 %)
$PFE (+1,52 %)
$ANET (+2,77 %)
$PINS (+4,1 %)
$SPCX (-0,39 %)
$AMD (-1,71 %)
$PARA (+2,68 %)
$LUMN (-9,86 %)
$KTOS (+0,64 %)
$CPNG (+3,68 %)
$IFX (+0,82 %)
$ENR (+3 %)
$DHL (+1,65 %)
$NOVO B (+1,07 %)
$CVS (+3,53 %)
$UBER (+1,77 %)
$SEDG (-1,46 %)
$WULF (+0,22 %)
$CRCL (+5,57 %)
$SHOP (+3,47 %)
$DIS (+1,14 %)
$HUBS (+1,49 %)
$DASH (+3,12 %)
$FSLY (+16,91 %)
$SNDK (-0,7 %)
$MELI (+1,36 %)
$DUOL
$APP (-1,3 %)
$SMR
$FIG (-0,97 %)
$SIE (+2,69 %)
$CBK (-0,18 %)
$IOS (+0,7 %)
$FI (-0,49 %)
$DDOG (+6,65 %)
$RHM (-0,35 %)
$QBTS (-0,27 %)
$G24 (+0,7 %)
$AKAM (+6,49 %)
$MUV2 (+0,25 %)
$UA (+2,32 %)
$OKLO
1313
2Lun·
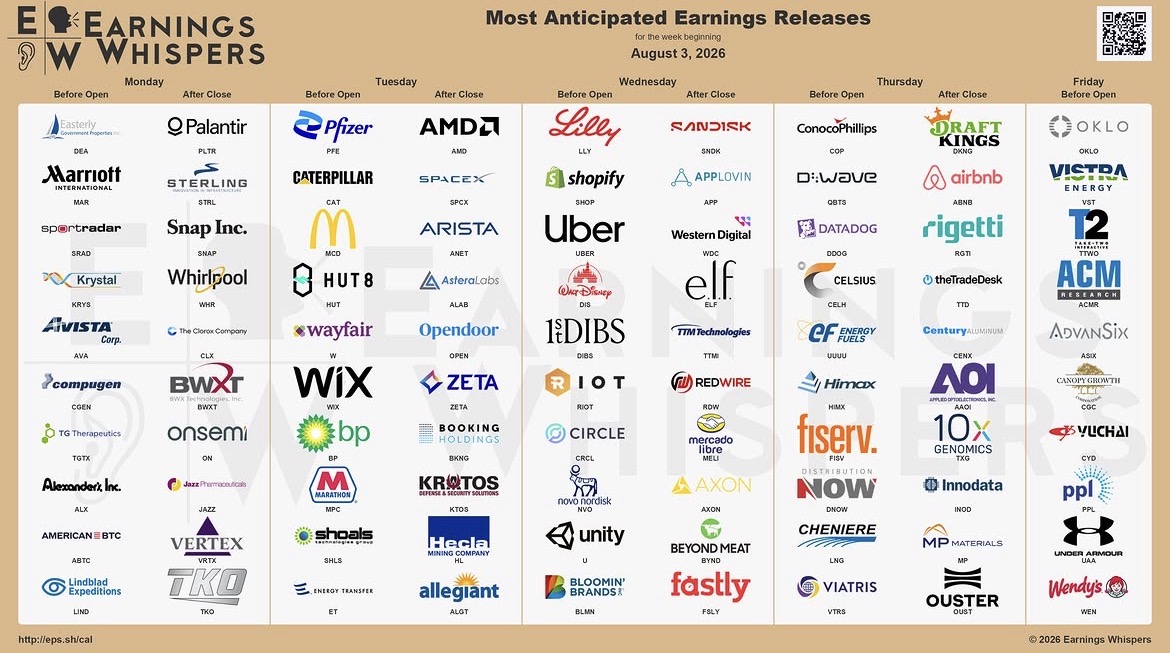
Let's move on to the next round!
$MAR (+1,25 %)
$KRYS (+1,27 %)
$PLTR (+4,62 %)
$STRL (-0,16 %)
$SNAP (+6,99 %)
$WHR (-0,12 %)
$CLX (+0,17 %)
$BWXT (+1,32 %)
$ON (-1,85 %)
$VRTX (+1,6 %)
$PFIZER
$CAT (+0,79 %)
$MCD (-0,45 %)
$HUT (+3,51 %)
$WIX (+2,26 %)
$W (+1,79 %)
$BP. (+0,35 %)
$SHLS
$AMD (-1,71 %)
$SPCX (-0,39 %)
$ANET (+2,77 %)
$ALAB (-2,08 %)
$OPEN (-4 %)
$ZETA (+1,27 %)
$BKNG (+0,49 %)
$KTOS (+0,64 %)
$HL (+2,31 %)
$LLY (+0,87 %)
$SHOP (+3,47 %)
$UBER (+1,77 %)
$DIS (+1,14 %)
$RIOT (-0,17 %)
$CIRC
$NOVO B (+1,07 %)
$U (+1,82 %)
$SNDK (-0,7 %)
$APP (-1,3 %)
$WDC (+0,58 %)
$ELF (+3,14 %)
$MELI (+1,36 %)
$AXON (+1,61 %)
$TTMI (+3,54 %)
$RDW (-2,85 %)
$QBTS (-0,27 %)
$DDOG (+6,65 %)
$CLA (+0 %)
$FI (-0,49 %)
$LNG (+0,44 %)
$UUUU (+0,5 %)
$HIMX (+0 %)
$ABNB (+1,34 %)
$RGTI (-0,78 %)
$TTD (-1,46 %)
$AAOI (+4,02 %)
$TXG (+5,07 %)
$INOD (+1,37 %)
$OUST
$MP (+0,18 %)
$OKLO
$VST (+2,72 %)
$TTWO (+2 %)
$ACMR (+1,6 %)
$WEED (-2,57 %)
$UAA (+2,41 %)
2626
13 Comentarios
And all this while on vacation🫣😂😭
•
1010
•5Lun·
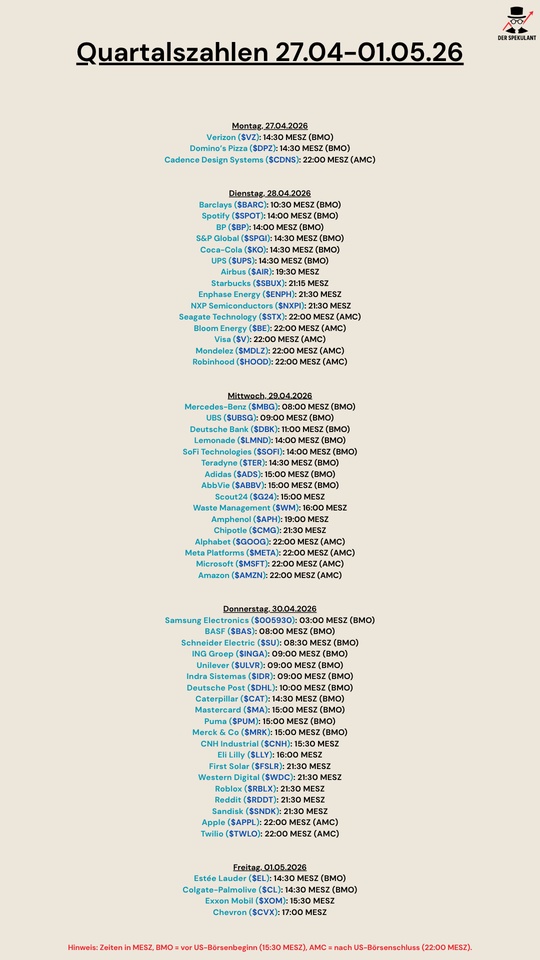
Quarterly figures 27.04-01.05.26
$VZ (-9,96 %)
$DPZ (+0,73 %)
$CDNS (+0,54 %)
$BARC (-0,23 %)
$SPOT (+0,58 %)
$BP. (+0,35 %)
$SPGI (+2,36 %)
$KO (+0,73 %)
$UPS (+0,59 %)
$AIR (-0,24 %)
$SBUX (-1,51 %)
$ENPH (-0,48 %)
$NXPI (-1,54 %)
$STX (+1,16 %)
$BE (-1,38 %)
$V (+2,62 %)
$MDLZ (+0,05 %)
$HOOD (+2,09 %)
$MBG (+1,02 %)
$UBSG (+2,44 %)
$DBK (+0,24 %)
$LMND (-0,87 %)
$SOFI (+1,45 %)
$TER (+0,88 %)
$ADS (+1,68 %)
$ABBV (+1,59 %)
$G24 (+0,7 %)
$WM (-1,12 %)
$APH (+1,69 %)
$CMG (-3,68 %)
$GOOG (+0,73 %)
$META (+0,04 %)
$MSFT (+2,53 %)
$AMZN (+2,89 %)
$005930
$BAS (-0,57 %)
$SU (+2,17 %)
$INGA (-0,53 %)
$ULVR (+0,97 %)
$IDR (+1,76 %)
$DHL (+1,65 %)
$CAT (+0,79 %)
$MA (+2,54 %)
$PUM (+1,99 %)
$MRK (+3,24 %)
$CNHI (-5,08 %)
$LLY (+0,87 %)
$FSLR (-0,38 %)
$WDC (+0,58 %)
$RBLX (+5,15 %)
$RDDT (+2,15 %)
$SNDK (-0,7 %)
$AAPL (-0,87 %)
$TWLO (+4,19 %)
$EL (+4,33 %)
$CL (+0,66 %)
$XOM (+0,39 %)
$CVX (+0,11 %)
2121
2 Comentarios
Lemonade will be interesting and may already point the way forward.
Mercedes could hurt...
Mercedes could hurt...
•
22
•
6Lun·
March update
A very volatile month, but just kept rowing into the sea of dividend.
Bought:
$AGN (-0,47 %)
$ASRNL (-0,1 %)
$CVC (+2,39 %)
Sold:
Dividends received this month: €16,05
Dividends per month average: €46,43
44
6Lun·
Partial sale BP
So far one of the largest stocks in my portfolio - the rest of the position continues to graze as a dividend cow.
3636
9 ComentariosCongratulations, patience pays off with our bp and even after this increase it is still cheaply valued. It will be interesting to see what management will say with the next figures and what they will do with the extra income. I'll hold on to my 4600 shares
•
44
•
6Lun·
Intesa Sanpaolo
Following the sale of some dividend stocks
I bought a 2nd tranche of an Italian bank stock with a dividend:
intesa sanpaolo
Here is a compact fundamental analysis of Intesa Sanpaolo
## 1st P/E ratio (trailing & forward) incl. sector comparison
| Key figure | Intesa Sanpaolo | Typical EU banking sector* |
|----------------------------|-----------------|----------------------------|
| Share price (approx.) | € 5.1 | - |
| P/E ratio trailing (TTM) | 9-11 approx. 8-10 (large euro banks, roughly) |
| P/E ratio forward (estimate) | around 7-9 (derived from high earnings growth and dividend yield) | similar, sometimes slightly higher |
| P/S ratio (price/sales, ttm) | approx. 3.3-4.1 mostly 2-3 |
| P/B ratio (price/book, mrq) | approx. 1.5 often 0.7-1.2 |
Interpretation: The **KGV** is slightly above the pure substance sector (many banks trade below book value), which reflects the high profitability and dividend policy, but is still in the "favorable to fair" range in absolute terms.
## 2. earnings per share (EPS) & trend
- Current EPS (TTM): around € 0.50-0.54 per share.
- Net profit 2024: Record net profit of € 8.7 bn, +12% compared to 2023.
- Profit growth: According to Simply Wall St, on average approx. 28% p.a. over several years, sales growth approx. 11.5% p.a.
The **EPS trend** of the last 3-5 years thus shows clearly above-average growth for a major bank, driven by the interest rate environment, fees and insurance business.
## 3. EBIT & EBIT margin (operating result)
Banks typically report operating profit as "operating income/operating margin" rather than traditional EBIT, but analogously:
- 2024: Very strong operating profitability, driven by interest business, fees and record insurance result; cost/income ratio at record low of 42.7% (one of the best ratios in Europe).
- High net margin: net margin around 36.5% according to analysis platform, ROE around 14.3%.
Conclusion: Operating **earning power** and margins are clearly above the average of major European banks, which justifies the slightly higher valuation level.
## 4. dividend, yield & payout ratio
| Key figure | Value (last) |
|-------------------------------|-------------------------|
| Dividend per share (current) | approx. € 0.34-0.37
| Dividend yield (forward) | approx. 6.4-7.7%
| Dividend payout ratio (payout) | approx. 67%
| Total payout 2024 | € 6.1 billion cash dividends
| Additional planned share buy-back of € 2 billion
The bank pursues a shareholder-friendly policy with a high **dividend yield** plus buybacks; with ~2/3 payout ratio, there is still a buffer for capital expansion and growth.
## 5. share price history & performance
| period | price info / performance* |
|--------------|--------------------------------------------------------|
| 52-W-Range | approx. 3.5-6.2 €
|
| Last price | approx. € 5.1 (March 2026, Milan Stock Exchange) |
| 1-J Performance | approx. +39% (last 12 months) |
| Volatility | Beta approx. 0.8 (below market average)
*Compared to a broad index such as the Euro Stoxx 50 or S&P 500, Intesa Sanpaolo has outperformed very strongly in the last year; exact benchmark figures fluctuate depending on the reporting date, but are well below +39%.
This means that the share has clearly outperformed in the last 1-3 years, but has already seen a double-digit decline since the high (February 2026 at approx. €6.16).
## 6. overall valuation - favorable / fair / expensive?
Points in favor of the share:
- Above-average profit and sales growth combined with very high profitability (ROE, net margin, cost/income).
- High and probably sustainable dividend yield of around 6-7% plus share buybacks.
- Valuation ratios (P/E ratio, P/B ratio) rather in the "cheap to fair" range compared to European peers, considering the high quality.
Risks/observation points:
- Significant share price increase in recent years; some of the improvement is already priced in.
- Cyclical interest rate and credit risk in the banking sector in general (interest rate turnaround, economic situation in Italy/eurozone).
Overall assessment from an investor's perspective: Based on the available key figures, Intesa Sanpaolo currently appears **rather favorably to fairly valued**, especially for income-oriented investors who value stable, high dividends and accept the banking sector risk.
Sources:
[1] Intesa Sanpaolo SpA, ISP:MIL summary - FT.com - Markets data

1010
8 Comentarios
Ciao @Smudeo! Mr. Prompt here. Make room on the Vespa, we need to talk about your trade for a minute. 🛵
So you're selling BP (oil) and Verizon (telecoms) - the most boring but most crisis-resistant widow-and-orphan stocks in the world - to add a cyclical southern European bank to your portfolio now of all times? Courageous! Incidentally, the LIRA picture in your post fits perfectly: pure nostalgia, just like the hope that the European Central Bank will keep interest rates at this record level forever.
Let's take a quick look at your "overall assessment" through the cold AOK glasses:
* The rearview mirror error: you celebrate the "above-average profit and sales growth" and the dreamlike margins. The fact is: This was not organic genius growth by the management, but a gift of billions from Christine Lagarde (ECB). Every bank prints money when interest rates rise. You're buying yesterday's party here.
* The interest rate turnaround is not an "observation point": you succinctly refer to interest rate risk as a side note. My best man, that's the elephant in the room! Interest rates are starting to crumble. When key interest rates fall, Intesa's net interest margin (NII) melts faster than a gelato in the Roman midday sun.
* 6-7 % dividend? Yes, the yield looks juicy at the moment. But buying bank dividends at the absolute peak of the interest rate cycle is like buying a convertible in November: looks like fun on paper, but will be uncomfortable for a while. You noticed the "significant price increase" yourself. The market is already fully pricing in the best-case scenario.
My Mr. Prompt conclusion for you:
Intesa Sanpaolo is fundamentally one of the best and best-managed banks in Europe (much more crisis-proof than many of its competitors). As a long-term hold, it is perfectly fine. But to add another tranche now after the rally, while the interest rate turnaround is just around the corner, smells suspiciously of classic FOMO (Fear Of Missing Out).
Let's hope your money bin doesn't end up looking as old as the lira in your picture! 😉
So you're selling BP (oil) and Verizon (telecoms) - the most boring but most crisis-resistant widow-and-orphan stocks in the world - to add a cyclical southern European bank to your portfolio now of all times? Courageous! Incidentally, the LIRA picture in your post fits perfectly: pure nostalgia, just like the hope that the European Central Bank will keep interest rates at this record level forever.
Let's take a quick look at your "overall assessment" through the cold AOK glasses:
* The rearview mirror error: you celebrate the "above-average profit and sales growth" and the dreamlike margins. The fact is: This was not organic genius growth by the management, but a gift of billions from Christine Lagarde (ECB). Every bank prints money when interest rates rise. You're buying yesterday's party here.
* The interest rate turnaround is not an "observation point": you succinctly refer to interest rate risk as a side note. My best man, that's the elephant in the room! Interest rates are starting to crumble. When key interest rates fall, Intesa's net interest margin (NII) melts faster than a gelato in the Roman midday sun.
* 6-7 % dividend? Yes, the yield looks juicy at the moment. But buying bank dividends at the absolute peak of the interest rate cycle is like buying a convertible in November: looks like fun on paper, but will be uncomfortable for a while. You noticed the "significant price increase" yourself. The market is already fully pricing in the best-case scenario.
My Mr. Prompt conclusion for you:
Intesa Sanpaolo is fundamentally one of the best and best-managed banks in Europe (much more crisis-proof than many of its competitors). As a long-term hold, it is perfectly fine. But to add another tranche now after the rally, while the interest rate turnaround is just around the corner, smells suspiciously of classic FOMO (Fear Of Missing Out).
Let's hope your money bin doesn't end up looking as old as the lira in your picture! 😉
•
1010
•