$D05 (-0,35 %) Hello
Completely unexpectedly, I received a dividend from the DBS Group today.
It wasn't announced here or in the share finder, nor is there any sign of it now.
Is anyone else feeling the same?
Regards
Dirk

Puestos
77$D05 (-0,35 %) Hello
Completely unexpectedly, I received a dividend from the DBS Group today.
It wasn't announced here or in the share finder, nor is there any sign of it now.
Is anyone else feeling the same?
Regards
Dirk

About a handful of countries have no withholding tax at all or levy one so low that it is almost unnoticeable.
"These countries in which private investors in Germany are not subject to withholding tax include Ireland, Liechtenstein, Hong Kong and Singapore," says Stefanie Dyballa, Portfolio Manager at KSW Vermögensverwaltung in Nuremberg.
However, the Irish withholding tax is only low if the company is based in the country. Other countries with investor-friendly regulations are Bermuda, Brazil, Canada and Thailand.
However, the most important economy that leaves German shareholders untouched is the United Kingdom. "The UK has many attractive dividend payers to offer, especially in the energy and financial sectors," says the asset manager, naming the likes of $SHEL (+0,25 %) Shell, $BP. (+2,21 %) BP and $HSBA (+2,86 %) HSBC.
Hermann Ecker, authorized signatory and portfolio manager at Bayerische Vermögen in Bad Reichenhall, also immediately thinks of reliable dividend payers from the island, including $DGE (+0 %) Diageo, $RKT (+0,96 %) Reckitt Benckiser, $RIO (+3,23 %) Rio Tinto, $IMB (+2,23 %) Imperial Brands, $SGE (-3,54 %) Sage Group and $ULVR (+0,6 %) Unilever. The selection shows just how diverse the withholding tax-friendly UK capital market is.
However, it is worthwhile for investors to consider other companies in addition to the well-known names: Sometimes they offer even higher dividend yields. WELT has compiled a list of 19 shares that are listed in countries with zero or low taxes and have also shown a stable performance over the past twelve months.
The last criterion is intended to protect investors from falling into a value trap, i.e. investing in a company with an eroding business model. The British drinks group Diageo, for example, is regarded as a solid dividend payer, but its share price has fallen by a third over the past year. The Diageo dividend yield of just under five percent is little consolation.
By contrast, the British insurance giant $AV. (+2,35 %) Aviva. The London-based company has roots dating back to 1696 and is one of the leading providers of pensions and insurance in its core markets of the UK, Ireland and Canada. Thanks to a focus on cash generation, Aviva is considered a solid basic investment that currently offers its shareholders a dividend yield of around 5.5%, which is only reduced by the German capital gains tax plus solidarity surcharge.
The financial services provider Legal & General, founded in 1836, can also look back on a long tradition. $LGEN (+1,46 %) Legal & General can also look back on a long tradition. As a heavyweight in the areas of asset management and pension insurance, the London-based group has a comparatively cyclically resistant business model that benefits from long-term demographic trends. Shareholders receive a current yield of 8.5 percent, making Legal & General one of the highest-yielding stocks in the UK index. The same can be said of the $PHNX (+1,04 %) Phoenix Group, whose yield is an impressive 7.8 percent.
The mining group $RIO (+3,23 %) Rio Tinto. However, the company is benefiting from the global appetite for raw materials. Rio Tinto is one of the world's largest producers of iron ore, aluminum and copper. Investors are betting on the indispensable role of metals in the global energy transition. The dividend payout is four percent.
The yield is more than twice as high for the Brazilian competitor $VALE3 (-0,18 %) Vale. Founded in 1942, the Rio de Janeiro-based mining group is the largest nickel and iron ore producer in the world. Experience shows that the size of the dividend depends on the ups and downs of commodity prices. As these are currently pointing upwards, shareholders have a good chance of achieving a dividend yield of almost ten percent on their capital investment this year. There is no withholding tax.
More speculative are investments in Greek financial institutions such as $TELL (-2,39 %) National Bank of Greece. The bank was on the brink of collapse during the euro debt crisis and had to be rescued with state aid. However, business is now flourishing again. Thanks to this economic comeback and the adjusted balance sheet, shareholders of National Bank of Greece should be hoping for a dividend yield in the region of four to five percent.
Financial institutions are also among the most interesting investments in Asia. The city state of Singapore, which does not levy withholding tax and is considered one of the most stable financial centers in the world, is home to the $D05 (-0,35 %) DBS Group. Founded in 1968, the institution is considered one of the best banks in the world and has already been described as the "Fort Knox" of the Asian banking world. Investors appreciate the quarterly distribution, which amounts to four percent per year, and the conservative balance sheet management of the DBS Group.
The Oversea-Chinese Banking Corporation, founded in 1932, also offers a return of around four percent. $OVCHY Oversea-Chinese Banking Corporation, founded in 1932. It is the longest established bank in Singapore and offers a mix of banking, asset management and insurance, which speaks for diversified earnings. However, the Oversea-Chinese Banking Corporation is not quite as dynamic as the DBS Group.
The conglomerate $J36 (-1,75 %) Jardine Matheson has its roots in Hong Kong, but the shares are now listed in Bermuda. Founded in 1832, the company is a legend in Asian economic history with a broadly diversified portfolio ranging from real estate to retail. Little known: The financial services provider $IVZ (+3,63 %) Invesco, which stands for the most popular Nasdaq ETF QQQ. The investment company's shares have risen by almost half over the past twelve months and also offer a dividend yield of three percent.
If you want to invest specifically in Hong Kong, you can stick with the infrastructure group $1038 (+1,11 %) CK Infrastructure. Founded in 1996, the company belongs to the empire of tycoon Li Ka-shing. It invests globally in energy suppliers, waterworks and transportation infrastructure, which ensures stability. Investors receive a return of around four percent.
As far as the former British crown colony is concerned, Dyballa has other ideas: "Financial and telecommunications stocks listed in Hong Kong, such as the $3988 (-0,63 %) Bank of China and $941 China Mobile often offer stable and attractive dividends." And she also has a tip for Singapore: "Real estate stocks or REITs that are less well-known in this country also offer stable cash flows and high dividend yields," says the portfolio manager.
Source: Text (excerpt) WELT, 24.01.26

After the annual rewind, here is December
#rewind #december25
Top Movers
$SLVY (+3,8 %) +22,2%
$DG (+0,83 %) +21%
$ENPH (+4,66 %) +13%
$8031 (+1,62 %) +11,2%
$D05 (-0,35 %) +7,6%
Top Loosers
$HIMS (-1,23 %) -18,4%
$AVGO (+6,74 %) -14,7%
$MPW (+1,22 %) -14,4%
$YMST -12,5%


I'm currently in Singapore and what can I say... I'm really excited about this city!
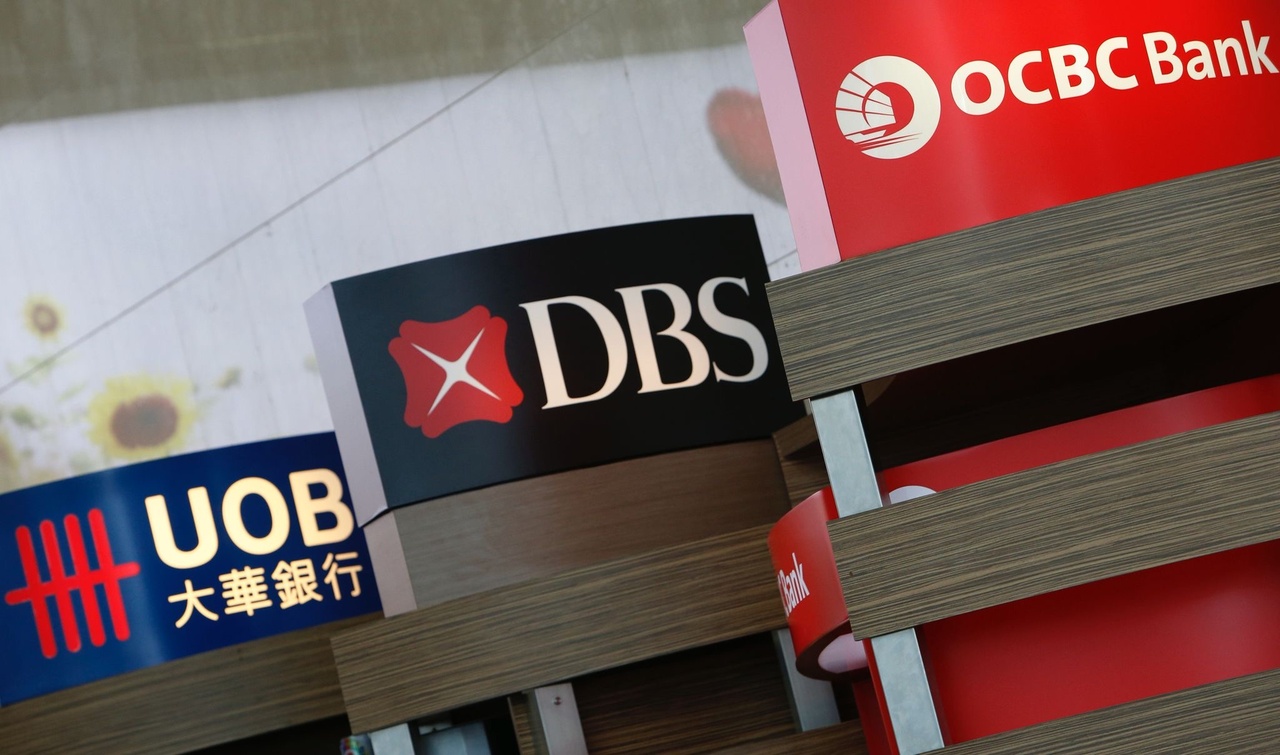
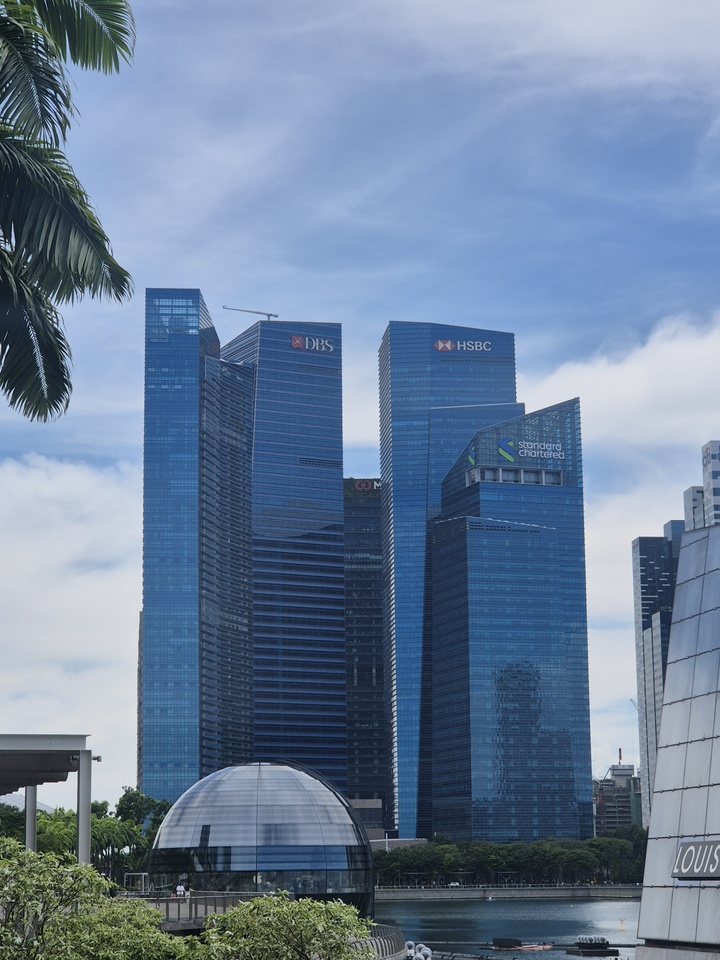
From the financial district with all the famous banks like: $D05 (-0,35 %)
, $U11 (+0,41 %) , $O39 (-0,61 %)
,$HSBA (+2,86 %) , to the mix of modern architecture 🏛️ green oases 🌴 and incredible efficiency🚊
The exciting thing for me as an investor is that these banks are not just impressive buildings, they are also part of my portfolio.
In 2025 alone, they have saved me a total of around 815 € in net dividends so far. At the end of November, I will receive a further €90 from DBS and €17 from HSBC in December.
It's nice to think that my investments have literally helped finance my trip to Singapore. 🏝️📈
(Dividends from my ETFs are not included here, by the way 😉)
#Dividenden
#FinanzielleFreiheit
#Singapore
#DBS
#OCBC
#UOB
#HSBC
#Maybank
#GetquinCommunity

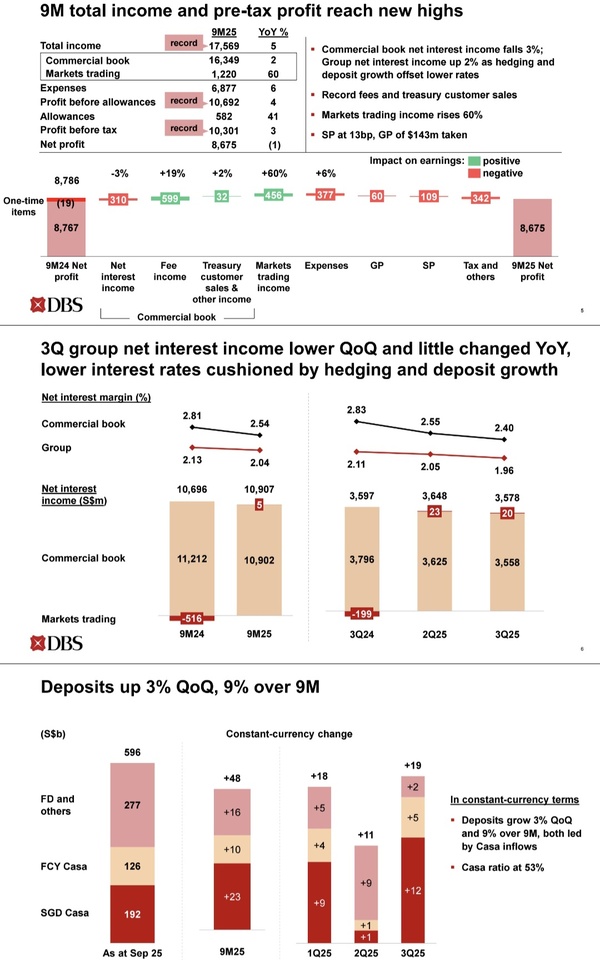
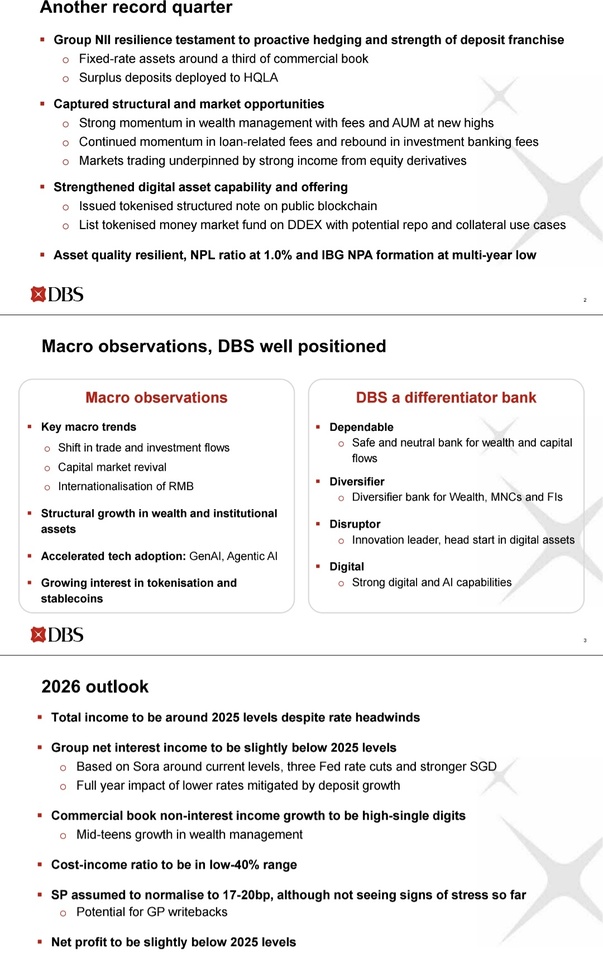
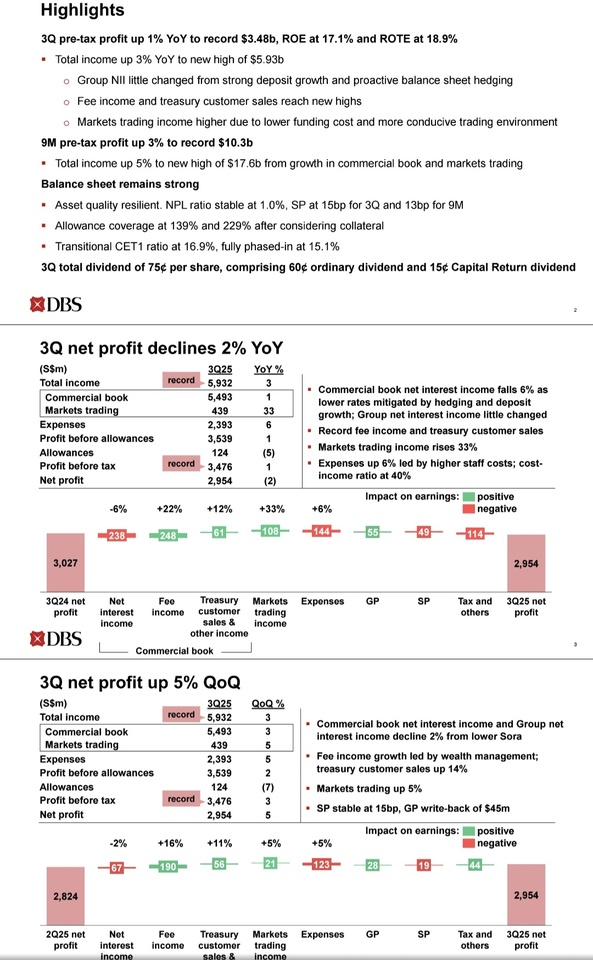
DBS Group Holdings $D05 (-0,35 %) Southeast Asia's largest bank, has published its figures for the third quarter of 2025. Despite a slight decline in profits, the bank remained robust.
Net profit fell by 2% to SGD 2.95 billion, compared to SGD 3.03 billion in the previous year. Net interest income remained almost stable at SGD 3.58 billion. At SGD 8.68 billion, the profit for the first nine months is only just below the record figure of the previous year. Earnings per share also remained almost unchanged.
Despite the minimal decline, the market reacted positively: the share price rose by around 3.5% after the figures and reached a new record high of SGD 55.37. Analysts particularly praised the stable earnings situation and efficient cost management in an environment of increasing risks and slightly declining margins.
DBS has thus once again confirmed its reputation as a reliable dividend stock with a strong business model and solid balance sheet - a rock in the surf of the Asian banking sector.
Singapore 2025 🇸🇬
📈 Performance:
S&P500: +2.80%
MSCI World: +2.60%
DAX: -0.09%
Dividend portfolio: +0.74%
My high and low performers in September were (top/flop 3):
🟢 ($TSLA (+4,32 %) ) Tesla +33.20%
🟢 ($UNH (+5,91 %) ) UnitedHealth +14.25%
🟢 ($D05 (-0,35 %) ) DBS +12.94%
🔴 ($DTE (-0,74 %) ) Deutsche Telekom -8.29%
🔴 ($TSCO (+1,69 %) ) Tractor Supply -9.43%
🔴 ($TXN (-1,53 %) ) Texas Instruments -10.30%
Dividends:
September 2025: € 203.56
September 2024: € 140.14
Change: +45.26%
Sales:
🟥 ($T (-0,95 %) ) AT&T (27 shares) +36.05%
Purchases:
🟩 ($2318 (-0,52 %) ) Ping An Insurance (150 pcs.)
🟩 ($UNP (+0,22 %) ) Union Pacific (3 shares)
Savings plans:
What else has happened?
As announced, I asked the tax office to recalculate the advance payments. This was done and fortunately I no longer have to pay anything in advance.
If things go well, I'll even get some money back next year.
The bill for the car has also arrived and amounts to €1500. But that really pays for everything.
My nest egg has melted down to €900 and now I have to build it up again. Once again, the target is €10,000.
I was on vacation in Egypt from the end of September until last weekend. As always, it was super nice and just pure relaxation.
🥅 Destinations 2025:
Deposit of €10,000 and thus a custody account volume in the share portfolio of ~€73,000
Target achievement at the end of September 2025: 69.19%
How was your September?
If you liked the report and would like to read more, feel free to follow me,
If you're not interested, you can keep scrolling or use the block function.
I would like to start a completely new portfolio that will primarily revolve around dividends.
As a core I was thinking of $TDIV (+1,54 %)
Would you say this is a good core?
If not I would add $VHYL (+1,77 %) add.
Additionally I would like to have a CC ETF as a kind of support, probably $JEGP (+0,47 %) and or $SXYD (+1,51 %)
I would like to represent the NASDAQ with $EQQQ (+2,47 %) but I will represent it with $ASML (+5,2 %) and $2330 will be added.
Allianz $ALV (+1,33 %) and Munich Re $MUV2 (+0,97 %) I definitely want to include, but they are too expensive for me financially, so I was thinking of the $EXH5 (+1,08 %)
Oil shares are represented by $VAR (+1,95 %) and one more.
Do you have any recommendations?
I am thinking about $CVX (+0,46 %)
$EQNR (+3,87 %) and $PETR4 (+1,31 %)
I would also like renewable energies, but I'm not familiar with them.
Do you have any suggestions?
Becoming a defensive company $ULVR (+0,6 %)
$D05 (-0,35 %)
$O (-0,42 %) and of course $NOVO B (+9,95 %) Being.
$BATS (+1,63 %) I already have in a portfolio, would it be too much of a lump to add $MO (-0,58 %) to add to it?
I still have $KHC (+0,17 %) on the watchlist but the split is not going so well, would it be wise to start with a savings plan?
Apart from that $RIO (+3,23 %)
$NKE (+1,93 %)
$1211 (+4,25 %)
$SOFI (+11,7 %) and $HAUTO (+3,18 %) will be represented with smaller positions.
What is your opinion?
Would you improve anything?
What else would you add, especially in EE and defensive stocks?
Feedback is very important to me here, so far I have just been wandering aimlessly around the stock market without a fixed plan and strategy.
This is my first attempt to build something serious.
Greetings to all Getquins out there!
I'm currently doing some research on dividend stocks in Asia. As I am currently only invested in Japan but would like to expand my Asian holdings a bit more, I have looked around in another country that is certainly not uninteresting in terms of equities and also does not carry too much country-specific risk (like China, for example) .... namely SINGAPORE 🇸🇬.
And what is Singapore so well known for ... its financial sector, of course. Now the $D05 (-0,35 %) is already quite well represented in the community here, so naturally it also made the list. But there are also $U11 (+0,41 %) and $O39 (-0,61 %) are also on my list. Are there already investors here who are invested in one of the stocks or what else do you think about the two banks? An alternative to $D05 (-0,35 %) ? Or do you have other stocks from the city state in your portfolio?
$D05 (-0,35 %) Hello, I have a question. I was shown a dividend of €0.50 in August at getquin and only €0.10 at Trade Republic. How much did you receive?
I am currently still looking for a good stock in the financial sector / banking sector that has good growth and also a dividend of over 2% and is a sensible addition to my portfolio. I am more interested in stocks outside Germany.
Currently on my watchlist: $ISP (+1,25 %) , $WFC (+1,75 %) , $D05 (-0,35 %) , $LLBN (+0 %)
I'd love to hear your opinions and any other suggestions.
Thank you in advance!!!
Principales creadores de la semana