
June was marked by a Fed shock and a rotation away from the winners of the previous months. On June 17, the Fed, under its new chair Kevin
Warsh , the Fed kept interest rates at 3.50–3.75%, the dot plot signaled a possible rate hike rather than a cut—after months of hopes for easing —a real blow to the markets. On top of that came a bombshell regarding defense stocks: The Ministry of Defense scrapped the multi-billion-euro F126 frigate program, and Rheinmetall $RHM (+2,1 %) subsequently lost over 16% —one of the stock’s worst trading days in decades. While speculative and cyclical stocks were sold off, investors fled to quality: defensive large-cap stocks and established software stocks held up significantly better.
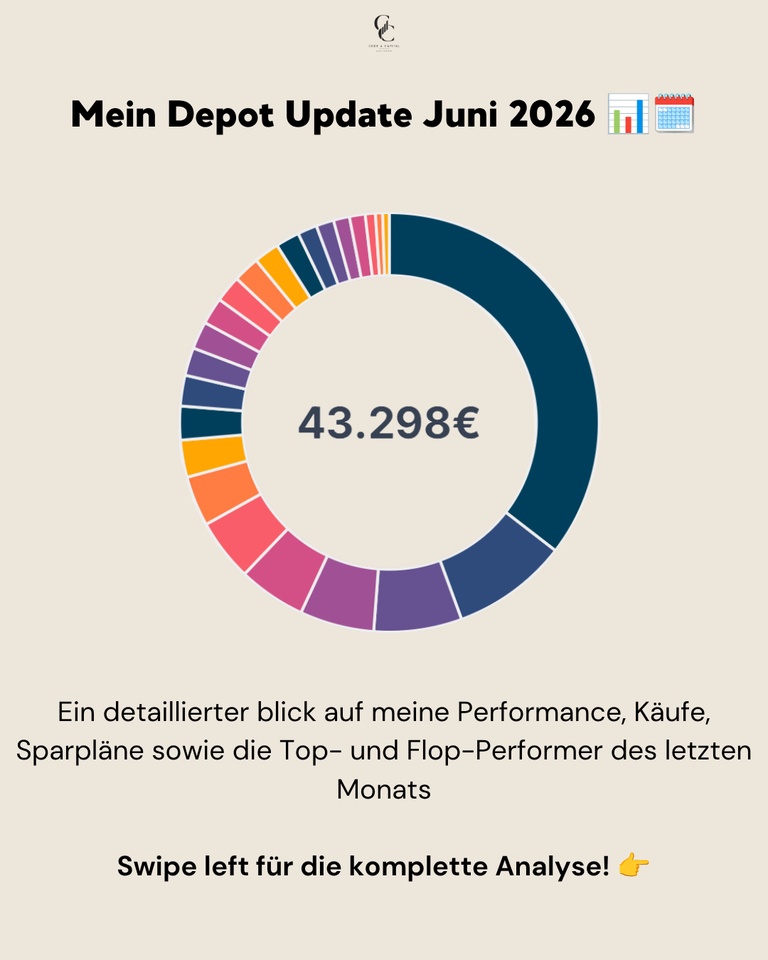
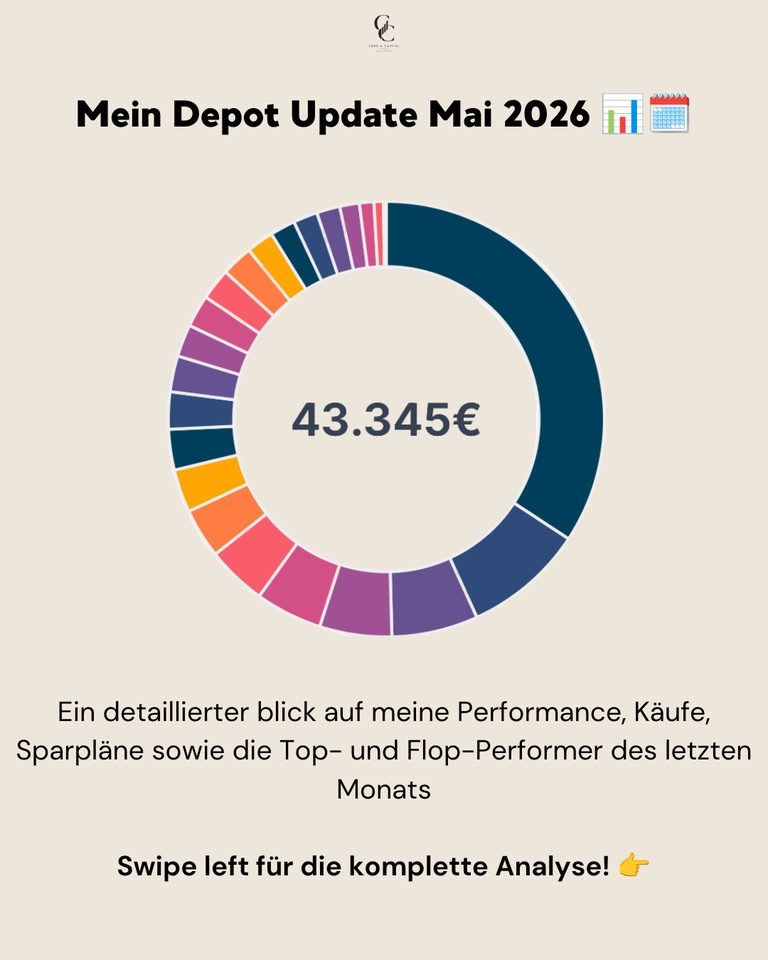
In line with this more selective market environment, my portfolio slipped slightly into the red but held up more robustly than the DAX and Nasdaq:
📊 Monthly performance: -0.39%
📊 Portfolio value: ~€43,298
📊 Peak performance (Jan. 6, 2022): +39.16%
📊 YTD performance: ~+7.68%
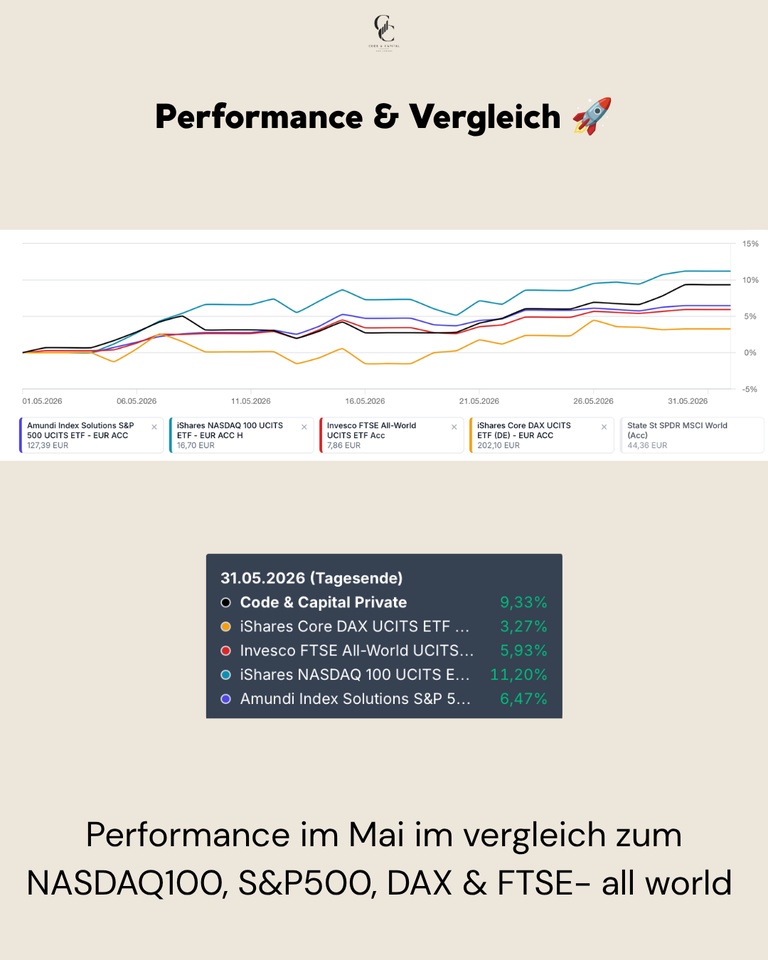
Performance & Comparison 🚀
June was a month of contrasts: While the DAX and Nasdaq suffered from the Fed shock and the rotation out of risk assets, the S&P 500 and FTSE All-World held up significantly better thanks to their broader, more defensive composition. My portfolio was in the middle of the pack at -0.39%—more stable than the DAX and Nasdaq, but weaker than the two broad U.S. and global indices.
Performance Comparison (June 1–June 30, 2026, end of day):
My portfolio: -0.39%
FTSE All-World: +1.24%
S&P 500: +0.85%
DAX: -0.53%
NASDAQ 100: -0.96%
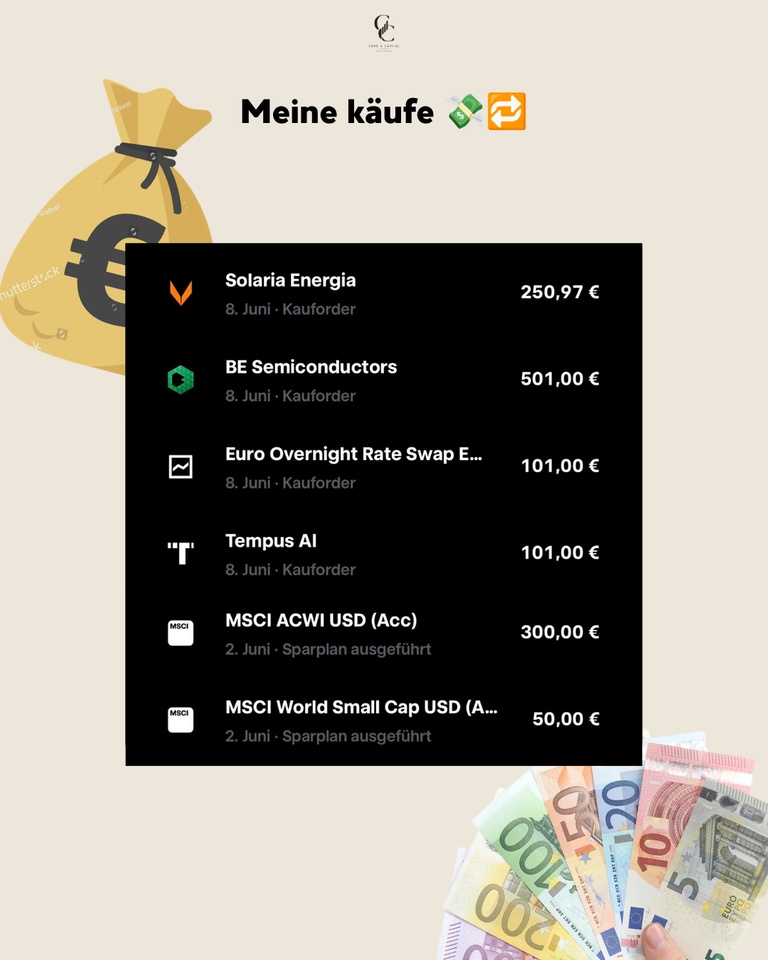
Purchases, Sales & Allocation 💶
In June, €300.00 was invested in the MSCI ACWI USD (Acc) $ACWI and €50.00 into the MSCI World Small Cap $WSML via the ongoing savings plans. The following were added via buy orders: Solaria Energia $SLR (€250.97), BE Semiconductors (€501.00), a Euro Overnight Rate Swap ETF (€101.00), and Tempus AI $TEM (€101.00).
On the selling side, I took profits on two positions in which I’ve been a shareholder for a good two years: In Datadog $DDOG (-1,74 %) , I closed out the entire position after the stock had performed strongly in recent months. With Snowflake $SNOW (-0,64 %) , I sold about a quarter of the position and am holding onto the rest. Both were purely profit-taking after a strong run; there has been no fundamental change in my assessment of the companies.
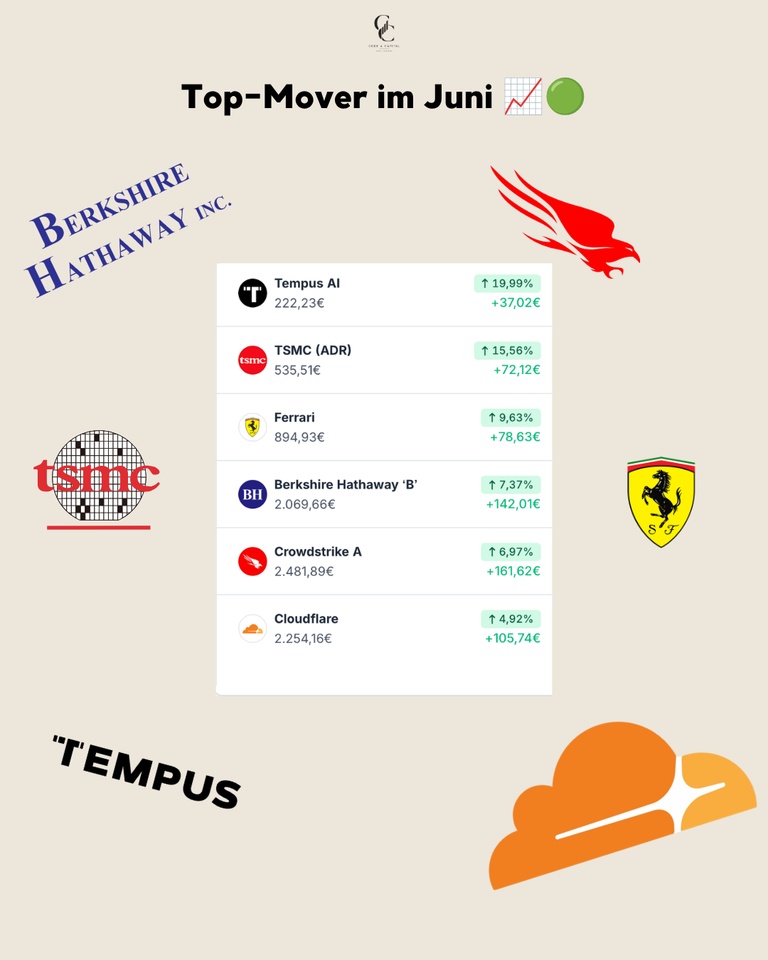
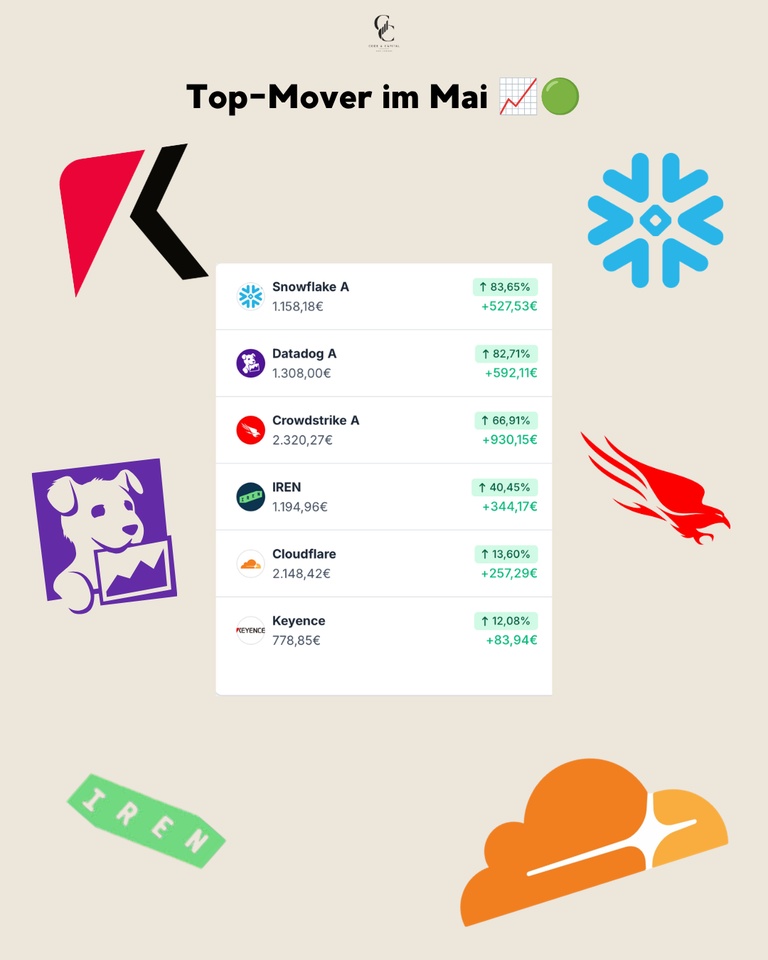
Top Movers in June 🟢
Despite the generally nervous sentiment, there were a few stocks that bucked the rotation trend and benefited from the flight to quality.
Tempus AI $TEM (-1,8 %) posted the strongest gain at +19.99% (+37.02 €)—AI diagnostics remain in demand, even as more speculative stocks were sold off. TSMC $2330 followed with a gain of +15.56% (+€72.12): Demand for chips related to AI expansion remains consistently high, regardless of the interest rate debate. Ferrari $RACE (-1,47 %) rose by +9.63% (+€78.63)—luxury goods proved resilient in the face of macroeconomic concerns. Berkshire Hathaway $BRK.B (-0,19 %) benefited significantly from the flight to defensive quality, rising +7.37% (+€142.01), while Crowdstrike $CRWD (-0,42 %) posted the largest euro gain in the portfolio with a +6.97% (+161.62 €) rise—cybersecurity remains structurally in demand. Cloudflare $NET (+1,73 %) rounded out the list of winners with a gain of +4.92% (+€105.74).
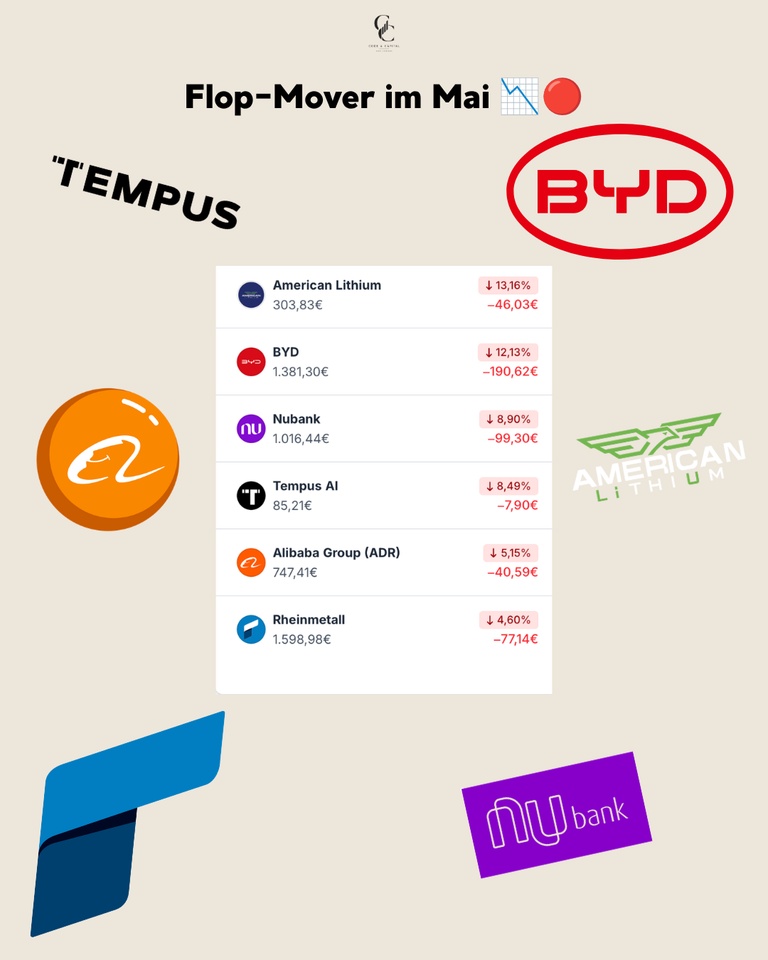
June’s Biggest Losers 🔴
The losers in June were almost exclusively the stocks that had performed the strongest in previous months or are particularly sensitive to interest rates.
IREN was hit the hardest $IREN (-3,87 %) , down -26.48% (-€316.39): Falling Bitcoin prices and ongoing disagreement among analysts regarding the company’s transition from a Bitcoin miner to an AI cloud provider weighed on the stock. Rheinmetall $RHM (+2,1 %) lost -23.36% (-€376.76) after the Ministry of Defense scrapped the F126 frigate program, which affected the entire defense sector. Alibaba $BABA (-2,24 %) fell by -21.25% (-€158.86)—Chinese tech remains under pressure due to general risk aversion toward Chinese stocks. American Lithium fell -21.21% (-€64.45), weighed down by persistently weak commodity prices and higher interest rate expectations, which particularly affect unprofitable growth stocks. BYD $1211 (-2,01 %) fell by -18.40% (-254.16 €) amid the ongoing price war in the Chinese electric vehicle market. Solaria $SLR (-2,75 %) rounded out the list of top losers with a -15.86% drop (-€63.35)—the hawkish Fed is weighing noticeably on interest-rate-sensitive solar and renewable energy stocks.
Conclusion 💡
June was a month of rotation: away from the more speculative winners of previous months, toward quality and established names. The Fed shock and the Rheinmetall slump showed how quickly sentiment can shift—a good reminder of why diversification across sectors and regions remains important.
❓ Question for the Community
That was my month in numbers—how did your portfolio fare through the Fed shock? Did you buy more Rheinmetall shares, or did you pull the plug?
👇 Let us know in the comments!
➡️ Follow @codeandcapital26 for transparent portfolio updates!
🔗 Link in bio: Wikifolio, Getquin & Parqet Portfolio
🗞️ Newsletter: codeandcapitalquant.beehiiv.com
📈 Wikifolio: https://www.wikifolio.com/de/de/w/wf0gquant6