Dear Community,
Throughout last year, I found myself repeatedly wanting to focus on the European market as well. But the same old arguments kept dissuading me: The European market doesn’t deliver; Europe doesn’t meet my desire for a growth-oriented, high-yield portfolio, etc.
I also asked myself: Which sectors and industries do I want to cover? Where do I see enough potential to justify taking the risk? To what extent do I want to align my portfolio with this strategy?
In today’s episode, Alles auf Aktien: Fiese Gewinnwarnung bei BMW und Europas KI-Unabhängigkeitsaktien , something caught my attention:
A basket from Goldman Sachs, consisting of 64 European stocks, with the wonderful name: EU AI Capex.
Performance over the past five years: 17.5 percent annualized, including dividends.
_________________________
And which industries are covered?
- Semiconductors
- Machinery
- Electricity
- Networks
- Cables
- Energy
- Automation
Unfortunately, existing ETFs such as the iShares STOXX Europe 600 Utilities UCITS ETF or the iShares STOXX Europe 600 Technology UCITS ETF do not cover all of these sectors.
"Sounds exactly like what I was looking for," I thought to myself, and used my day off today to create an index tailored to my preferences.
Goldman Sachs has listed 12 of the 64 holdings, including their percentage allocations. The remaining 52 holdings appear to be known only to institutional investors, as the index isn’t publicly available.
So I created my own “Pie” through Trading 212. More specifically, a “Pie” is a personalized investment portfolio in which I can invest in multiple stocks and ETFs according to a percentage allocation I set myself and save toward them simultaneously via a single automated savings plan—with no expense ratio and no order fees.
It would go beyond the scope of this post to write about every individual security, which is why I chose this particular one. I didn’t make these decisions entirely on my own. Gemini helped me with this. In the end, we settled on 37 securities.
_________________________
On Selecting the Holdings
Together, we gradually added European market leaders across the entire value chain. We always kept an eye on the sectors—none should be left out.
_________________________
On the Percentage Allocation
It’s important to note upfront that the “pie” will be funded with 150 euros per month going forward. Since the minimum investment amount at Trading 212 is one euro, the smallest weighting in the “pie” must be at least 0.7%:
1.00 euro / 0.70% = 142.85 euro
The percentage allocation was then based on pricing power and global scalability.
More details on this may follow in a later post.
_________________________
About the Stocks
From EU AI Cortex Basket taken over by Goldman Sachs:
- Infineon ($IFX (-4,84 %)): 7.10%
- ASML ($ASML (-2,59 %)): 6.80%
- Siemens ($SIE (-1,91 %)): 6.00%
- Rolls-Royce ($RR. (-0,35 %)): 5.40%
- Enel ($ENEL (+1,01 %)): 5.40%
- Schneider Electric ($SU (-1,79 %)): 5.40%
- ABB ($ABBN (-3,15 %)): 5.00%
- Iberdrola ($IBE (+2,21 %)): 4.90%
- Siemens Energy ($ENR (-6,58 %)): 4.70%
- ASM International ($ASM (-4,85 %)): 3.70%
- Prysmian ($PRY (-3,17 %)): 3.60%
- BE Semiconductor ($BESI (-3,32 %)): 3.20%
Supplemented by the following stocks:
- VAT Group ($VACN (-1,84 %)): 4.50%
- STMicroelectronics ($STM (-4,56 %)): 2.50%
- Legrand ($LR (-1,93 %)): 2.00%
- RWE ($RWE (-2,33 %)): 1.95%
- Nokia ($NOKIA (-6,56 %)): 1.90%
- E.ON ($EOAN (+0,07 %)): 1.90%
- National Grid ($NG. (-0,39 %)): 1.80%
- SSE plc ($SSE (-0,53 %)): 1.70%
- EDP Renováveis ($EDPR (-0,88 %)): 1.60%
- Red Eléctrica ($RDEIY (+0,98 %)): 1.50%
- Nexans ($NEX (-4,09 %)): 1.50%
- Hochtief ($HOT (-2,38 %)): 1.50%
- Enagás ($ENG (-1,32 %)): 1.40%
- United Utilities ($UU. (+0,86 %)): 1.40%
- Spirax-Sarco ($SPX (-2,44 %)): 1.30%
- Centrica ($CNA (-0,97 %)): 1.30%
- Aixtron ($AIXA (-1,91 %)): 1.30%
- Orsted ($ORSTED (-2,3 %)): 1.15%
- Verbund AG ($VER (+0,72 %)): 1.10%
- Soitec ($SOI (+1,81 %)): 1.10%
- Safran ($SAF (-4,09 %)): 1.00%
- Thales ($HO (-0,67 %)): 1.00%
- Geberit ($GEBN (+0,17 %)): 0.90%
- NKT A/S ($NKT (-3,68 %)): 0.80%
- Andritz ($ANDR (-2,04 %)): 0.70%
The figures $IG (+0,8 %) , $SRG (-0,46 %) , $TRN (+0,44 %) , $ALFA (-1,2 %) , $ATCO B (-2,59 %) or $AEMMY can unfortunately only be traded via CFDs on Trading 212. Therefore, these securities could not be included.
_________________________
Trading 212 Pie
The Pie now accounts for about 10% of my portfolio, and I’ll be contributing 150 euros to it each month going forward.
I am convinced that Europe will succeed in becoming more independent. However, in my opinion, a self-sufficient Europe without any dependence whatsoever is simply not possible (keyword: globalization).
_________________________
Pie Composition
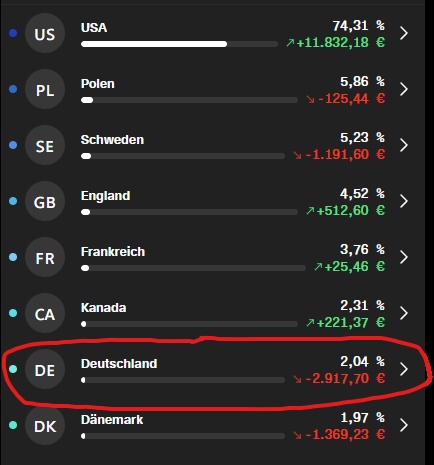
By country:
- Germany: 24.35%
- France: 15.4%
- Netherlands: 13.7%
- United Kingdom: 12.9%
- Switzerland: 10.4%
- Italy: 9%
- Spain: 7.8%
- Denmark: 1.95%
- Austria: 1.8%
- Portugal: 1.6%
By sector:
- Technology: 32.3%
- Industrial & Capital Goods: 31.5%
- Utilities & Energy Infrastructure: 36.2%
By industry:
- Semiconductors & Data Center Chips: 27.8%
- Energy Equipment & Grid Technology: 25.5%
- Electricity Generators: 16.1%
- Physical Networks & Storage: 10.1%
- Cable Infrastructure: 5.9%
- Vacuum Technology & Components: 6.5%
- Network Technology & Connectivity: 1.9%
- Data Centers & Industrial Construction: 3.1%
- Cyber and Perimeter Security: 3.1%
_________________________
I’m curious to see how the pie chart will develop.
P.S.: You can find the pie chart on Trading 212 under the name Euro AI Backbone GS to copy.