

After a month, I'll exchange $SYK (+0,4 %) for $LRCX. (-0,47 %)

Lam Research
Stock
Stock
Ticker: LRCX
LRCX
Price
Debate sobre LRCX
Puestos
47


2Semana·
Buy Order Triggered: Lam Research
Today, my buy order for $LRCX (-0,47 %) was triggered after the stock fell below the 50 % Fibonacci retracement level from its ATH.
As part of my Blue Chip Fibonacci Portfolio, this is exactly the type of setup I'm looking for. My strategy isn't about predicting the bottom. It's about accumulating high-quality companies at predefined levels while managing risk through position sizing.
The semiconductor sector has recently faced pressure as investors reassess AI spending, memory pricing cycles, and capital expenditure budgets across the industry. At the same time, the long-term trend remains intact: more computing power, more storage, and more advanced chips require more sophisticated manufacturing equipment. That's where Lam Research comes in.
✅ Buy order triggered according to plan
✅ Position sizing respected
✅ Risk management remains intact
✅ Ignore short-term noise
Will the stock go lower? Maybe. Will the long-term demand for semiconductors disappear? I highly doubt it.
#trading
#long
#tradingstrategy
#bluechipstocks
#bluechipfibonacci
#lamresearch
#lrcx
#stocks
#techstocks
#tech
#semiconductors
#ai
#usa
#mikeupegui
55
4 Comentarios1Semana
I bought some, too! When would you buy more?
•
11
•
4Semana·
𝐋𝐚𝐦 𝐑𝐞𝐬𝐞𝐚𝐫𝐜𝐡: 𝐑𝐞𝐜𝐨𝐫𝐝 𝐐𝟑 𝐑𝐞𝐯𝐞𝐧𝐮𝐞 𝐚𝐧𝐝 𝐄𝐚𝐫𝐧𝐢𝐧𝐠𝐬 𝐁𝐞𝐚𝐭 𝐄𝐬𝐭𝐢𝐦𝐚𝐭𝐞𝐬, 𝐐𝟒 𝐆𝐮𝐢𝐝𝐚𝐧𝐜𝐞 𝐀𝐛𝐨
⠀
📊 𝐑𝐞𝐬𝐮𝐥𝐭𝐬
• Adj. EPS: $2.20 (Est. $2.18) ✅, +21% QoQ.
• Revenue: $8.22B (Est. $8.14B) ✅, +54% YoY, +22% QoQ.
• GAAP EPS: $2.19, +21% QoQ.
• Adj. Gross Margin: 52.4%, +40 bps QoQ.
• Adj. Operating Margin: 40.2%, +180 bps QoQ.
• Adj. Operating Income: $3.30B.
• Adj. Net Income: $2.77B.
• Operating Cash Flow: $3.50B.
• Systems Revenue: $5.73B, +62% YoY.
• Customer Support Revenue: $2.49B, +40% YoY.
⠀
🎯 𝐆𝐮𝐢𝐝𝐚𝐧𝐜𝐞
• Q4 2026 Revenue: $8.20B–$9.00B, midpoint $8.60B (Est. $8.54B) ✅.
• Q4 2026 Adj. EPS: $2.18–$2.48, midpoint $2.33 (Est. $2.32) ✅.
• Q4 2026 Adj. Gross Margin: 52.5% ± 1%.
• Q4 2026 Adj. Operating Margin: 40.5% ± 1%.
⠀
📌 𝐊𝐞𝐲 𝐓𝐚𝐤𝐞𝐚𝐰𝐚𝐲𝐬
• Q3 Adj. EPS beat consensus by ~0.9%, while revenue exceeded estimates by ~1.0%.
• Lam delivered record quarterly revenue, profit and EPS, driven by AI-related semiconductor demand and increasing device complexity.
• Revenue surged 54% YoY, with Systems revenue jumping 62% to $5.73B.
• Adjusted operating margin expanded 180 bps QoQ to 40.2%, reflecting stronger operating leverage.
• China accounted for 35% of revenue, followed by Korea (20%) and Taiwan (18%).
• Q4 revenue guidance midpoint was ~0.7% above consensus, while EPS guidance was broadly in line.
• Operating cash flow reached $3.50B, while Lam repurchased ~$1.02B in shares and ended the quarter with $7.45B in cash and restricted cash.
⠀
💬 𝐌𝐚𝐧𝐚𝐠𝐞𝐦𝐞𝐧𝐭 𝐂𝐨𝐦𝐦𝐞𝐧𝐭𝐚𝐫𝐲
“With AI driving higher semiconductor demand and greater device complexity, our focus on operational execution helped Lam deliver record revenue, profit, and earnings per share in the September quarter.”
77

1Lun·
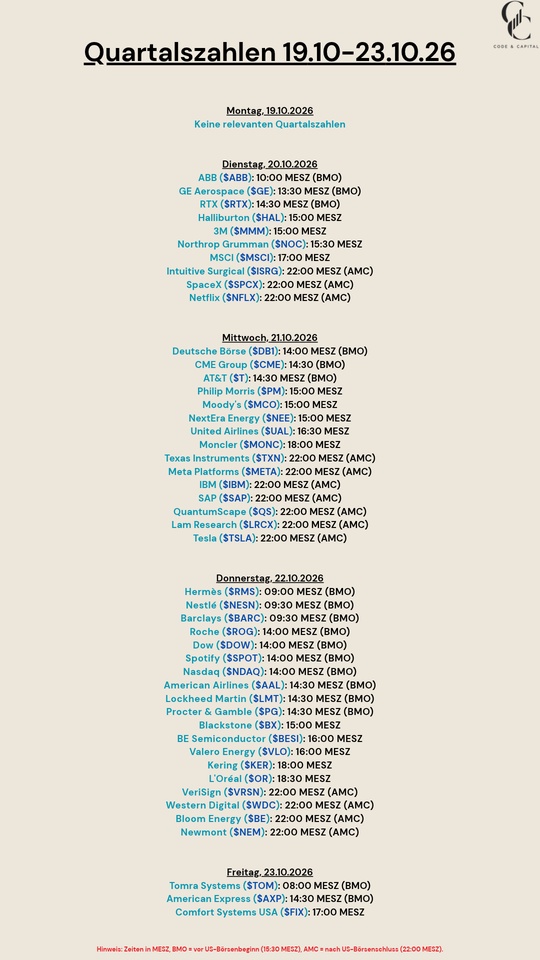
Quarterly Results: Oct. 19–23, 2026
$ABBN (-0,34 %)
$GE
$RTX (+0,45 %)
$HAL (-1,63 %)
$MMM (+0,32 %)
$NOC (-2,07 %)
$MSCI (+0,28 %)
$ISRG (-1,87 %)
$SPCX (+0,82 %)
$NFLX (+0,83 %)
$DB1 (-0,22 %)
$CME (-0,19 %)
$T (-1,28 %)
$PM (-1,08 %)
$MCO (-0,57 %)
$NEE (-0,34 %)
$UAL (+1,23 %)
$MONC (-0,27 %)
$TXN (-1,33 %)
$META (-0,2 %)
$IBM (-0,69 %)
$SAP (-5,56 %)
$QS (-3,01 %)
$LRCX (-0,47 %)
$TSLA (+0,56 %)
$RMS (-0,52 %)
$NESN (-0,92 %)
$BARC (-2,39 %)
$ROP (-1,75 %)
$DOW (-2,94 %)
$SPOT (+1,37 %)
$NDAQ (+0,21 %)
$AAL (+0,41 %)
$LMT (-2,04 %)
$PG (-0,55 %)
$BX (-0,42 %)
$BESI (+1,86 %)
$VLO (-5,46 %)
$KER (-0,43 %)
$OR (-1 %)
$VRSN (+0,68 %)
$WDC (+0,59 %)
$BE (-3,19 %)
$NEM (-5,95 %)
$TOM (-4,37 %)
$AXP (+0,16 %)
$FIX (+1,96 %)
99
1Lun·
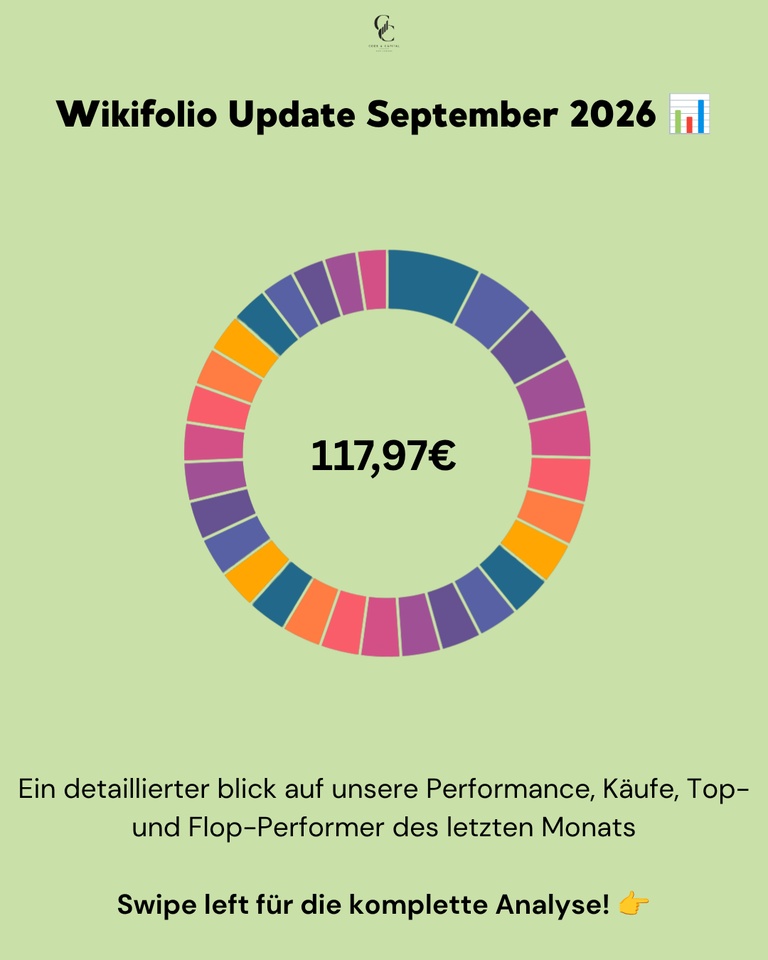
📊 Wikifolio Update September 2026: up 1.03%, tech stocks up, mining stocks down, and 18 of 30 positions swapped on October 1
In August, gold mines were the market's top performers. In September, they were the most expensive. Fresnillo
$FRES (-6,05 %) down 15 percent, Micron
$MU (-2,3 %) up 17. At the end of the month, the Wikifolio was up 1.03 percent, and one day later, I swapped out 18 of 30 positions.
September was all about interest rates and oil. Brent rose above $100 in the second week and, following a Saudi pipeline outage, briefly hit $110. U.S. inflation stood at 3.4 percent in August. On September 16, the Fed raised the benchmark interest rate by a quarter point to 3.75 to 4.00 percent, for the first time since July 2023. The 10-year U.S. yield subsequently climbed to 5.19 percent, a level last seen in 2007. This hardly bothered tech stocks. The Nasdaq hit a record high on September 21, and AMD has been worth one trillion dollars ever since. The situation was different in Europe. German inflation jumped to 3.3 percent, and the DAX lost about four percent over the month.
📊 Monthly performance: +1.03%
📊 Price as of September 30: €117.97
📊 Largest loss since inception: −14.6%
📊 Max performance: +18% (since March 13, 26)
Next rebalancing: Early January 2027
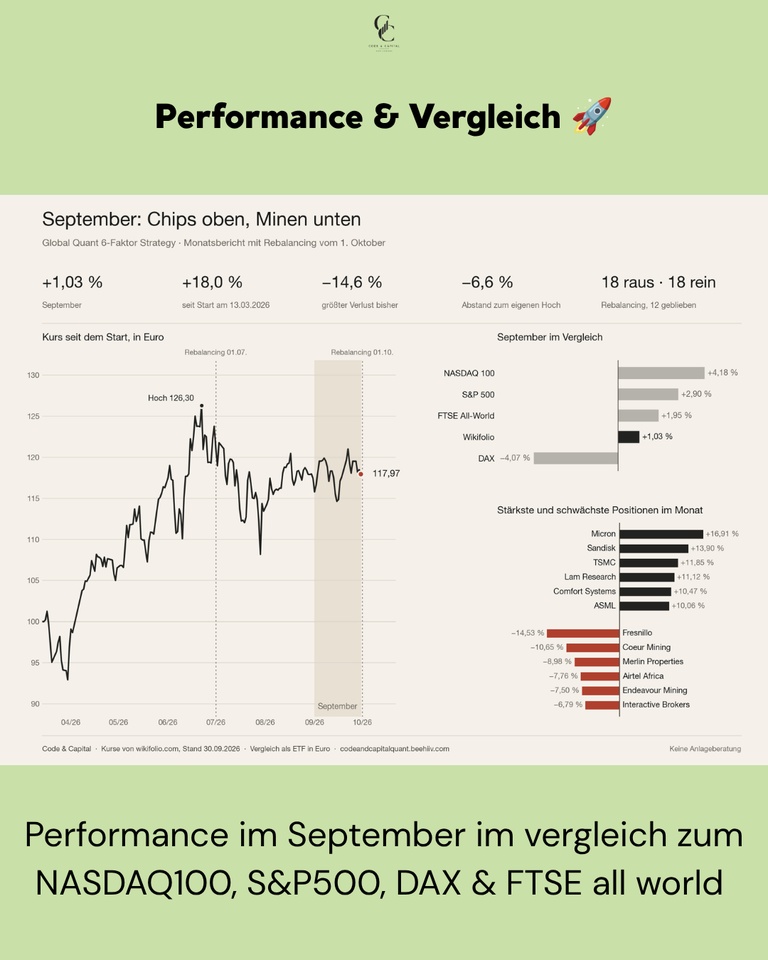
Performance & Comparison 🚀
The U.S. indices posted clear gains when calculated in euros, with the Nasdaq leading the way. The Wikifolio did not keep pace. It lagged behind the Nasdaq, S&P 500, and FTSE All-World, and outperformed only the DAX.
Performance Comparison (September 1–30, 2026, end of day):
Global Quant 6-Factor: +1.03%
NASDAQ 100: +4.18%
S&P 500: +2.90%
FTSE All-World: +1.95%
DAX: −4.07%
You can see what caused this in the two lists below. Tech stocks delivered, while mining stocks and a few individual stocks ate up a good chunk of those gains.
Purchases & Sales 💶
None in September itself. The model trades only on four dates per year, and the third was on October 1. What happened then is detailed in its own section below.
Top Movers in September 🟢
The month belonged to semiconductors and memory stocks. Midway through the month, Intel’s CEO said the company could currently only meet about half of the demand for processors. After that, the entire industry picked up steam. Micron
$MU (-2,3 %) topped the list with +16.91%, followed by SanDisk
$SNDK (-5,39 %) at +13.90% and TSMC
$2330 at +11.85%. Lam Research
$LRCX (-0,47 %) rose +11.12%, ASML
$ASML (-0,32 %) +10.06%. In between is Comfort Systems $FIX (+1,96 %) , a stock that has nothing to do with chips, up 10.47%. In August, Comfort Systems was still among the losers.
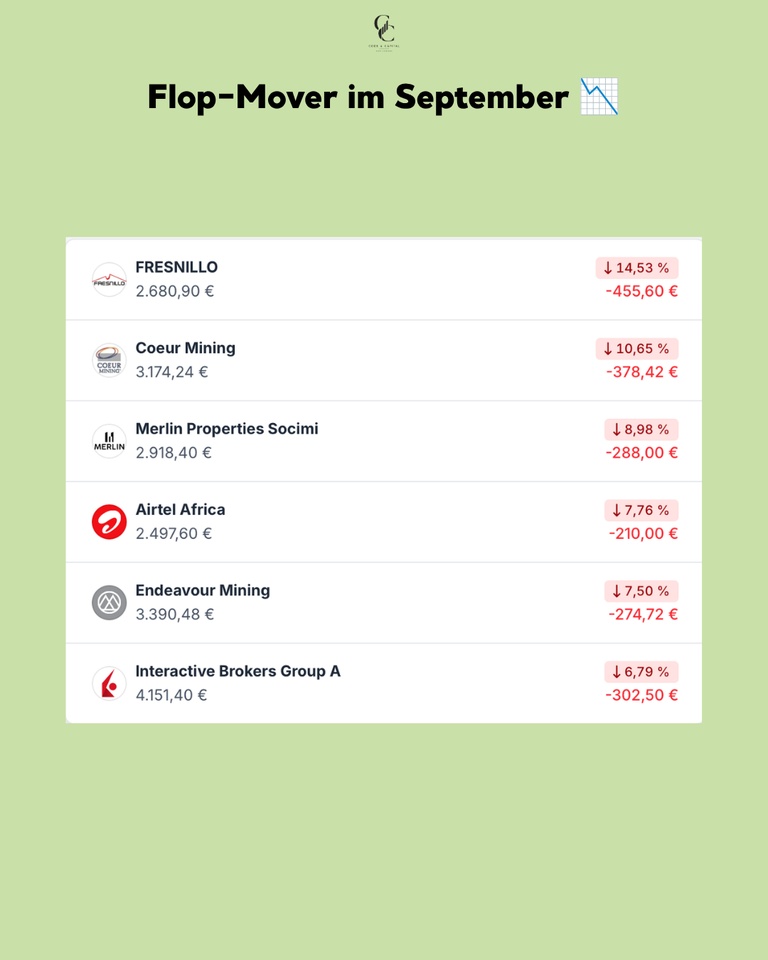
September’s Big Losers 🔴
Gold and silver declined in September, with silver falling much more sharply. Rising yields and a stronger dollar weighed on prices. Mining stocks followed suit. Fresnillo
$FRES (-6,05 %) lost −14.53%, Coeur Mining
$CDE (-6,35 %) −10.65%, and Endeavour Mining $EDV (-7,07 %) -7.50%. In August, all three were still on the other list with gains of over 25 percent. Merlin Properties fell −8.98%, Airtel Africa
$AAF (-2,42 %) down 7.76%, and Interactive Brokers
$IBKR (-0,37 %) fell by 6.79%.
Rebalancing on October 1 🔄
On October 1, the third rebalancing since the start took place. I swapped out 18 of 30 positions—more than ever before. In July, it was nine.
All nine banks are out: Bankinter
$BKT (-1,4 %) , CaixaBank
$CABK (-2,69 %) , BBVA
$BBVA (-1,94 %) , UniCredit
$UCG (-2,47 %) , BPER
$BPE (-3,28 %) , Monte dei Paschi $BMPS (-2,53 %) , Banca Mediolanum
$BMED (-1,87 %) , Swedbank$SWED A (-2,31 %) and HSBC
$HSBA (-2,97 %) . In addition, Interactive Brokers $IBKR (-0,37 %) , Antofagasta $ANTO (-6,78 %) , Coeur Mining
$CDE (-6,35 %) , AppLovin
$APP (-1,82 %) , Airtel Africa
$AAF (-2,42 %) , Merlin Properties and Solaria
$SLR (-1,12 %) . Investor AB
$INVE B (-1,58 %) and Pershing Square
$PSH (+0,11 %) are also no longer in the portfolio. So four of the six underperformers listed above are no longer in the portfolio.
Six stocks from the healthcare sector were added: Eli Lilly
$LLY (-2,11 %) , Bristol-Myers
Squibb
$BMY (-2,06 %) , Vertex $VRTX , Incyte
$INCY (-1,4 %) , Illumina
$ILMN (+2,67 %) and WuXi AppTec
$603259 . Five are from the semiconductor and storage sectors: Seagate
$STX (+0,64 %) , Marvell
$MRVL (-4,6 %) , Applied
Materials
$AMAT (-0,14 %), Teradyne
$TER (-0,88 %) and KLA
$KLAC (-1,56 %) . The rest is split among Fortinet
$FTNT (+8,45 %) , CF Industries
$CF (-4,52 %) , Marathon Petroleum
$MPC (-5,32 %) , APA
$APA (-2,22 %) , Pop Mart $9992 (-0,9 %) , Hong Kong Exchanges
$388 (-1,15 %) and Lion Finance
$BGEO (-1,55 %) .
Twelve remain: SanDisk, Micron, Western Digital, Nvidia, Lam Research, TSMC, ASML, Alphabet, Comfort Systems, Fresnillo, Endeavour and Newmont. All six of September’s top movers are included.
Two names stand out. Applied Materials and KLA I sold on July 1, up 92 and a gain of 90 percent. Now both are back in my portfolio. The model doesn’t remember what it has sold in the past. It only looks at where a stock stands in the ranking today.
Conclusion 💡
The portfolio looks different after October 1 than it did before. In September, about 41 percent was still in financial stocks; now there are two positions out of 30. Instead, 12 out of 30 are in semiconductors and memory, and six are in the healthcare sector. There’s no sector limit; the model sorts by score, not by industry. Trading won’t resume until early January.
How was your September? And did you hold onto your stocks after the pullback, or did you sell them? 👇
➡️ Every month, you’ll find the complete Wikifolio update here, along with research in between.
📈 Wikifolio $DE000LS9V052 (-0,97 %)

+ 1
88
8 Comentarios
1Lun
What are the CAGR and Sharpe ratio of your strategy?
•
11
•
2Lun·
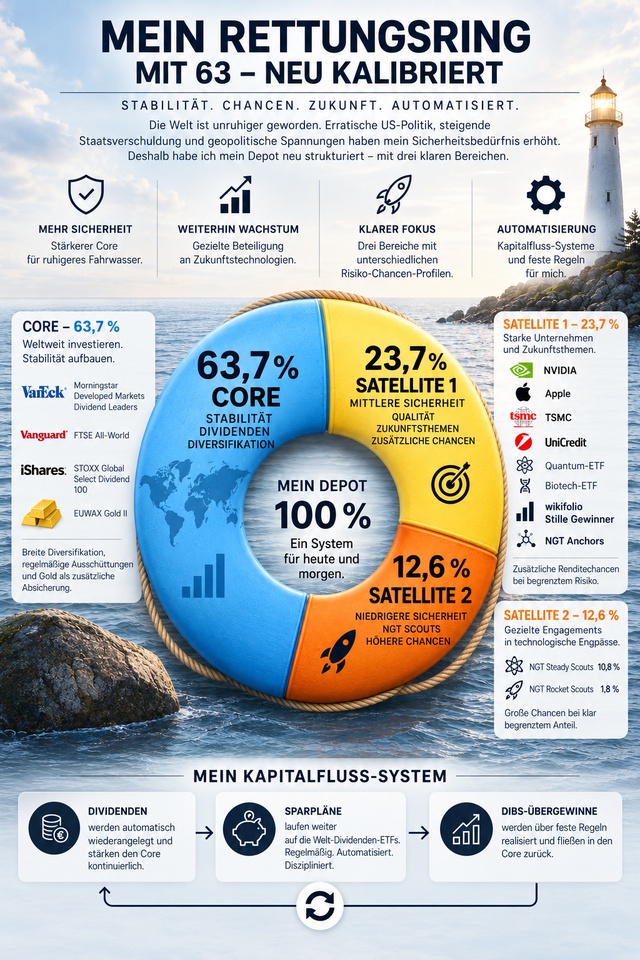
+++ Update on My Portfolio Structure 🛟 +++
At 63, I continue to invest in stocks and future technologies. However, my portfolio looks slightly different today than it did a few months ago, as my need for security has increased.
Erratic U.S. politics, a steadily rising national debt, and increasing geopolitical tensions have changed the landscape for me. The stock market feels less predictable. Political decisions can shake up entire industries within a matter of hours. I’ve responded to this by safety net.
My portfolio now consists of three segments with clearly distinct roles:
The CORE 🥑 63.7% (higher security)
Nearly 64% of my portfolio now makes up the stable core. This includes the VanEck Morningstar Developed Markets Dividend Leaders, the Vanguard FTSE All-World (Dist), the iShares STOXX Global Select Dividend 100, and EUWAX Gold II.
The global equity ETFs provide diversification and regular distributions. Gold complements the Core as an additional hedge. Dividends continue to play an important role for me, accounting for 63%. I want to build up a growing supplemental pension over the coming years while maintaining a core that is as stable as possible.
SATELLITE 1 🛰️ 23.7% (medium risk)
This is where I invest in opportunities with moderate risk. These include established companies such as NVIDIA, TSMC, Apple, and UniCredit. I’ve also added my NGT anchor stocks, such as Lam Research $LRCX (-0,47 %) , ATI $ATI (+3,32 %) , and GE Vernova $GEV (-1,53 %) , two thematic ETFs for quantum computing $QNTM (-2,83 %) and biotechnology $GNOM , as well as the wikifolio “Silent Winners” $STWINNER (+0,21 %). NGT stands for Next-Gen Technologies.
This segment is intended to create additional return opportunities while offering greater stability than my smaller NGT companies. The NGT anchor holdings, in particular, play a key role here. They allow me to maintain targeted exposure to structural technological bottlenecks through companies whose business models are already significantly more established.
SATELLITE 2 🚀 12.6% (lower risk)
This segment can be significantly more speculative. It consists exclusively of my NGT Steady Scouts (e.g., $BE) (-3,19 %) and Rocket Scouts (e.g., $RKLB) (-4,46 %). The Steady Scouts currently account for 10.8% of my total portfolio. The significantly more speculative Rocket Scouts account for just 1.8%. This ensures that this portion remains large enough to make a noticeable contribution in the event of successful investments. At the same time, its impact on my total assets remains limited.
NGT remains ♟️
My conviction in NGT and the DIBS strategy has not fundamentally changed. I continue to invest in technological bottlenecks related to AI infrastructure, photonics, energy supply, advanced packaging, defense, space, and other future-oriented fields. What has changed is their role in my overall portfolio.
The NGT holdings are now spread across two risk levels. The established “Anchors” are in Satellite 1 with moderate certainty. “Steady Scouts” and “Rocket Scouts” make up the smaller, more speculative Satellite 2 segment. Overall, my direct NGT exposure now accounts for less than a quarter of my portfolio.
AUTOMATION ⚙️
My cash flow system also remains in place. Dividends are automatically reinvested. Savings plans continue to run. In the event of exceptionally high price gains, my fixed rules for taking profits kick in. Capital that becomes available can then flow back into the more stable segments of my portfolio.
This is how my safety net continues to evolve alongside my life and the broader economic conditions. At 63, I want to continue participating in the technologies of tomorrow. And I’d like to be able to sleep a little better 😴 while doing so.
3232
12 Comentarios
2Lun
I just love it when AI can't even manage to make a decent pie chart with a lifebuoy 🛟, but the creator doesn't even care. 😉
•
1616
•2Lun·
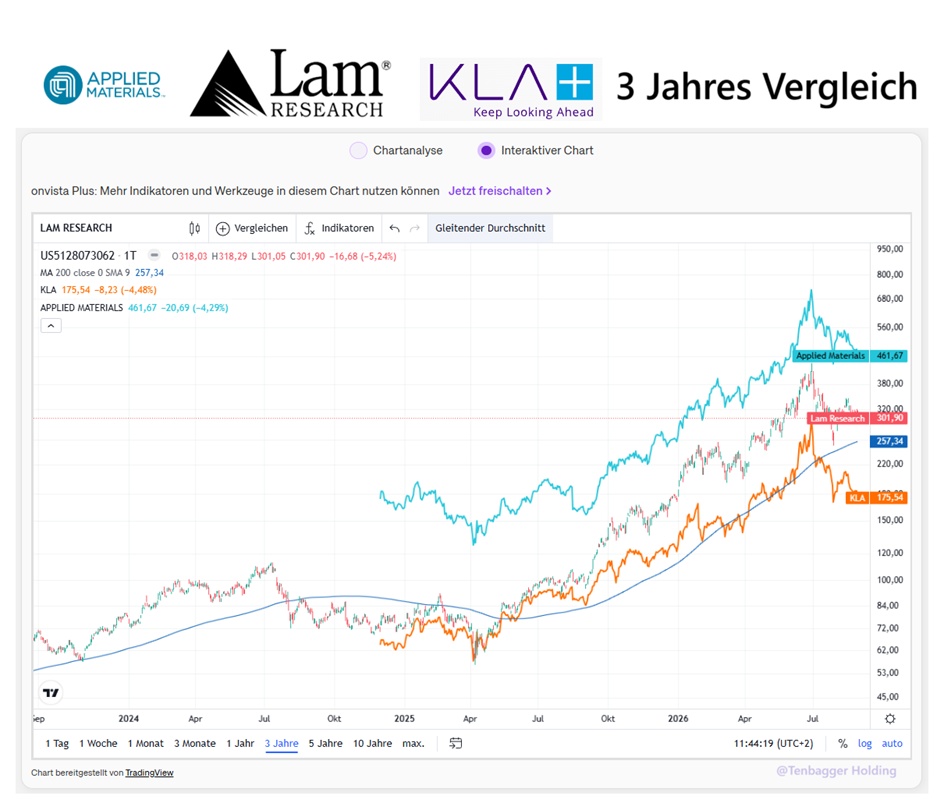
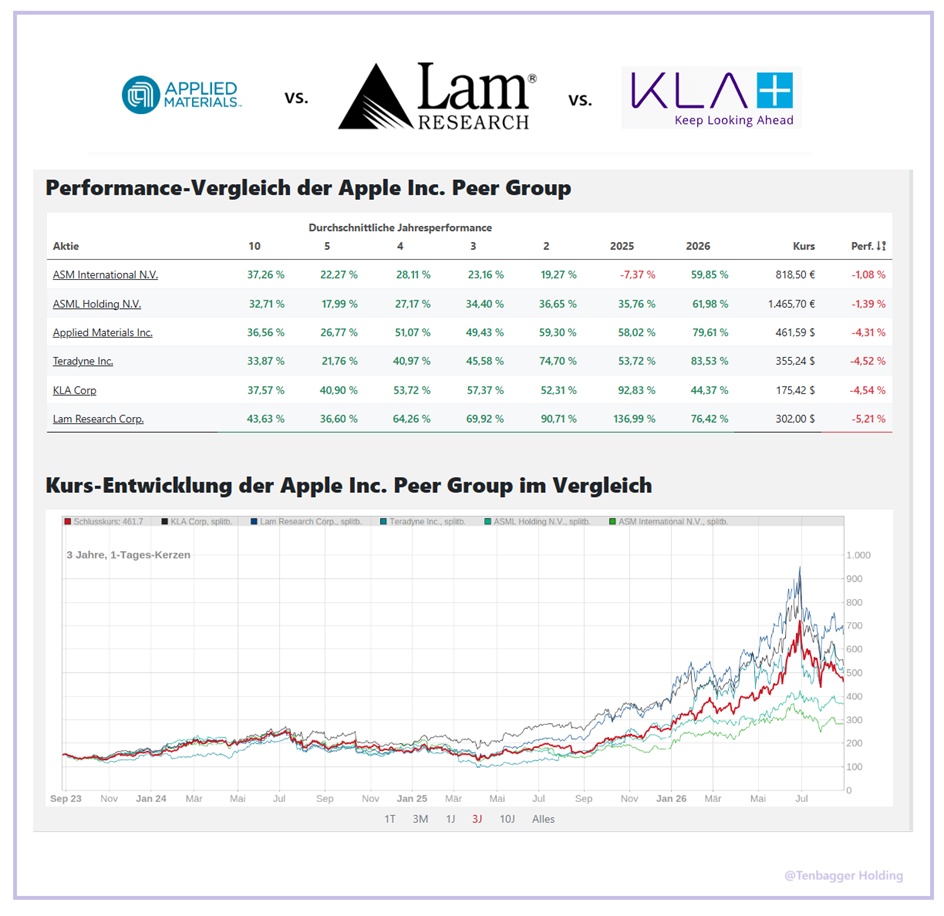
A little treat for the weekend. Comparison of Machine Manufacturers
Hello, everyone,
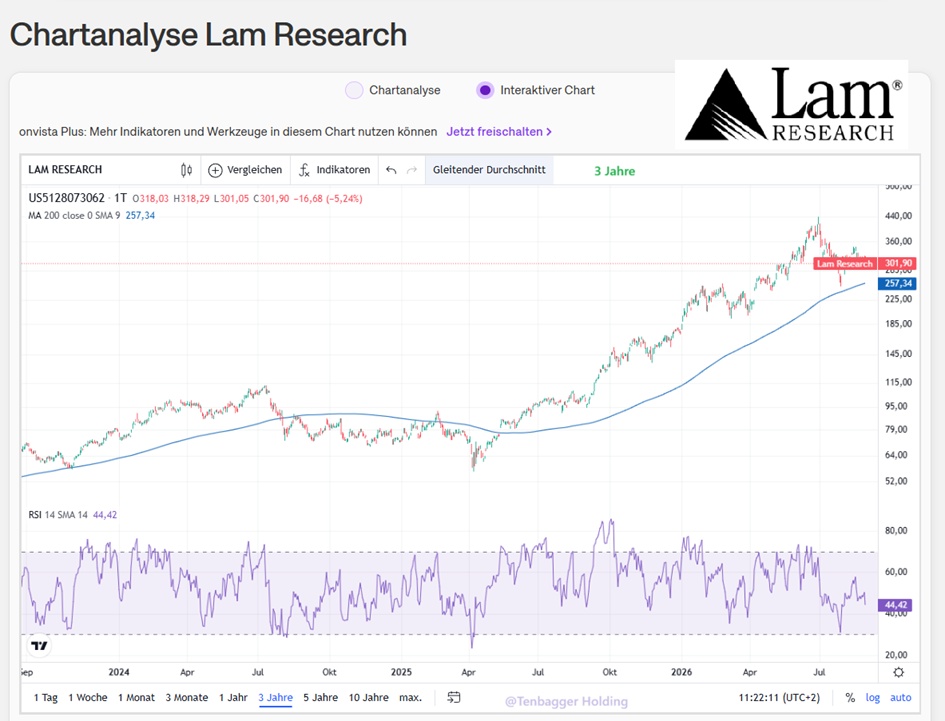
I've been monitoring the correction among semiconductor equipment manufacturers for weeks now.
And a brand-new analysis by the agents at @Raketentoni has identified these stocks as current long-term picks.
Further proof of their reliability is that our star investor @Simpson has been invested here for years.
That’s why, my friends, I’ve put together a comparison for you this weekend.
Please let me know in the comments how you like this type of comparison and whether you’d like to see more of it.
In a future post, there will be a poll. Feel free to select your top pick there.
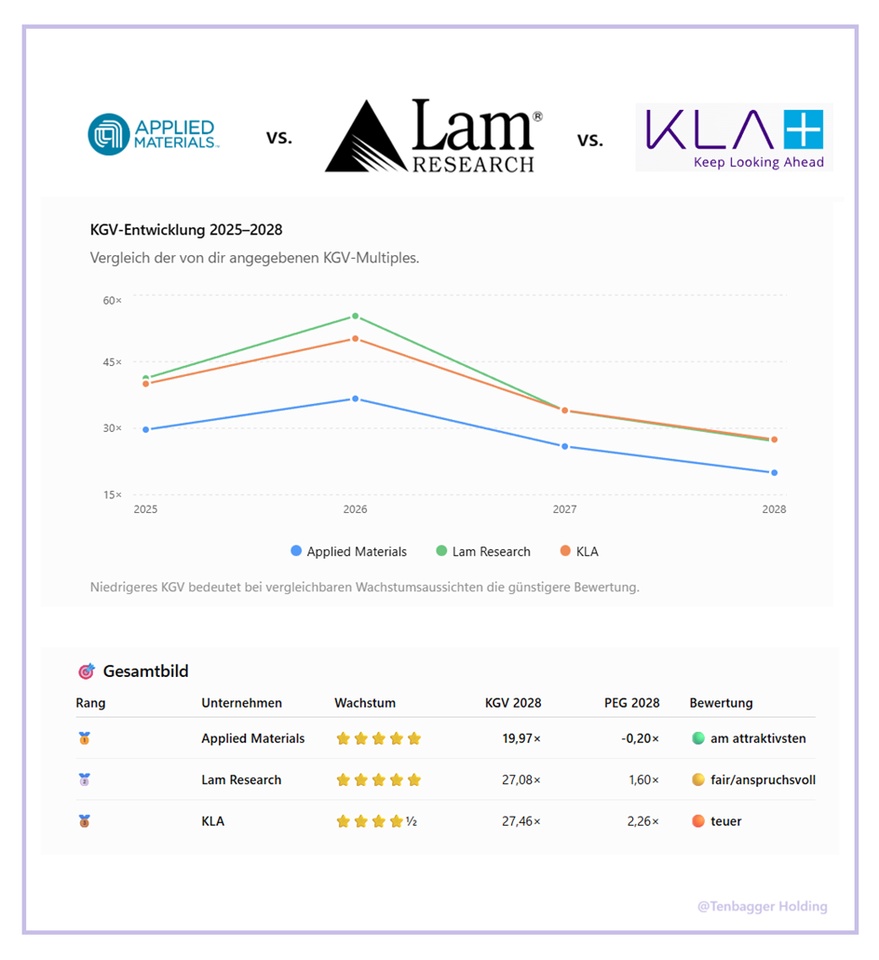
🏆 My ranking of the three companies
🥇 1. Applied Materials – most attractive valuation profile
- In 2028, only 19.97× P/E
- PEG drops to 0.87× 2027
- 2028 even -0.20× PEG according to your data
- EPS rises from €7.43 to €20.72
- Earnings growth remains steady in 2027/28 at 39.42% / 29.03% strong
- At the same time, it has the highest dividend of the three
➡️ For me, clearly the best balance of growth and valuation.
🥈 2. Lam Research – strongest growth, but more expensive
- Highest earnings growth in 2027: +60.76%
- EPS rises by about 184% from 2025 to 2028
- Although the P/E ratio falls from 55.31× to 27.08×
- the PEG ratio will rise to 1.60×
➡️ Extremely strong operational performance, but the market continues to demand a high valuation for it.
🥉 3. KLA – an outstanding company, but the most expensive in terms of PEG
- Strong earnings growth
- Still +46.45%
- P/E ratio falls to 27.46×
- However, the PEG rises to 2.26× in 2028
➡️ Very interesting from a qualitative perspective, but currently the most challenging valuation based on the multiples.
My conclusion: If I consider the multiples and earnings forecasts provided by onVista , Applied Materials is currently the clear favorite. Lam Research has the most impressive growth, but this growth is more heavily factored into the stock price and multiples. KLA appears to be the most expensive in terms of its P/E-to-growth ratio.
Note: Applied Materials’ negative PEG for 2028 is striking and should be cross-checked against the original MarketScreener table before making an investment decision.
+ 4

3Lun·
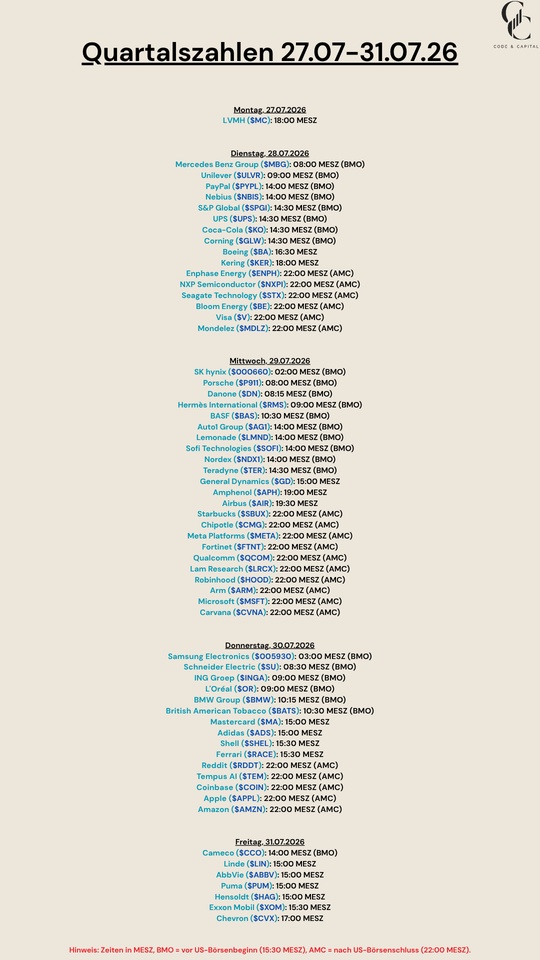
Quarterly Results: July 27–July 31, 26
$MC (-1,74 %)
$MBG (-1,45 %)
$ULVR (-1 %)
$PYPL (-0,42 %)
$NBIS (-5,03 %)
$SPGI (-2,18 %)
$UPS (+0,75 %)
$KO (-0,56 %)
$GLW (-2,3 %)
$BA (-0,55 %)
$KER (-0,43 %)
$ENPH (-3,16 %)
$NXPI (-0,38 %)
$STX (+0,64 %)
$BE (-3,19 %)
$V (-0,1 %)
$MDLZ (-0,2 %)
$000660
$P911 (-0,02 %)
$BN (-1,05 %)
$RMS (-0,52 %)
$BAS (-1,71 %)
$AG1 (-2,47 %)
$LMND (-5,49 %)
$SOFI (-1,76 %)
$NDX1 (+0,46 %)
$TER (-0,88 %)
$GD (-0,94 %)
$APH (-1,66 %)
$AIR (-1,86 %)
$SBUX (+2,06 %)
$CMG (+3,55 %)
$META (-0,2 %)
$FTNT (+8,45 %)
$QCOM (-4,58 %)
$LRCX (-0,47 %)
$HOOD (-0,63 %)
$ARM (-2,59 %)
$MSFT (+0,92 %)
$CVNA (+1,67 %)
$005930
$SU (+0,04 %)
$INGA (-3,64 %)
$OR (-1 %)
$BMW (-2 %)
$BATS (-1,61 %)
$MA (-0,51 %)
$ADS (+0,38 %)
$SHEL (-2,63 %)
$RACE (+3,19 %)
$RDDT (-1,16 %)
$TEM (-0,44 %)
$COIN (-4,63 %)
$AAPL (+0,71 %)
$AMZN (+4,24 %)
$CCO (-3,18 %)
$LIN (-0,34 %)
$ABBV (-2,03 %)
$PUM (-1,13 %)
$HAG (-2,13 %)
$XOM (-3,31 %)
$CVX (-4,33 %)
1414

4Lun·
Company Profile: Rorze Corp
Hello, community,
I hope you’ve all managed to “cool off” and get through the heat over the last few days/weeks 🥵
Today, I’d like to introduce you to another company from Japan.
Today’s focus is on Rorze Corp $6323
🦾 Rorze Corp: The Indispensable Robotic Hand of the Chip Boom
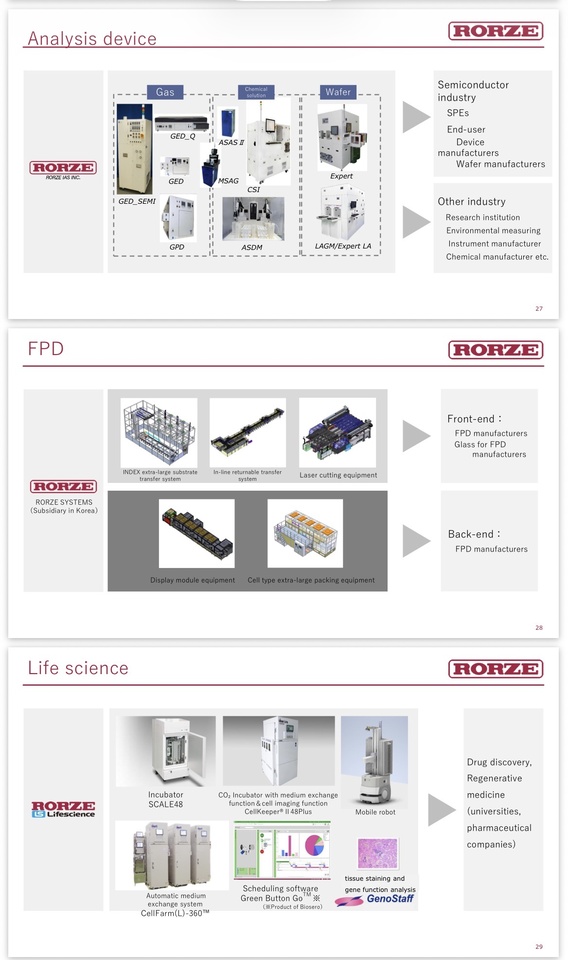
Rorze Corp isn’t a traditional semiconductor developer that designs complex circuits or builds machines that etch patterns onto silicon. It is the ultimate mechanical bottleneck in global chip production. While ASML $ASML (-0,32 %) builds the lithography giants, Rorze masters the delicate world of contamination-free transport. Rorze builds the high-precision handling robots that must move wafers in ultra-high vacuum and under extreme cleanroom conditions—a task where the slightest error can cost billions.
1. The Business Model: The “Toll Booth” in the Cleanroom 🎢
Rorze $6323 serves as an exclusive and mission-critical supplier to the world’s most valuable factories (TSMC $2330 , Intel $INTC (-1,67 %) , Samsung $005930 ) as well as for the leading (Applied Materials $AMAT (-0,14 %) , Lam Research $LRCX (-0,47 %) ).
The mechanism: When state-of-the-art semiconductors (3 nm and below) are produced, not a single speck of dust is allowed to touch the wafer. Rorze $6323 makes its money by developing and selling atmospheric and vacuum robotic systems that transfer the wafers back and forth between individual manufacturing steps in a contactless and sterile manner.
The ingenious part: Rorze $6323 has made itself indispensable. The major chip manufacturers physically cannot operate their multi-billion-dollar factories without integrating Rorze’s automation systems. Every new chip factory worldwide—whether in Arizona, Taiwan, or Dresden—means a large automatic order for Rorze.
Recurring Cash Flows: In addition to the pure sale of outrageously expensive robotic systems, there’s a high-margin service and spare parts business. Since the robots operate continuously under extreme conditions, maintenance is a reliable cash cow.
2. Key Figures (as of July 2026) 📊
Market capitalization: approx. 850 billion JPY (approx. 5.4 billion USD).
Stock price: Currently approx. 4,940 JPY (The stock is currently surging sharply after more than doubling from ~2,400 JPY since the beginning of the year).
P/E Ratio: approx. 42–45. Due to the recent surge in the order book and the market’s revaluation, the stock is no longer a bargain, but it does reflect its massive growth potential.
Return on Equity (ROE): Outstanding ~25–28%. For a capital-intensive mechanical engineering company, this level of efficiency is absolutely staggering.
Debt: Extremely solid balance sheet. High net cash reserves protect the operating business from interest rate risks.
3. Why is this stock exciting? 🚀
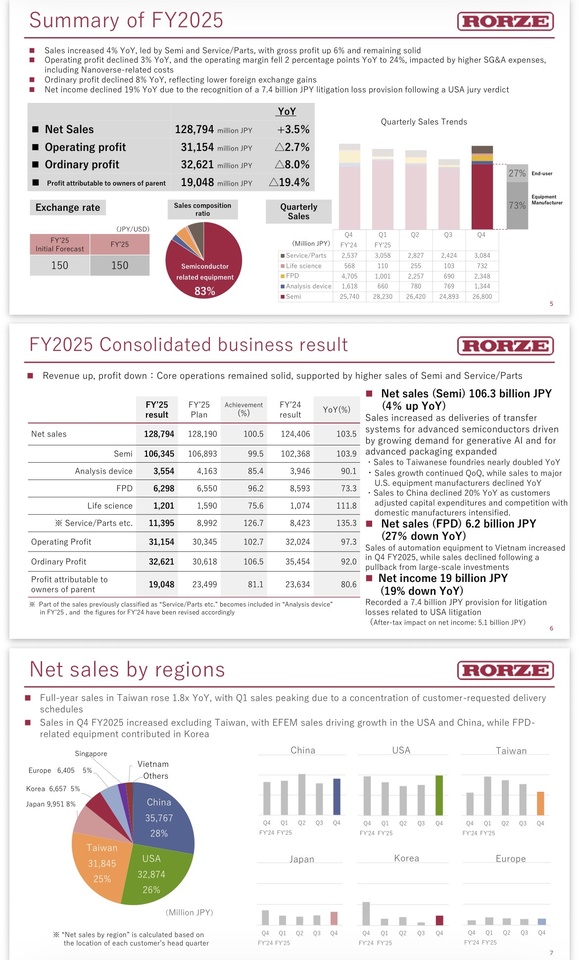
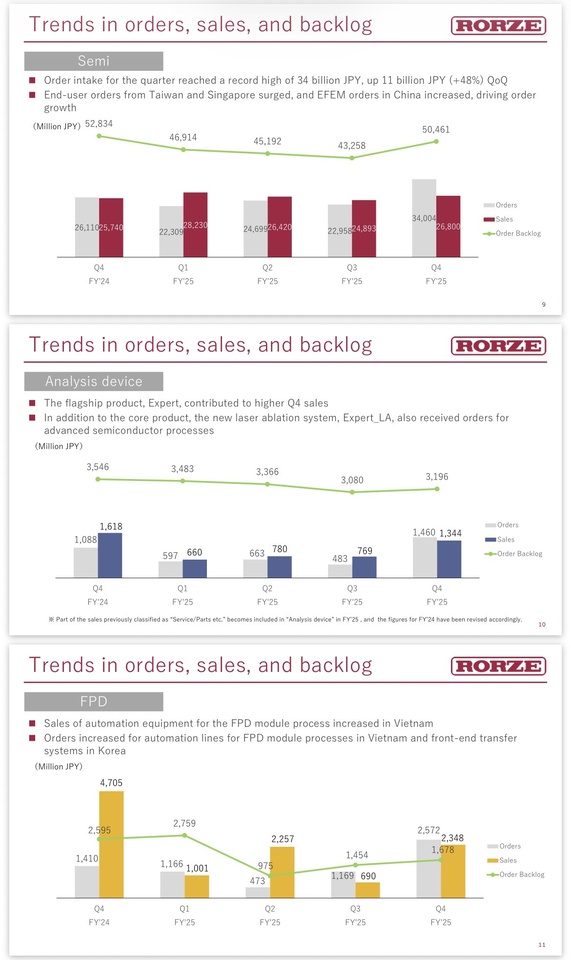
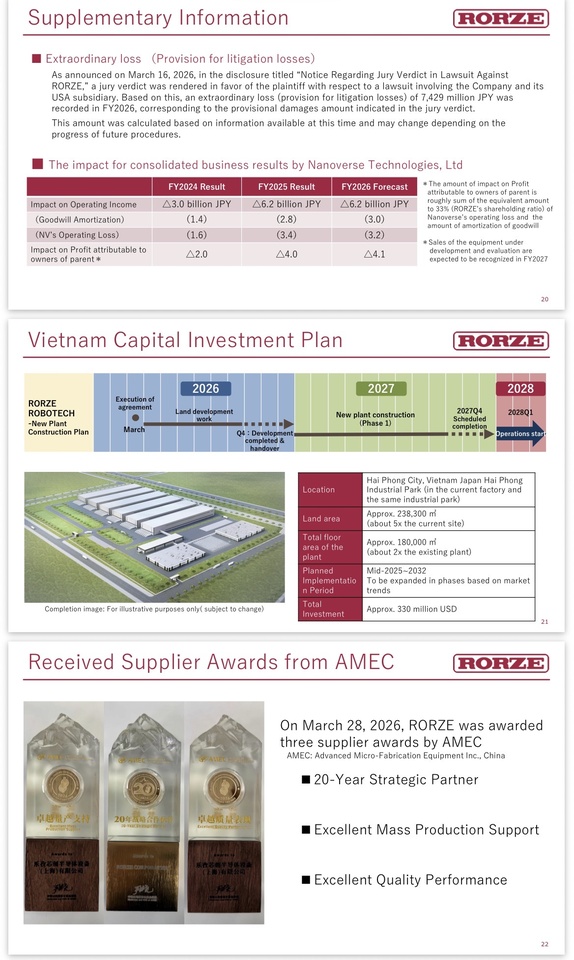
✅1. An explosive surge in orders wipes out the “profit warning”: In April 2026, Rorze $6323 reportedly posted a slight decline in earnings for the past fiscal year—triggered by one-time costs related to a U.S. lawsuit and high upfront investments in its subsidiary Nanoverse. The market, however, looked deeper and saw record order intake in the fourth quarter and a forecast of 46% profit growth for the coming year. The stock subsequently shot up to the daily limit.
✅2. The Advanced Packaging Lever: Due to the AI boom, memory chips (HBM) must be stacked in extremely complex configurations. Rorzes’ U.S. subsidiary Nanoverse is developing next-gen equipment specifically for this purpose. Rorze is evolving from a mere “wafer pusher” into a key player in physical AI infrastructure.
✅3. Geopolitical tailwind: The U.S. 🇺🇸, Europe 🇪🇺, and 🇯🇵 are subsidizing the construction of local semiconductor factories with hundreds of billions. Who equips these factories is irrelevant—Rorze’s robots are needed in nearly every one of them. They win, no matter which chip manufacturer comes out on top.
✅4. A unique competitive moat through cleanroom validation: Chip manufacturers are extremely risk-averse. Once a Rorze robot is certified and validated for a TSMC production line, it’s never replaced—out of fear of production downtime. The barriers to switching are astronomical.
✅5. Index knighthood: Rorze $6323 was recently included in the prestigious JPX Prime 150 Index . This continuously attracts fresh institutional ETF and fund money to the stock.
5. Risks ⚠️
❗️Extreme dependence on the semiconductor cycle: If the tech world were to slip into a deep recession and the tech giants were to freeze their new factory construction (Capex), Rorze—as a cyclical equipment supplier—would feel the impact with a time lag, but it would hit hard.
❗️The competition never sleeps: Players such as Daifuku $6383 (-0,79 %) or Brooks Automation are also making inroads into the field of factory automation. Rorze must absolutely maintain its technological lead in the vacuum sector.
❗️Investment Rating: With a P/E ratio above 40, the potential for an earnings surge over the next 12–24 months is already largely priced in. Setbacks in the volatile semiconductor market are possible at any time.
6. Personal Conclusion & Reaper Bonus 🧐
Rorze Corp $6323 is the ultimate “shovel stock” for the global semiconductor and AI frenzy. They don’t build chips; they make production possible in the first place. Following the explosion in order volume in the summer of 2026, the market has finally realized what a gem has been lying dormant here in the Japanese small/mid-cap sector. It’s on my watch list 👀
💀Jack’s Verdict:
"If ASML builds the priceless high-tech camera for a Hollywood blockbuster, Rorze supplies the indispensable tripod: Without its vacuum robots, the entire chip production process would be thrown off balance. The market has underestimated this unassuming monopolist for years, which is why the stock is now delivering its well-deserved payoff at 4,940 JPY. Don’t be put off by the seemingly high P/E ratio of 42—as soon as the latest record orders are fully reflected in the income statement and the projected profit growth of nearly 50 percent kicks in, the valuation will shrink rapidly. Those who missed the entry point should lie in wait for the next collective semiconductor hiccup, pick up shares on the pullback, and let the robots in the cleanroom work for them."
Reaper Rating: 🔥 BUY ON DIPS (Fundamentals are extremely strong, but the chart has become overheated after the stock doubled in price).
Reaper Score:
8/10 (Quality anchor 8–9. The fundamental monopoly position deserves a 9, but the current valuation pushes the score down slightly to a well-deserved 8)
I’m curious to hear your thoughts🙇♂️
@Get_Rich_Or_Die_Tryin @Tenbagger2024
@PikaPika0105
@Raketentoni
@Multibagger
@schlimmschlimm
@Stocktective
@Dividendenopi and, of course, everyone else ✌️
+ 4
2525
22 Comentarios
Very nicely done. I really like the design. It's a shame that the graphics don't look as good on GetQuin. It would also be ideal to be able to share PowerPoint presentations here.
•
44
•Valores en tendencia
Principales creadores de la semana
Datos LSX · Datos fundamentales y de cierre diario de FactSet