
In August, gold mines were the market's top performers. In September, they were the most expensive. Fresnillo
$FRES (-4,12 %) down 15 percent, Micron
$MU (+3,65 %) up 17. At the end of the month, the Wikifolio was up 1.03 percent, and one day later, I swapped out 18 of 30 positions.
September was all about interest rates and oil. Brent rose above $100 in the second week and, following a Saudi pipeline outage, briefly hit $110. U.S. inflation stood at 3.4 percent in August. On September 16, the Fed raised the benchmark interest rate by a quarter point to 3.75 to 4.00 percent, for the first time since July 2023. The 10-year U.S. yield subsequently climbed to 5.19 percent, a level last seen in 2007. This hardly bothered tech stocks. The Nasdaq hit a record high on September 21, and AMD has been worth one trillion dollars ever since. The situation was different in Europe. German inflation jumped to 3.3 percent, and the DAX lost about four percent over the month.
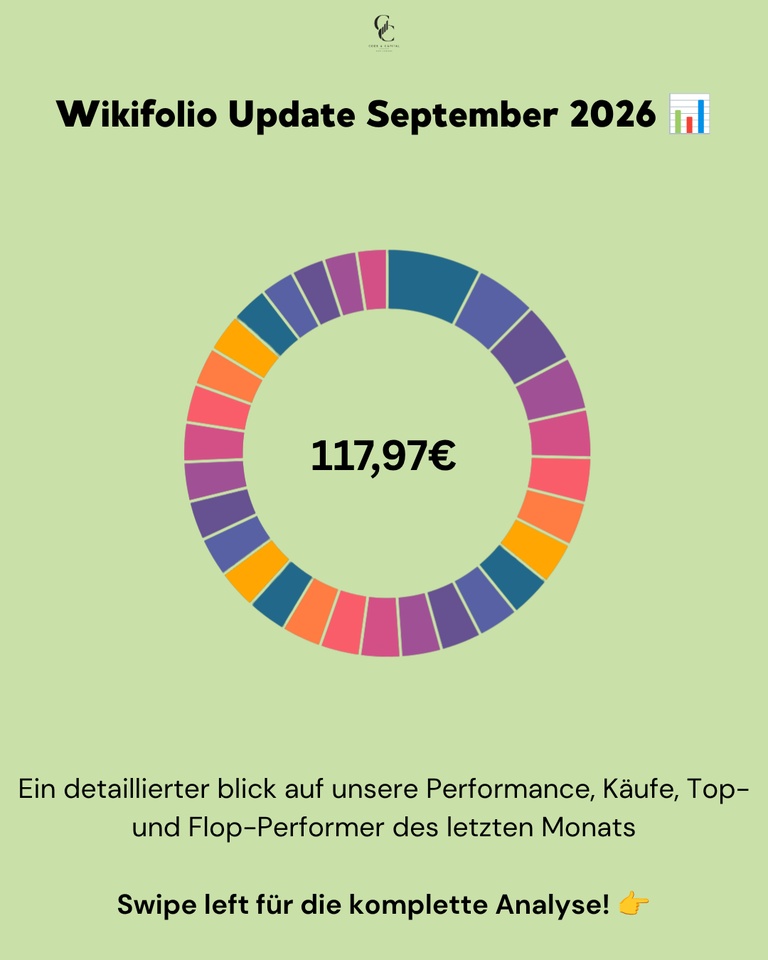
📊 Monthly performance: +1.03%
📊 Price as of September 30: €117.97
📊 Largest loss since inception: −14.6%
📊 Max performance: +18% (since March 13, 26)
Next rebalancing: Early January 2027
Performance & Comparison 🚀
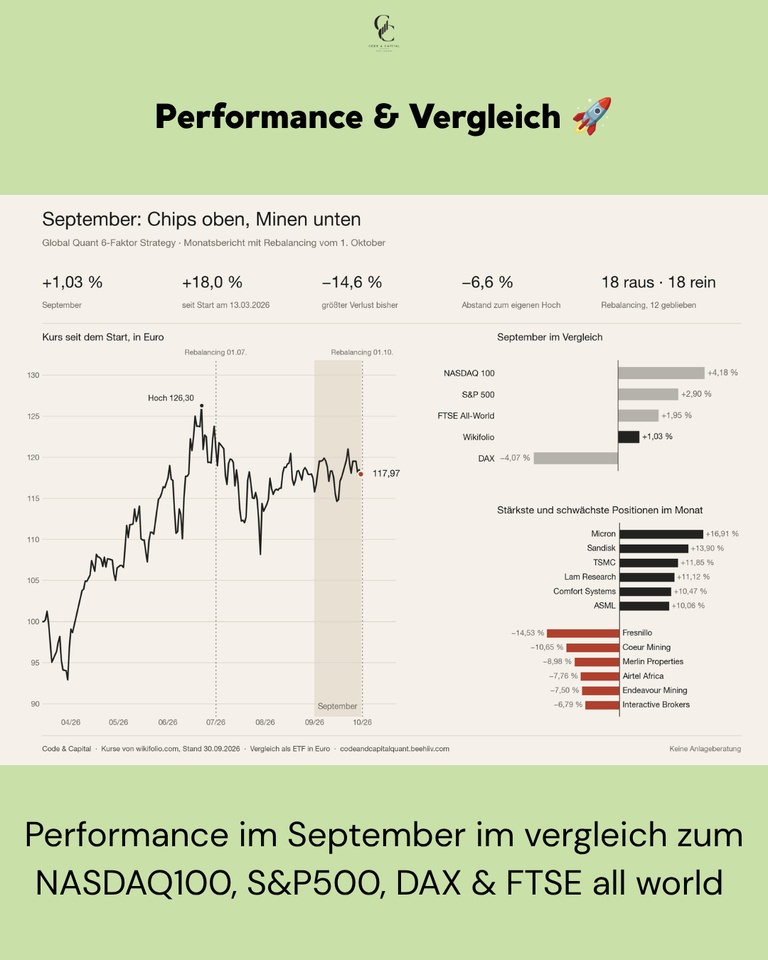
The U.S. indices posted clear gains when calculated in euros, with the Nasdaq leading the way. The Wikifolio did not keep pace. It lagged behind the Nasdaq, S&P 500, and FTSE All-World, and outperformed only the DAX.
Performance Comparison (September 1–30, 2026, end of day):
Global Quant 6-Factor: +1.03%
NASDAQ 100: +4.18%
S&P 500: +2.90%
FTSE All-World: +1.95%
DAX: −4.07%
You can see what caused this in the two lists below. Tech stocks delivered, while mining stocks and a few individual stocks ate up a good chunk of those gains.
Purchases & Sales 💶
None in September itself. The model trades only on four dates per year, and the third was on October 1. What happened then is detailed in its own section below.
Top Movers in September 🟢
The month belonged to semiconductors and memory stocks. Midway through the month, Intel’s CEO said the company could currently only meet about half of the demand for processors. After that, the entire industry picked up steam. Micron
$MU (+3,65 %) topped the list with +16.91%, followed by SanDisk
$SNDK (+0,91 %) at +13.90% and TSMC
$2330 at +11.85%. Lam Research
$LRCX (+0,98 %) rose +11.12%, ASML
$ASML (+0,71 %) +10.06%. In between is Comfort Systems $FIX (-0,29 %) , a stock that has nothing to do with chips, up 10.47%. In August, Comfort Systems was still among the losers.
September’s Big Losers 🔴
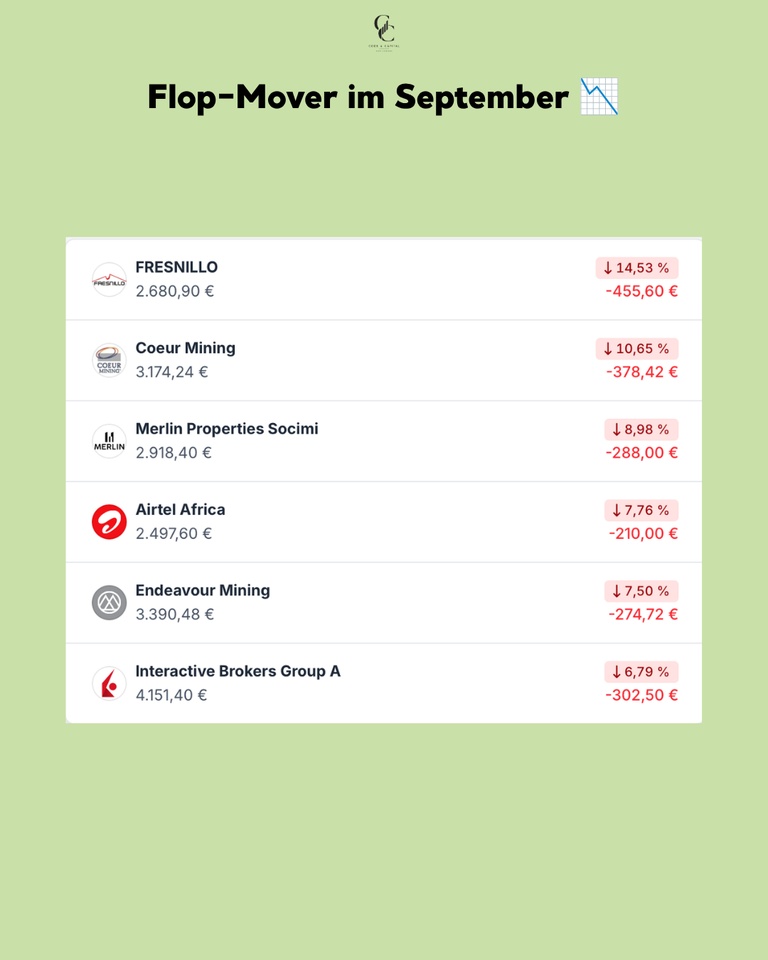
Gold and silver declined in September, with silver falling much more sharply. Rising yields and a stronger dollar weighed on prices. Mining stocks followed suit. Fresnillo
$FRES (-4,12 %) lost −14.53%, Coeur Mining
$CDE (-2,82 %) −10.65%, and Endeavour Mining $EDV (-3,45 %) -7.50%. In August, all three were still on the other list with gains of over 25 percent. Merlin Properties fell −8.98%, Airtel Africa
$AAF (-2,1 %) down 7.76%, and Interactive Brokers
$IBKR (-1,68 %) fell by 6.79%.
Rebalancing on October 1 🔄
On October 1, the third rebalancing since the start took place. I swapped out 18 of 30 positions—more than ever before. In July, it was nine.
All nine banks are out: Bankinter
$BKT (+0,13 %) , CaixaBank
$CABK (+1,34 %) , BBVA
$BBVA (-0,45 %) , UniCredit
$UCG (+0,34 %) , BPER
$BPE (-0,87 %) , Monte dei Paschi $BMPS (+0,51 %) , Banca Mediolanum
$BMED (-1,14 %) , Swedbank$SWED A (-0,26 %) and HSBC
$HSBA (-0,73 %) . In addition, Interactive Brokers $IBKR (-1,68 %) , Antofagasta $ANTO (+0,57 %) , Coeur Mining
$CDE (-2,82 %) , AppLovin
$APP (-0,8 %) , Airtel Africa
$AAF (-2,1 %) , Merlin Properties and Solaria
$SLR (-0,4 %) . Investor AB
$INVE B (+0,02 %) and Pershing Square
$PSH (-1,11 %) are also no longer in the portfolio. So four of the six underperformers listed above are no longer in the portfolio.
Six stocks from the healthcare sector were added: Eli Lilly
$LLY (-2,35 %) , Bristol-Myers
Squibb
$BMY (-2,19 %) , Vertex $VRTX , Incyte
$INCY (-1,55 %) , Illumina
$ILMN (+0,12 %) and WuXi AppTec
$603259 . Five are from the semiconductor and storage sectors: Seagate
$STX (+3,48 %) , Marvell
$MRVL (+3,42 %) , Applied
Materials
$AMAT (+0,68 %), Teradyne
$TER (+1,66 %) and KLA
$KLAC (-0,43 %) . The rest is split among Fortinet
$FTNT (+3,29 %) , CF Industries
$CF (+1,92 %) , Marathon Petroleum
$MPC (-0,43 %) , APA
$APA (+6,41 %) , Pop Mart $9992 (+3,44 %) , Hong Kong Exchanges
$388 (+0,33 %) and Lion Finance
$BGEO (-0,34 %) .
Twelve remain: SanDisk, Micron, Western Digital, Nvidia, Lam Research, TSMC, ASML, Alphabet, Comfort Systems, Fresnillo, Endeavour and Newmont. All six of September’s top movers are included.
Two names stand out. Applied Materials and KLA I sold on July 1, up 92 and a gain of 90 percent. Now both are back in my portfolio. The model doesn’t remember what it has sold in the past. It only looks at where a stock stands in the ranking today.
Conclusion 💡
The portfolio looks different after October 1 than it did before. In September, about 41 percent was still in financial stocks; now there are two positions out of 30. Instead, 12 out of 30 are in semiconductors and memory, and six are in the healthcare sector. There’s no sector limit; the model sorts by score, not by industry. Trading won’t resume until early January.
How was your September? And did you hold onto your stocks after the pullback, or did you sell them? 👇
➡️ Every month, you’ll find the complete Wikifolio update here, along with research in between.
📈 Wikifolio $DE000LS9V052 (+0,4 %)