
$MC (-1,51 %)
$JPM (+1,07 %)
$GS (-1 %)
$C (+0,62 %)
$UNH (-1,66 %)
$JNJ (+0,73 %)
$DPZ (+1,48 %)
$WFC (+1,21 %)
$ASML (-1,11 %)
$BAC (-0,89 %)
$BLK (+1,13 %)
$MS (-0,51 %)
$STT (-1,27 %)
$TSM (-2,13 %)
$IBKR (-2,96 %)
$SU (-3,1 %)

Interactive Brokers
Stock
Stock
Ticker: IBKR
IBKR
Price
Debate sobre IBKR
Puestos
16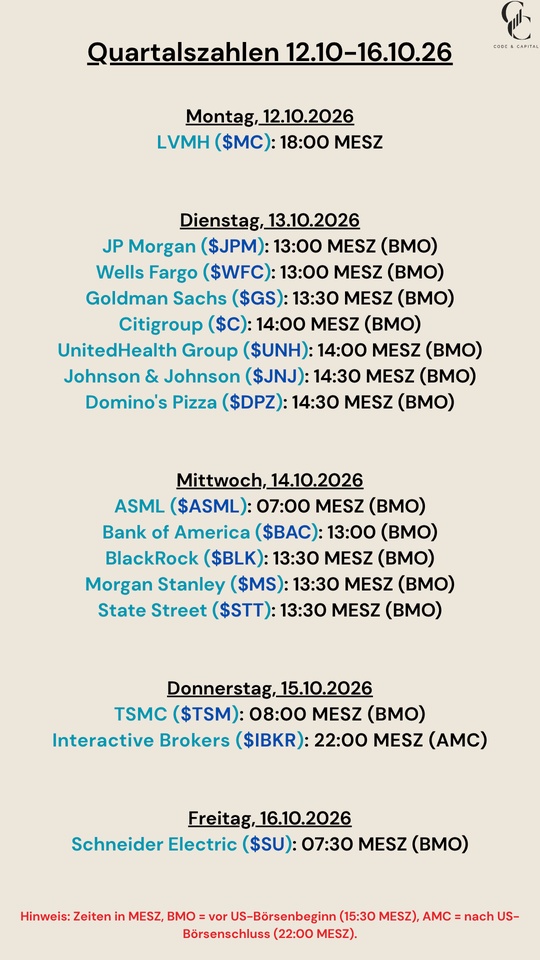
1Semana·
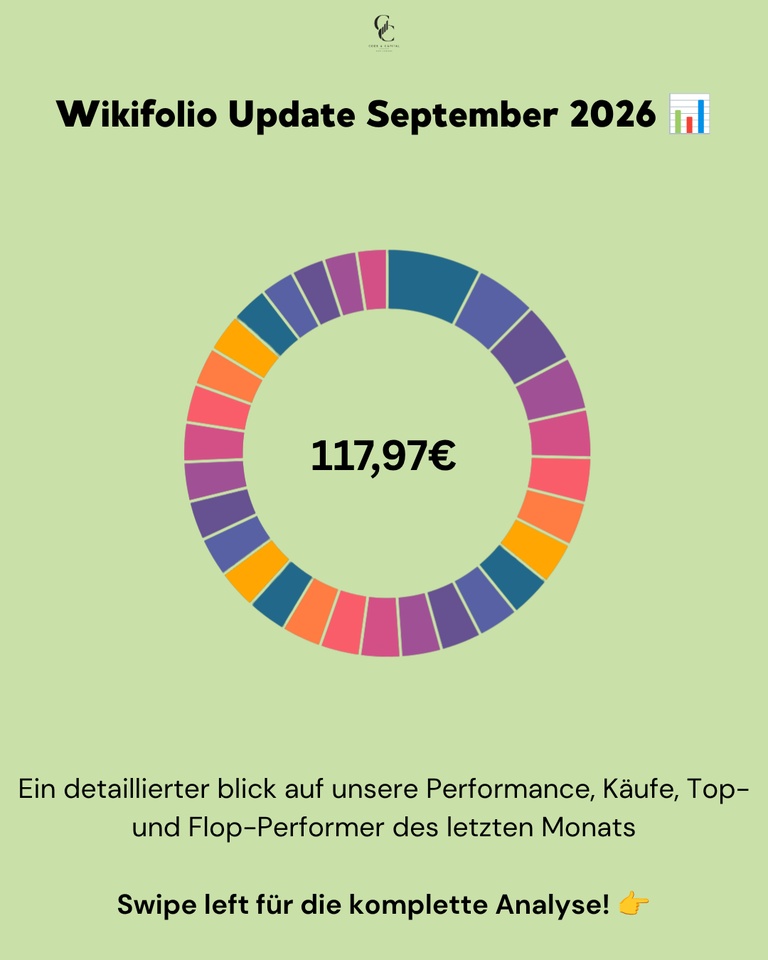
📊 Wikifolio Update September 2026: up 1.03%, tech stocks up, mining stocks down, and 18 of 30 positions swapped on October 1
In August, gold mines were the market's top performers. In September, they were the most expensive. Fresnillo
$FRES (+2,67 %) down 15 percent, Micron
$MU (-5,27 %) up 17. At the end of the month, the Wikifolio was up 1.03 percent, and one day later, I swapped out 18 of 30 positions.
September was all about interest rates and oil. Brent rose above $100 in the second week and, following a Saudi pipeline outage, briefly hit $110. U.S. inflation stood at 3.4 percent in August. On September 16, the Fed raised the benchmark interest rate by a quarter point to 3.75 to 4.00 percent, for the first time since July 2023. The 10-year U.S. yield subsequently climbed to 5.19 percent, a level last seen in 2007. This hardly bothered tech stocks. The Nasdaq hit a record high on September 21, and AMD has been worth one trillion dollars ever since. The situation was different in Europe. German inflation jumped to 3.3 percent, and the DAX lost about four percent over the month.
📊 Monthly performance: +1.03%
📊 Price as of September 30: €117.97
📊 Largest loss since inception: −14.6%
📊 Max performance: +18% (since March 13, 26)
Next rebalancing: Early January 2027
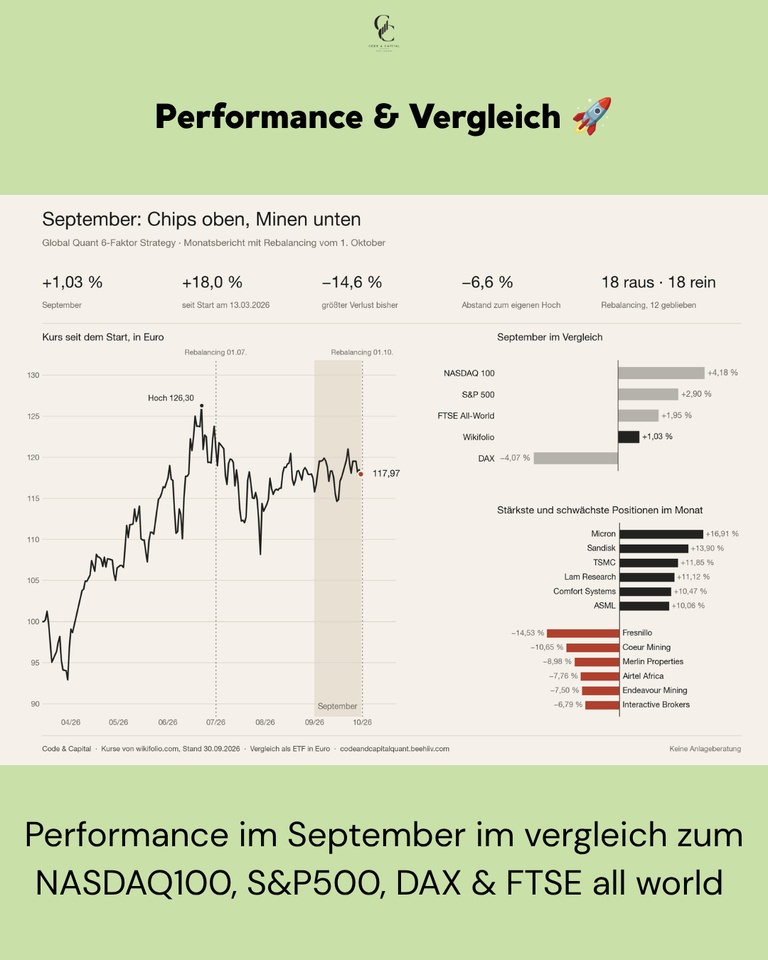
Performance & Comparison 🚀
The U.S. indices posted clear gains when calculated in euros, with the Nasdaq leading the way. The Wikifolio did not keep pace. It lagged behind the Nasdaq, S&P 500, and FTSE All-World, and outperformed only the DAX.
Performance Comparison (September 1–30, 2026, end of day):
Global Quant 6-Factor: +1.03%
NASDAQ 100: +4.18%
S&P 500: +2.90%
FTSE All-World: +1.95%
DAX: −4.07%
You can see what caused this in the two lists below. Tech stocks delivered, while mining stocks and a few individual stocks ate up a good chunk of those gains.
Purchases & Sales 💶
None in September itself. The model trades only on four dates per year, and the third was on October 1. What happened then is detailed in its own section below.
Top Movers in September 🟢
The month belonged to semiconductors and memory stocks. Midway through the month, Intel’s CEO said the company could currently only meet about half of the demand for processors. After that, the entire industry picked up steam. Micron
$MU (-5,27 %) topped the list with +16.91%, followed by SanDisk
$SNDK (-5,71 %) at +13.90% and TSMC
$2330 at +11.85%. Lam Research
$LRCX (-4,43 %) rose +11.12%, ASML
$ASML (-1,11 %) +10.06%. In between is Comfort Systems $FIX (-3,63 %) , a stock that has nothing to do with chips, up 10.47%. In August, Comfort Systems was still among the losers.
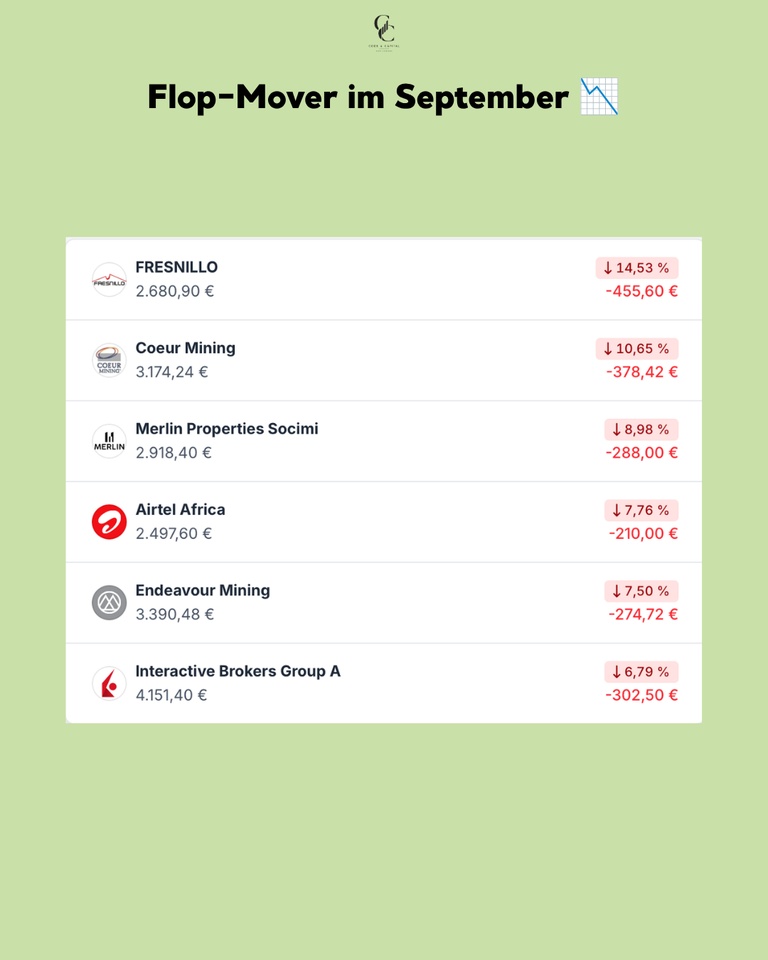
September’s Big Losers 🔴
Gold and silver declined in September, with silver falling much more sharply. Rising yields and a stronger dollar weighed on prices. Mining stocks followed suit. Fresnillo
$FRES (+2,67 %) lost −14.53%, Coeur Mining
$CDE (+0,59 %) −10.65%, and Endeavour Mining $EDV (+2,24 %) -7.50%. In August, all three were still on the other list with gains of over 25 percent. Merlin Properties fell −8.98%, Airtel Africa
$AAF (+0 %) down 7.76%, and Interactive Brokers
$IBKR (-2,96 %) fell by 6.79%.
Rebalancing on October 1 🔄
On October 1, the third rebalancing since the start took place. I swapped out 18 of 30 positions—more than ever before. In July, it was nine.
All nine banks are out: Bankinter
$BKT (-0,67 %) , CaixaBank
$CABK (-0,52 %) , BBVA
$BBVA (-0,65 %) , UniCredit
$UCG (-0,09 %) , BPER
$BPE (-0,72 %) , Monte dei Paschi $BMPS (-0,16 %) , Banca Mediolanum
$BMED (-0,65 %) , Swedbank$SWED A (+0,03 %) and HSBC
$HSBA (+0,08 %) . In addition, Interactive Brokers $IBKR (-2,96 %) , Antofagasta $ANTO (-1,75 %) , Coeur Mining
$CDE (+0,59 %) , AppLovin
$APP (-4,57 %) , Airtel Africa
$AAF (+0 %) , Merlin Properties and Solaria
$SLR (+2,8 %) . Investor AB
$INVE B (+0,95 %) and Pershing Square
$PSH (-0,45 %) are also no longer in the portfolio. So four of the six underperformers listed above are no longer in the portfolio.
Six stocks from the healthcare sector were added: Eli Lilly
$LLY (+0,49 %) , Bristol-Myers
Squibb
$BMY (-1,22 %) , Vertex $VRTX , Incyte
$INCY (+0,5 %) , Illumina
$ILMN (-2,17 %) and WuXi AppTec
$603259 . Five are from the semiconductor and storage sectors: Seagate
$STX (-6,28 %) , Marvell
$MRVL (-5,33 %) , Applied
Materials
$AMAT (-4,64 %), Teradyne
$TER (-5,27 %) and KLA
$KLAC (-3,72 %) . The rest is split among Fortinet
$FTNT (-7,17 %) , CF Industries
$CF (+0,49 %) , Marathon Petroleum
$MPC (+0,76 %) , APA
$APA (+3,88 %) , Pop Mart $9992 (-1,22 %) , Hong Kong Exchanges
$388 (-0,26 %) and Lion Finance
$BGEO (-2,36 %) .
Twelve remain: SanDisk, Micron, Western Digital, Nvidia, Lam Research, TSMC, ASML, Alphabet, Comfort Systems, Fresnillo, Endeavour and Newmont. All six of September’s top movers are included.
Two names stand out. Applied Materials and KLA I sold on July 1, up 92 and a gain of 90 percent. Now both are back in my portfolio. The model doesn’t remember what it has sold in the past. It only looks at where a stock stands in the ranking today.
Conclusion 💡
The portfolio looks different after October 1 than it did before. In September, about 41 percent was still in financial stocks; now there are two positions out of 30. Instead, 12 out of 30 are in semiconductors and memory, and six are in the healthcare sector. There’s no sector limit; the model sorts by score, not by industry. Trading won’t resume until early January.
How was your September? And did you hold onto your stocks after the pullback, or did you sell them? 👇
➡️ Every month, you’ll find the complete Wikifolio update here, along with research in between.
📈 Wikifolio $DE000LS9V052 (-2,4 %)

+ 1
77
8 Comentarios
Epi@Epi
1Semana
•
11
•Ver todas las 5 respuestas adicionales
2Lun·
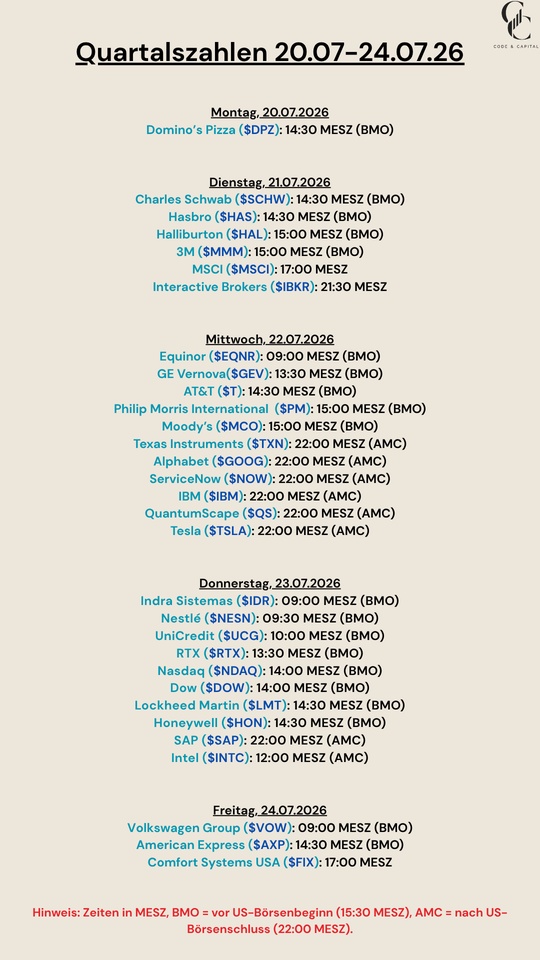
Quarterly Results: July 20–24, 2026
$DPZ (+1,48 %)
$SCHW (-2,45 %)
$HAS (-0,44 %)
$HAL (+2,01 %)
$MMM (-0,51 %)
$MSCI (-1,21 %)
$IBKR (-2,96 %)
$EQNR (+4,14 %)
$GEV (-0,98 %)
$T (-0,24 %)
$PM (+1,8 %)
$MCO (-0,12 %)
$TXN (-0,48 %)
$GOOG (-2,22 %)
$NOW (-4,97 %)
$IBM (-1,11 %)
$QS (-4,77 %)
$TSLA (-2,72 %)
$IDR (-0,39 %)
$NESN (+2,23 %)
$UCG (-0,09 %)
$RTX (+3,61 %)
$NDAQ (+1,15 %)
$DOW (+0,64 %)
$LMT (+3,31 %)
$HON (+0,27 %)
$SAP (-0,79 %)
$INTC (-5,89 %)
$VOW (+2,08 %)
$AXP (-0,32 %)
$FIX (-3,63 %)
1010


4Lun·
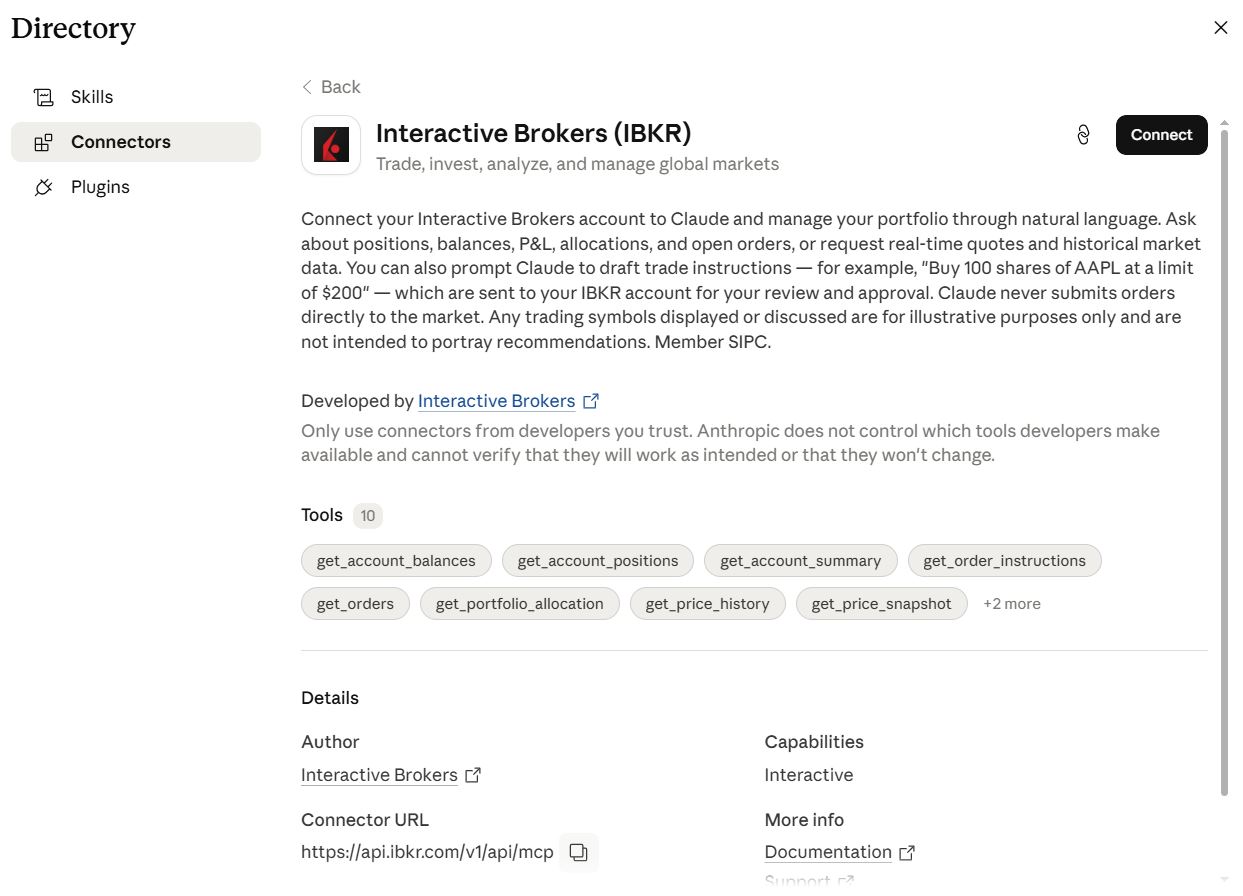
Attention traders! Official Claude.ai Connector for Interactive Brokers☝
$IBKR (-2,96 %) The Interactive Brokers Connector recently landed in Claudeʼs official Connector directory as part of a deliberately small, financially focused week.
It remains exciting, the AI integrations are gradually migrating from community / open source MCP servers to official connectors. This means that access is becoming easier and easier, even if you are not an AI freak!
TradingView has recently launched its own AI plug-in, Remix, and now also the official connector from IBKR for Claude🙄😵
I'm not a NeoBroker user, but I'm curious to see which NeoBroker will be the first with AI integration. It will probably only be a matter of time now🤐
⚠️ Important restriction
Since the connector touches real capital, a "human in the loop" is strongly recommended. The most sensible use is: Claude takes over research, analysis and pre-trade considerations. You make the final decision.
📋 Functions at a glance
The connector offers multi-account support, short-selling analysis (available shares, borrow rates, margin requirements), real-time market data (live quotes, historical data, option chains), portfolio management (positions, P&L, account balance) and trading operations such as placing, modifying and canceling orders.
The connector is still of limited use for my day trading, as the latency times are still too high (Claude statement). But it is ideal for all steps before that, as IBKR also offers all technical and fundamental data. Newsfeed, earnings documents, analyst opinions, sentiments, etc... all this data is available at Interactive Brokers.
This is what Claude says:
💡 My recommendation for your day trading
I would use the Connector for your trades:
- Analyze: Query portfolio status, open positions, P&L live
- Preparation: Calculate stop-loss and take-profit levels directly
- Execution: Still via TWS/Mobile - you are faster there
I would not yet trust direct order execution via Claude for day trades with narrow time windows. Too much latency with Beta 4.2!
1111
9 Comentarios
4Lun
Very exciting! I have already worked out my strategies with Claude Opus, these connectors take the whole thing to another level.
•
22
•5Lun·
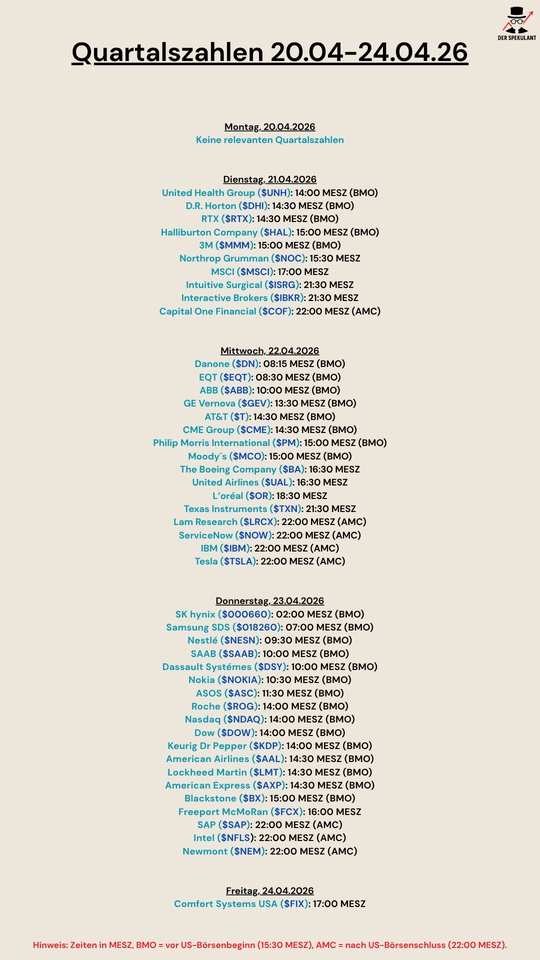
Quarterly figures 20.04-24.04.26
$UNH (-1,66 %)
$DHI (-0,28 %)
$RTX (+3,61 %)
$HAL (+2,01 %)
$MMM (-0,51 %)
$NOC (+4,37 %)
$MSCI (-1,21 %)
$IBKR (-2,96 %)
$ISRG (-0,56 %)
$COF (+1,27 %)
$BN (-0,42 %)
$EQT (+3,32 %)
$ABBN (-1,67 %)
$GEV (-0,98 %)
$T (-0,24 %)
$CME (+0,79 %)
$PM (+1,8 %)
$MCO (-0,12 %)
$BA (+0,57 %)
$UAL (-5,09 %)
$OR (-0,46 %)
$TXN (-0,48 %)
$LRCX (-4,43 %)
$NOW (-4,97 %)
$IBM (-1,11 %)
$TSLA (-2,72 %)
$000660
$018260
$NESN (+2,23 %)
$SAAB B (+1,81 %)
$DSY (-0,91 %)
$NOKIA (-4,21 %)
$ASC (+0,36 %)
$ROG
$NDAQ (+1,15 %)
$DOW (+0,64 %)
$KDP (+1,02 %)
$AAL (-0,89 %)
$LMT (+3,31 %)
$AXP (-0,32 %)
$BX (-2,81 %)
$FCX (-0,85 %)
$SAP (-0,79 %)
$INTC (-5,89 %)
$NEM (+2,11 %)
$FIX (-3,63 %)
1212

6Lun·
Apr 15 / Will This Be A Trend-Setting Earnings Season?
Earnings season is fully underway now, and today I want to focus on what actually matters over the coming week. We’ve already had some heavy hitters reporting, most notably large banks like JPMorgan, Goldman Sachs and Citi. Overall, results were solid, with beats across the board.
One of my more recent holdings, BlackRock, also reported earlier this week. There was nothing out of the ordinary, just a strong quarter as expected, and the stock rebounded sharply, which puts my position roughly 10% in the green. The stock had been caught between private credit fears and a possible global energy crisis, but this latest report has reminded investors, once again, of the business’ strength. However, next week is where things get even more interesting for me personally.
The key question is how the so-called “SaaSpocalypse” will actually show up in the numbers. So far, even the seemingly most vulnerable platforms like Adobe are still delivering consistent growth with no real signs of weakness. Let’s see if that can continue, or if the “AI kills software” narrative survives another round.
Big names reporting next week include ServiceNow, Salesforce and SAP, all of which are deeply integrated ecosystems that keep multi-billion-dollar companies running. So as a shareholder, I wouldn’t worry too much. I actually considered adding to my already considerable ServiceNow position at $80, but before I could, the stock spiked again. Better luck next time, I guess.
Another area worth watching next week are brokers and exchanges like IBKR, CME and Nasdaq, which should give a fairly clean read on market activity. And of course, the “real” economy will be a major factor as well. Companies like General Electric, Boeing and D.R. Horton should give a better indication of how things are actually holding up, beyond what certain figures in the White House would like people to believe.
That’s the outlook for the early stages of this current earnings season. The most important reports, especially the ones I’m personally exposed to, will come later in the cycle and I’ll cover those separately.
On a more personal note, and don’t take this too seriously though, there is one company where I wouldn’t mind seeing a bad quarter, and that’s Intuitive Surgical. For a very simple reason: I want to buy it, but the valuation is still at exorbitant levels. Quite similar to Axon actually.
$JPM (+1,07 %)
$GS (-1 %)
$C (+0,62 %)
$BLK (+1,13 %)
$CRM (-2,39 %)
$NOW (-4,97 %)
$SAP (-0,79 %)
$IBKR (-2,96 %)
$CME (+0,79 %)
$NDAQ (+1,15 %)
$GE (+0,44 %)
$BA (+0,57 %)
$DHI (-0,28 %)
$ISRG (-0,56 %)
$AXON (-6,46 %)

77


1Año·
Interactive Brokers Q2'25 Earnings Highlights
🔹 Net Revenue: $1.48B (Est. $1.38B) 🟢; UP +15% YoY
🔹 Adj EPS: $0.51 (Est. $0.46) 🟢; UP +16% YoY
🔹 Net Interest Income: $860M (Est. $794.7M) 🟢; UP +9% YoY
🔹 Commission Revenue: $516M; UP +27% YoY
🔹 Pretax Profit: $1.10B; UP +17% YoY
🔹 Pretax Margin: 75%; UP from 73% YoY
Key Customer Metrics
🔹 Customer Accounts: 3.87M (Est. 3.86M) 🟢; UP +32% YoY
🔹 Customer Equity: $664.6B; UP +34% YoY
🔹 Customer Margin Loans: $65.1B; UP +18% YoY
🔹 Avg. Customer Margin Loans: $60.93B (Est. $61.02B) 🟡
🔹 Customer Credits: $143.7B; UP +34% YoY
🔹 Daily Avg. Revenue Trades (DARTs): 3.55M; UP +49% YoY
Other Metrics
🔹 Execution, Clearing & Distribution Fees: $116M; UP +1% YoY
🔹 Other Fees & Services: $62M; DOWN -9% YoY
🔹 G&A Expenses: $61M; UP +17% YoY
🔹 Operating Income: $1.10B; UP +17% YoY
Capital & Returns
🔹 Total Equity: $18.5B
🔹 Quarterly Dividend: $0.08/share (Payable Sep 12, 2025)
77
1Año·
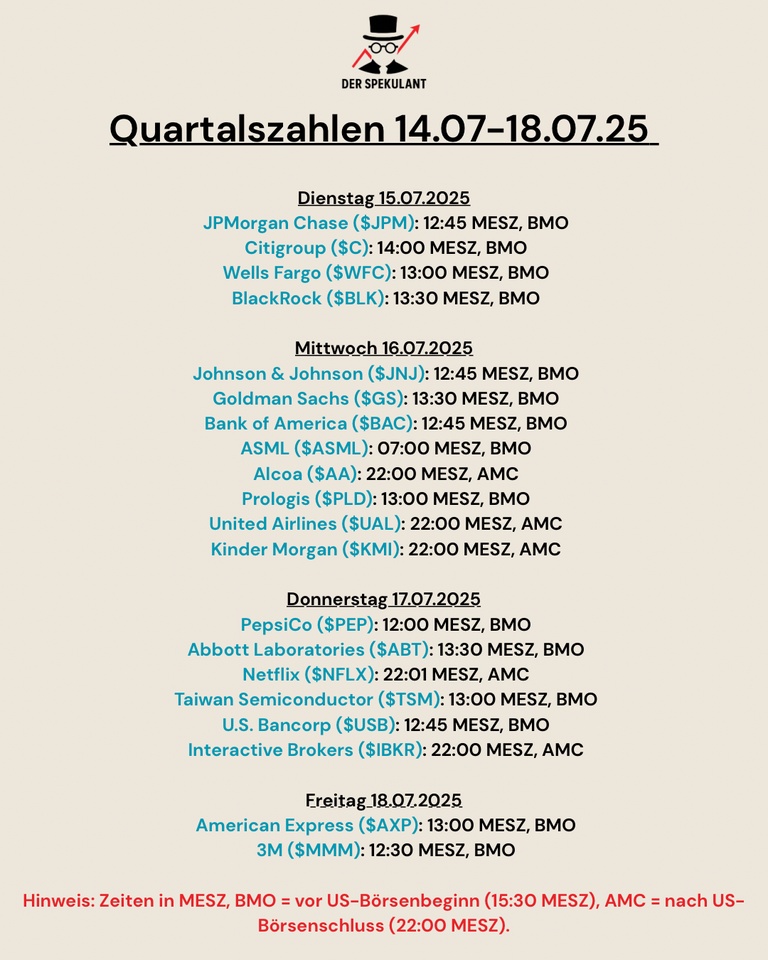
The earnings season begins again!
As the earnings season starts again, here is a summary of the most important figures next week.
$JPM (+1,07 %)
$C (+0,62 %)
$WFC (+1,39 %)
$BLK (+1,13 %)
$JNJ (+0,73 %)
$GS (-1 %)
$BAC (-0,89 %)
$AA (+1,42 %)
$ASML (-1,11 %)
$PLD (-1,21 %)
$UAL (-5,09 %)
$KMI (+3,37 %)
$PEP (+1,98 %)
$ABT (-0,11 %)
$Netflix
$TSM (-2,13 %)
$USB (+1,94 %)
$IBKR (-2,96 %)
$AXP (-0,32 %)
$MMM (-0,51 %)


1Año·
Interactive Brokers Taxes
Does anyone here have experience with the taxation of interest payments and dividends at Interactive Brokers?
I opened an account with IBKR last year to park part of my cash reserve in USD.
The idea was:
- Diversification
- Take high interest rates with you
- To invest the money in a stronger market decline in $SPY (-1,35 %) to invest
I am aware that IBKR is not tax-simple for Germans and that you have to be active yourself.
Is it now possible to export complete annual reports there, which I can put on my tax advisor's desk?
Thank you!
22
4 Comentarios
1Año
If you use IB via Cap Trader, there is probably now a tax report adapted to German requirements.
I myself use IB via estably, formerly Banx. It comes down to getting the transaction report and my own Excel tables into the tax return. It usually takes 2-3 hours. I always write a note with explanations and hand in the transaction report and my Excel spreadsheets on request. The time before last, I had to go to the tax office and explained the report to the lady in a personal meeting. Last time, I submitted everything and it went straight through.
I myself use IB via estably, formerly Banx. It comes down to getting the transaction report and my own Excel tables into the tax return. It usually takes 2-3 hours. I always write a note with explanations and hand in the transaction report and my Excel spreadsheets on request. The time before last, I had to go to the tax office and explained the report to the lady in a personal meeting. Last time, I submitted everything and it went straight through.
•
11
•