
$ABBN (-1,59 %)
$GE
$RTX (-0,1 %)
$HAL (+0,41 %)
$MMM (-0,42 %)
$NOC (-0,58 %)
$MSCI (-0,13 %)
$ISRG (-0,35 %)
$SPCX (+1,08 %)
$NFLX (-0,34 %)
$DB1 (-1,97 %)
$CME (+0,26 %)
$T (-3,98 %)
$PM (+0,14 %)
$MCO (-0,34 %)
$NEE (+0,08 %)
$UAL (-0,33 %)
$MONC (-1,95 %)
$TXN (+0,09 %)
$META (+0,1 %)
$IBM (-0,19 %)
$SAP (-0,79 %)
$QS (+0 %)
$LRCX (+1,92 %)
$TSLA (+0,71 %)
$RMS (-2,17 %)
$NESN (-1,31 %)
$BARC (-1,41 %)
$ROP (-0,41 %)
$DOW (+0,96 %)
$SPOT (-0,1 %)
$NDAQ (-0,49 %)
$AAL (-0,51 %)
$LMT (-0,29 %)
$PG (-1,1 %)
$BX (-0,99 %)
$BESI (-4,86 %)
$VLO (+0,54 %)
$KER (-5,02 %)
$OR (+1,19 %)
$VRSN (-0,68 %)
$WDC (+5,17 %)
$BE (+4,95 %)
$NEM (-1,96 %)
$TOM (+5,46 %)
$AXP (-1,41 %)
$FIX (+6,66 %)
ABB - Asea Brown Boveri
Stock
Stock
ISIN: CH0012221716
Ticker: ABBN
CH0012221716
ABBN
Price
Debate sobre ABBN
Puestos
285D·
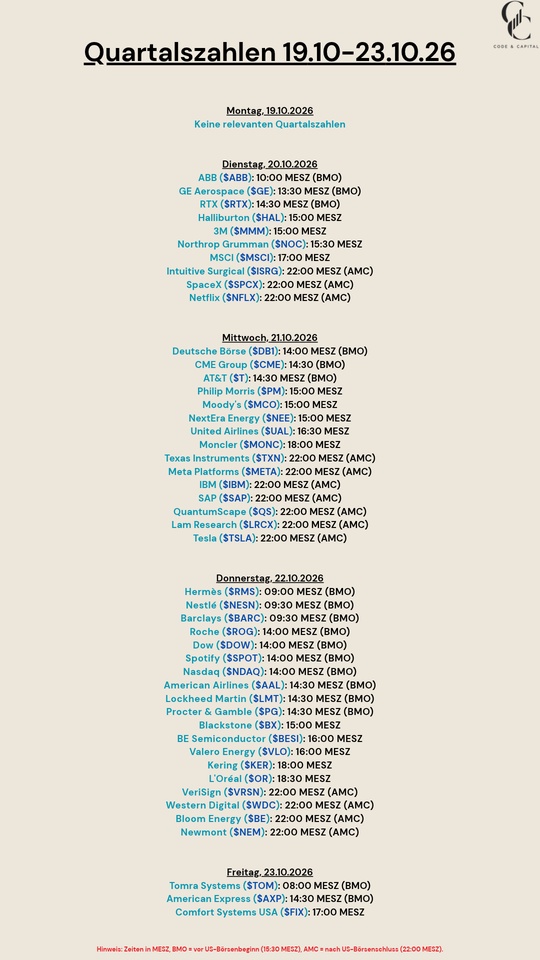
Quarterly Results: Oct. 19–23, 2026
99

2Lun·
The "Berkshire Hathaway of the North"? Why Investor AB Beats the S&P 500
Hi there, community! 🚀
While many investors are desperately searching for the next hot stock, we’ve unearthed a Swedish powerhouse for the defensive A-side of our portfolio.
Imagine a stock that’s basically like a hand-picked Scandinavian quality ETF , has outperformed the market for over 100 years, is led by Northern Europe’s most powerful financial dynasty, and has outperformed even Warren Buffett’s Berkshire Hathaway and the S&P 500 over the past 5 years.
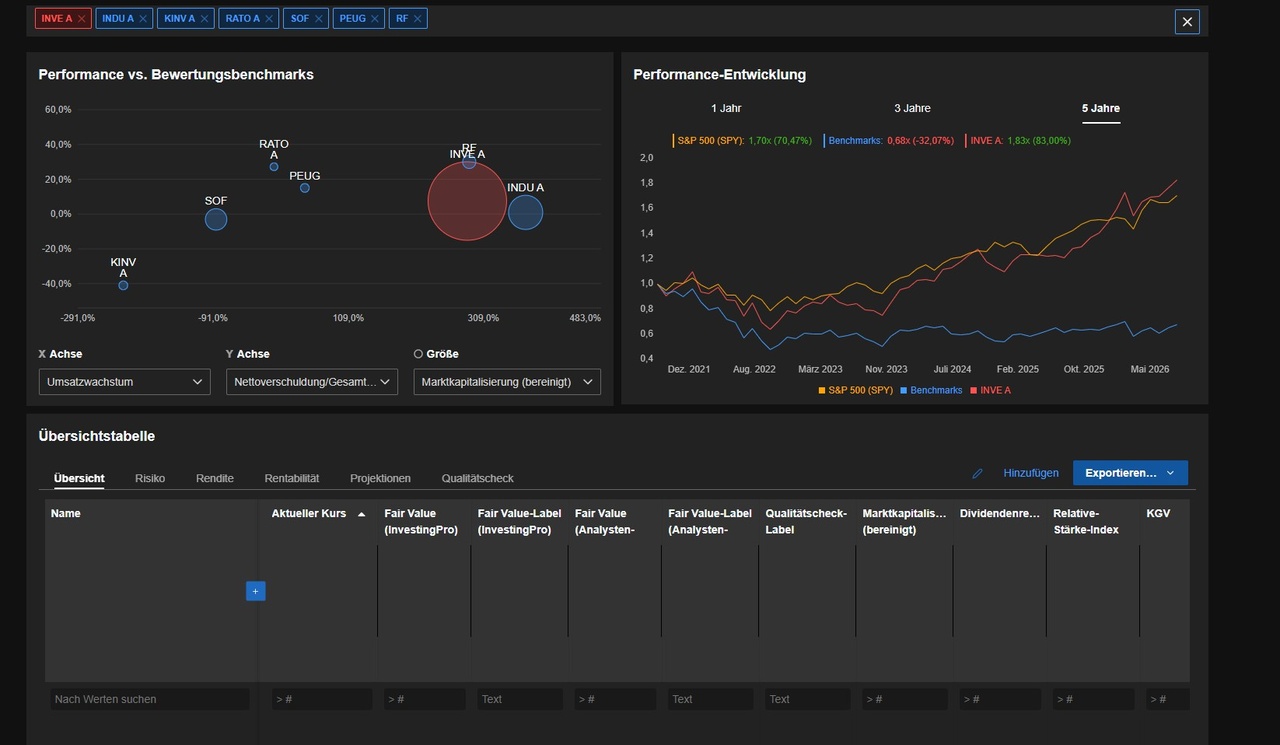
Since the chart for GQ is distorted by the stock split, you’ll find a chart below comparing it to the S&P 500 and others.
That’s exactly what Investor AB $INVE A (-0,66 %)
.
The stock $INVE B (-0,8 %) is exactly the same, except that the voting rights here are 1:10.
Let’s fire up the engine room and lay this Scandinavian money-printing machine on the dissection table, following our 15-point template exactly:
Investor AB ISIN: SE0015811955 ~€38.21 / 440.00 SEK
1. What the company does & how it came to be
The origins: Investor AB was founded as early as 1916 by the legendary Swedish industrialist family Wallenberg as far back as 1916. The family’s philosophy has been the same for generations: “Esse non videri” (To be, not to seem). The Wallenbergs have shaped the Scandinavian economy for over a century.
The Business Model – The Ultimate Scandinavian Compounder:
Investor AB is an investment holding company that allocates its capital across three highly profitable pillars:
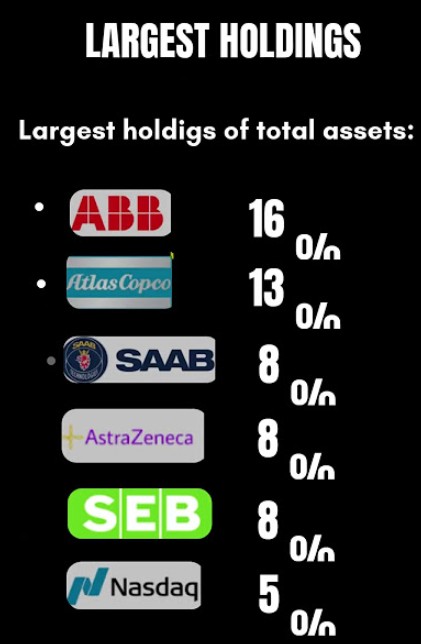
- Listed Core Holdings: The backbone consists of majority or anchor stakes in global market leaders. These include industrial giants such as $ATCO A (-1,47 %)
Atlas Copco (compressed air & vacuum technology), $ABBN (-1,59 %)
ABB (robotics & energy), $AZN (-0,97 %)
AstraZeneca (Pharmaceuticals), $SEB
SEB (Skandinaviska Enskilda Banken), $EPI A (+1,3 %)
Epiroc (mining equipment), $SOBI (-0,71 %)
Sobi (biotech), Nasdaq Inc., Wärtsilä, Electrolux and Husqvarna.
- Unlisted companies (Patricia Industries): Wholly-owned subsidiaries in the medical technology and healthcare sector (e.g., Mölnlycke Health Care, Permobil, Laborie). These cash cows are fully consolidated into Investor AB’s balance sheet and generate steady profits.
- Financial investments (EQT): Investor AB is the largest anchor investor and co-founder of the global private equity giant EQT AB. Here, the company benefits directly from the lucrative buyout and infrastructure business.
2. Current Key Figures & Facts
- Market Capitalization: approx. 116.5 billion EUR / ~1,300 billion SEK
- Current share price:
38.21 EUR (52-week range: €25.67 – €38.26) - Revenue (LTM): approx. 29.63 billion EUR
- Net income (LTM): approx. 23.71 billion EUR
- P/E Ratio: 4.9x
(Extremely cheap for a quality compounder) - P/B Ratio:
1.2x
(Close to net asset value) - Return on Equity (ROCE):
27.3% - Net Debt/Total Capital: A meager 7.5%
(Rock-solid balance sheet)
3. Core Quality Formula (Revenue Growth + Margin)
Our target score for solid investments is > 25.
- Revenue CAGR (5 years):
20.1% p.a. (current LTM revenue growth, driven by consolidation, is as high as 285.1%) - Operating EBIT Margin: Massive 82.1%
- Score = Revenue CAGR 20.1% + EBIT margin 82.1% = 102.2 points
- Conclusion:
Phenomenal! A quality score of 102.2 points completely blows our scale out of the water. Since private equity firms have virtually no physical cost of goods sold, nearly the entire gross profit remains as EBIT.
4. Cash Flow Quality Formula
- Free Cash Flow (FCF) Yield:
1.6% - Conclusion: For a holding company, the FCF yield is naturally lower, as profits are directly reinvested to increase the net asset value (NAV) of the portfolio companies. This reinvestment yields a return on equity of over 27%!
5. Dividend Filter (Income-Core)
- Dividend Yield:
1.35% (~€0.4985 per share) - Payout Ratio:
6.36% (Extremely conservative, maximum leeway) - Dividend growth (5 years):
10.1% p.a. - Growth streak: Increased for 6 consecutive years.
- Filter Exception: Although this appears to fall below our 3.5% minimum threshold, our quality exception: The dividend is growing at a double-digit rate, the balance sheet is extremely strong, and net asset growth is easily outpacing the overall market.
- 🇸🇪 Tax Note for Sweden: Sweden levies a 30% withholding tax. Under the double taxation treaty (e.g., with Germany or Denmark), 15% is directly credited, so there are no tax disadvantages.
6. Exclusion Rule Check
Does any of our exclusion rules apply? Not at all!
- The EBIT margin is > 80%.
- No debt problems (net debt at a meager 7.5%).
- A genuine value investment rather than a stock based on an empty narrative.
7. Future and Industry Outlook
The mix of automation (Atlas Copco, ABB), healthcare (AstraZeneca, Mölnlycke), digitalization (Nasdaq, EQT), and mining (Epiroc) addresses the most important megatrends of the coming decades.
Through the Wallenbergs’ active management, $INVE A (-0,66 %) , underperforming holdings are consistently restructured and investments in future-oriented sectors are increased.
8. Competition
Compared to other Scandinavian holding companies (such as Latour, Kinnevik, or Indutrade) and global holding companies, its visual superiority is evident:
- 5-Year Performance: Over the past 5 years, Investor AB has achieved a total return of +83.00% —while the S&P 500 (SPY) returned +70.47% and other European benchmarks stood at -32.07% !
9. Analyst Forecasts & Fair Value
- Fair Value Model (InvestingPro):
42.22 EUR - Upside Potential:
+10.5% from the current all-time high - Quality Check Rating:
4 out of 5 (Very good)
10. Chart Analysis of Recent Months
- Trend: A solid, crystal-clear upward trend from the lower left to the upper right.
- 52-week range: €25.67 to €38.26 (currently at an all-time high).
- Distance from moving averages:
- Current price +7.2% above the 50-day moving average.
- Price is trading +18.4% above the 200-day moving average.
- Volatility: Extremely low volatility.
11. Bargain Hunter List (Entry Zones)
Since the stock is currently trading near its 52-week high, the following zones are suitable for phased purchases:
Zone 1 (Direct Purchase / First Tranche):
- Price range: €37.50 – €38.50 (approx. 430 – 445 SEK)
- Strategy: Current level for starting a savings plan or investing the first tranche.
Zone 2 (First Dip / EMA 50 Support):
- Price range: €34.00 – €35.50 (approx. 390 – 410 SEK)
- Strategy: Healthy consolidation around the 50-day moving average. This presents an ideal buying zone for adding to your position.
Zone 3 (Bargain Hunter / EMA 200 Support):
- Price Range: €30.00 – €32.00 (approx. 345 – 365 SEK)
- Strategy: Strong long-term support around the 200-day moving average. An absolute bargain zone to significantly increase your position.
12. Future Viability
With over 100 years of success, deep roots in Scandinavian industry, and access to exclusive private equity deals through EQT, Investor AB is one of Europe’s most future-proof companies.
13. Potential Alternatives
Those looking for similar investment strategies will find them at $BRK.A (-0,51 %)
Berkshire Hathaway (U.S.), $DHR (-0,68 %)
Danaher (U.S.) or $MC (-1,41 %)
LVMH (France). However, none of them offers this specific focus on Northern Europe combined with such a historically low P/E ratio.
14. Profit Margin Report
- EBIT Margin:
82.1% - Net Income: 23.71 billion EUR in profit on 29.63 billion EUR in revenue.
- Capital Efficiency: Return on capital employed (ROCE) of 27.3% demonstrates excellent capital allocation by management.
15. RaketenToni’s Conclusion & Risk Disclosure
Investor AB $INVE A (-0,66 %) is the ultimate A-share stock!
If you don’t want to deal with the complexities of individual stock risks but still want to outperform the broader market, Investor AB gives you a Scandinavian super-ETF disguised as an individual stock to your portfolio. I’ve already done it!
A P/E ratio under 5, a 27% ROCE, and a 5-year performance that puts Berkshire Hathaway in the shade make this stock a must-have for any long-term wealth-building strategy.
An absolute top-tier compounder for the next 20 years!
As always, I’d love to hear your thoughts :)
Greetings from Denmark
Yours, Raketentoni
and, of course, everyone else :)
+ 2

3434
22 Comentarios
Tenbagger-Capital@Tenbagger-Capital
2Lun
•
44
•Ver todas las 8 respuestas adicionales

2Lun·
Hits & Misses
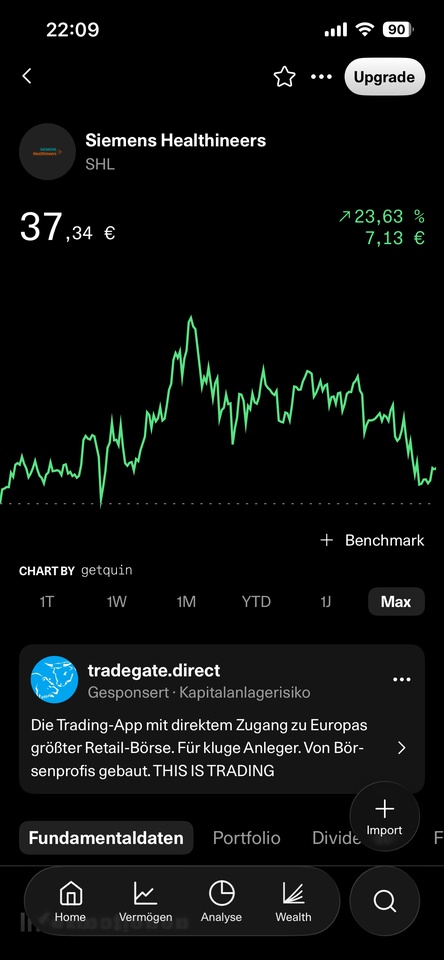
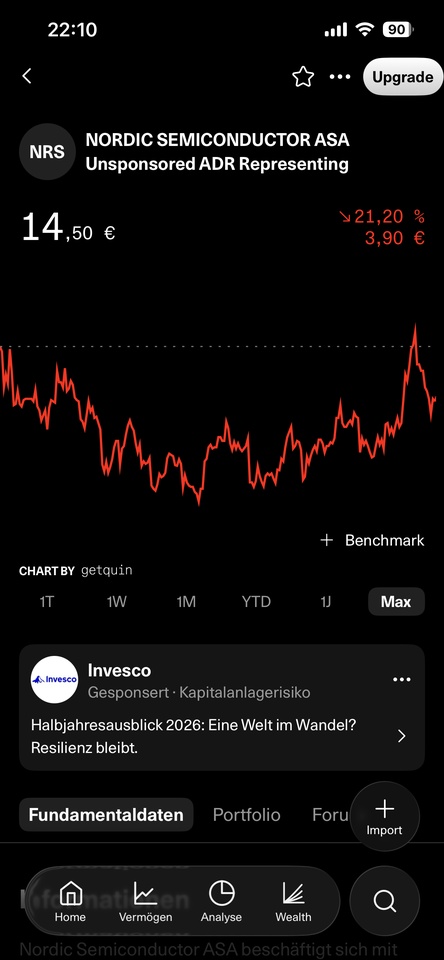
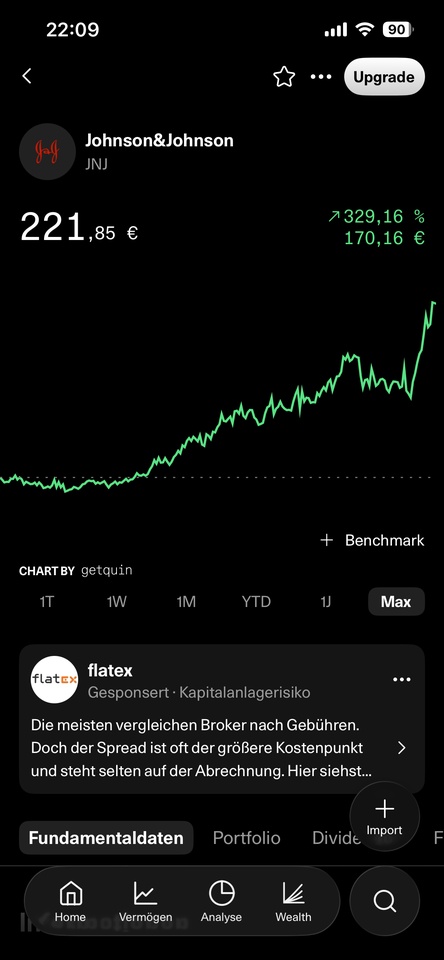
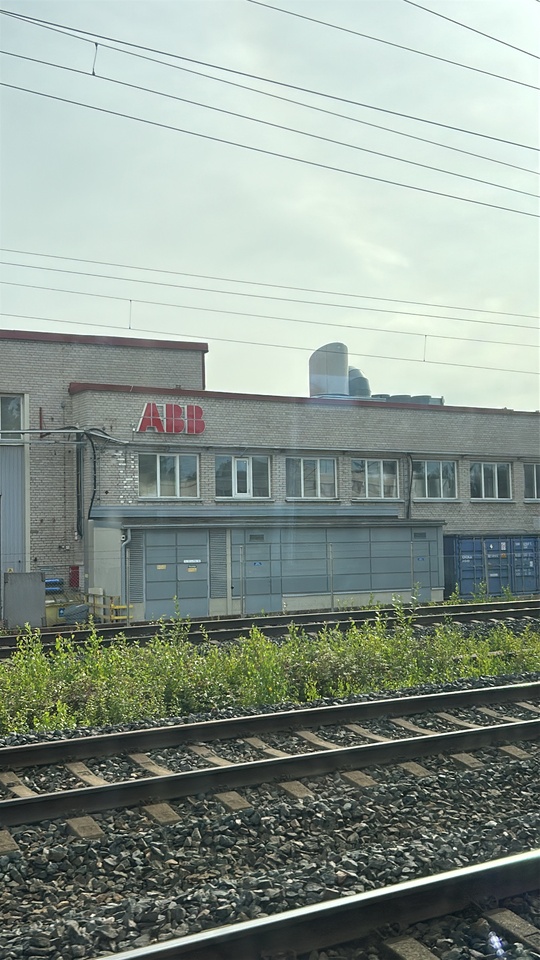
I'm on vacation again—this time in Helsinki—and, of course, I'm keeping an eye out for the companies I come across. One that really stood out was $ABBN (-1,59 %) . The factory buildings look a bit like Autoteile Unger. Hard to believe that these are—or will be—the AI robotics winners of the coming years. But it doesn’t have to look pretty; all that matters is the money being made. Congratulations to whoever got in early here.
$JNJ (-0,49 %) A classic
and
$RMD (-0,47 %) also worth considering
Not so great so far: Nordic Semi and $SHL (+0,06 %)
edit: of course, I $CELH forgot that one.
+ 5
1313

3Lun·
Analysis of AI Infrastructure Stocks 📈
- Global data center capacity
- Market for liquid cooling in data centers
- Cashing in on the AI gold rush
- "Old industry" as the winner
- ABB $ABBN (-1,59 %)
- Cisco $CSCO (+0,14 %)
- Hochtief $HOT (-0,28 %)
- Nokia $NOKIA (+2,19 %)
- Schneider Electric $SU (-1,85 %)
- Siemens $SIE (+0,43 %)
- Siemens Energy $ENR (+0,27 %)
22

3Lun·
AI Infrastructure: The Second Wave of the Boom
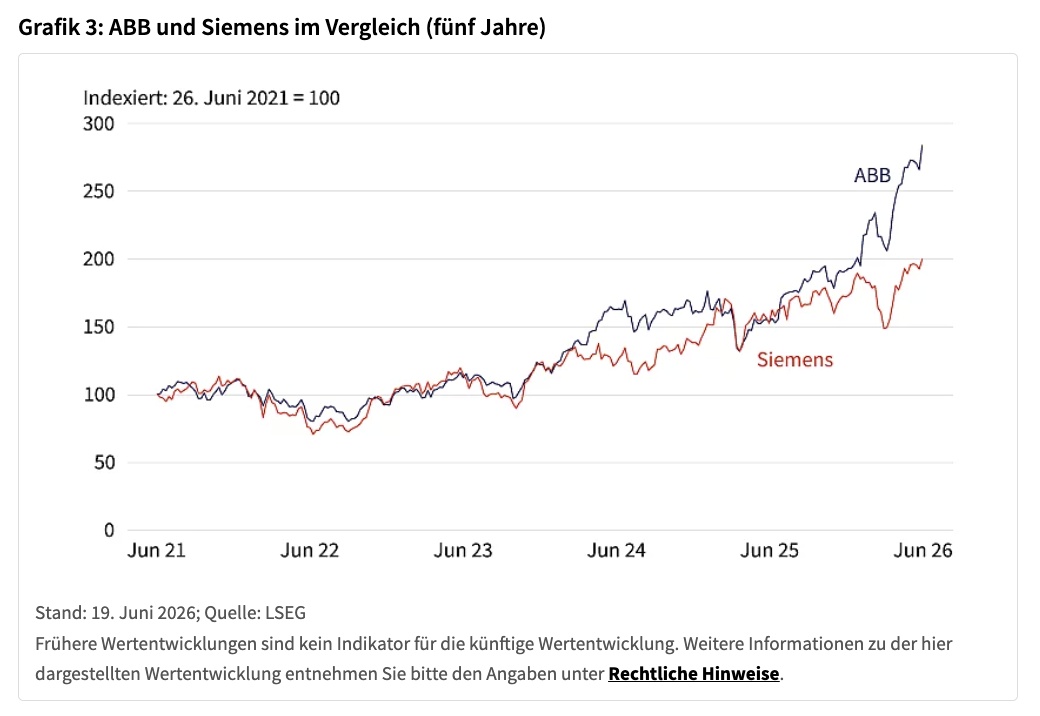
The AI boom is usually discussed in terms of chips and software, but the market that’s actually larger lies beneath: data centers, power grids, and cooling systems. According to Gartner, AI infrastructure is expected to grow to over 1.4 trillion U.S. dollars by 2026, accounting for a good 45% of all AI spending. McKinsey even estimates that up to 7 trillion U.S. dollars in investment will be needed by 2030.
And it’s not just the big-name tech companies that are benefiting from this.$ANET (+0,44 %) And $CSCO (+0,14 %) supply the high-performance networks, $VRT (+1,1 %) and the cooling technology for data centers. What’s particularly exciting is that “traditional industry” is also playing a major role.
$ABBN (-1,59 %) and $SIE (+0,43 %) are seeing double-digit growth in the data center business; $SiemensEnergy provides the power connection, and $HOT (-0,28 %) has more than doubled its data center orders within twelve months—result: promotion to the DAX.
Anyone looking for the AI story only among chip manufacturers is overlooking the more exciting part of the physical infrastructure behind it.
👉 The full analysis with all the numbers and charts is available in verlinkten Artikel.
#KI
#Rechenzentren
#Infrastruktur
#Marktausblick
This article is part of an advertising partnership with Société Générale
99
1 Comentario
3Lun
•
22
•
3Lun·
Euro AI Backbone - Portfolio Rebalancing in July 2026
Since the wikifolio was created on June 18, a review will not take place until the end of July.
The first rebalancing will take place at the start of the second half of the year.
- The weighting of the VAT Group $VACN (-2,52 %) will be reduced from 4.5% to 2.3%.
- The weighting of Nexans $NEX (-1,99 %) will be reduced from 1.6% to 0.3%.
- New addition Alfa Laval $ALFA (-0,61 %) at 1.7%.
- New addition: Atlas Copco $ATCO B (-0,77 %) at 1.7%.
_________________________
Background
Reduction of VAT Group / Addition of Atlas Copco:
One of the goals of the Euro AI Backbone is to cover as much of the value chain as possible. While the VAT Group manufactures vacuum valves, this is now complemented by the global market leader in vacuum pumps.
Reduction in Nexans:
In the cable/infrastructure sector, in addition to Nexans, Prysmian $PRY (-2,61 %) and NKT $NKT (+1,74 %) are also represented. Prysmian, with its large operational scale, and NKT, with its deep roots in European network expansion, already cover a large portion of this sector.
Addition of Alfa Laval:
In the automation and data center cooling sector, Alfa Laval is the global market leader in thermal heat transfer, separation technology, and fluid control. Alfa Laval complements Siemens $SIE (+0,43 %) , Schneider Electric’s $SU (-1,85 %) and ABB $ABBN (-1,59 %) , as well as RWE $RWE (-1,4 %) , Iberdrola $IBE (-0,23 %) and Enel $ENEL (-0,5 %) .
Hier geht es zum Euro AI Backbone-wikifolio
P.S.: Almost there! The wikifolio has already been bookmarked seven times—just three more to go before the certificate can take the next step toward “Investable” in a few days.
3Lun·
🏗️ Introduction: Euro AI Backbone Wikifolio ⚡⚙️
Dear Community,
To kick off the week, I’d like to introduce you to my “Pick-and-Shovel” wikifolio “Euro AI Backbone” (in German: Backbone). More detailed information will follow; for now, this is just a rough overview.
_________________________
Background
The market’s focus is primarily on the U.S., while Europe often plays a more subordinate role. Yet recent years in particular have made it clear just how dependent Europe is on other countries such as the U.S., Russia, and China.
By the time the “Orange Man” began his second term, it had become clear:
Europe must become more independent —not only in the field of defense but also in the field of AI.
For nearly five years, Goldman Sachs has maintained an index called “EU AI Capex,” which consists of 64 European stocks. This served as the blueprint for my wikifolio.
The wikifolio was launched on June 18, 2026. For the wikifolio to receive “Investable” status, it needs, among other things, 10 bookmarks. So I’d really appreciate it if you could click “Add to Watchlist” on the wikifolio—thanks in advance.
_________________________
The “Pick-and-Shovel” Approach
The wikifolio aims to cover as much of the value chain for operating modern artificial intelligence as possible.
The focus here is primarily on five areas:
- The Shovels: Semiconductors and machinery (e.g., lithography systems, wafer deposition, chip assembly)
- The Gas: Electricity and energy generation (e.g., wind power, hydroelectric power, solar power plants)
- Highways: Networks and cables (e.g., transformers, high-voltage undersea cables, power grid infrastructure, transmission lines)
- The brain: Automation and data center cooling (e.g., liquid cooling, power distribution cabinets, data networks, control systems)
- The Physical Foundation: Construction, emergency power, and security (e.g., construction of the facilities, emergency power generators, cybersecurity)
_________________________
Investment Universe
The portfolio includes European large-, mid-, and small-cap stocks.
Focus: Technology (semiconductor equipment), utilities (electricity, grids), and industrials (automation, specialty cables, data center construction, cybersecurity).
The Core: European market leaders with global monopolies and competitive moats.
The Tech Specialists: Profitable second-tier suppliers as yield boosters.
The foundation: Energy producers, grid operators, and construction specialists for stable cash flows and risk hedging.
Regular rebalancing, which typically takes place at the beginning of each month, prevents concentration risk. While the foundation remains unchanged, the weightings of individual securities may be adjusted. The replacement of individual stocks, the addition of new stocks, or the exclusion of individual stocks can also take place at the beginning of the month.
Initially, the portfolio consists of 37 stocks. There is no cash reserve.
The current allocation of holdings is as follows:
By sector:
- Industrial: 44%
- Utilities: 29%
- Technology: 26%
- Consumer Discretionary: 1%
By country:
- Germany: 24%
- United Kingdom: 14%
- Switzerland: 13%
- Netherlands: 12%
- France: 12%
- Spain: 10%
- Italy: 9%
- Denmark: 2%
- Finland: 2%
- Austria: 2%
Investments are made exclusively in European stocks. None ETFs, no investment certificates, no funds, no leveraged products.
_________________________
Initial Holdings
At the start, the portfolio comprises the following 37 securities, sorted by their current weighting:
Infineon $IFX (-0,39 %) , ASML Holding $ASML (+0,22 %) , Siemens $SIE (+0,43 %) , Enel $ENEL (-0,5 %) , Rolls-Royce $RR. (-5,56 %) , Schneider Electric $SU (-1,85 %) , Iberdrola $IBE (-0,23 %) , ABB $ABBN (-1,59 %) , VAT Group $VACN (-2,52 %) , Siemens Energy $ENR (+0,27 %) , Prysmian $PRY (-2,61 %) , ASM International $ASM (-1,71 %) , BE Semiconductor Industries $BESI (-4,86 %) , STMicroelectronics $STM (-0,26 %) , RWE $RWE (-1,4 %) , E.ON $EOAN (+0,58 %) , Legrand $LR (-0,12 %) , National Grid $NG. (-0,46 %) , Nokia $NOKIA (+2,19 %) , SSE $SSE (-0,49 %) , EDP Renovaveis $EDPR (+0,08 %) , Hochtief $HOT (-0,28 %) , Red Eléctrica de España $RED (-1,04 %) , Nexans $NEX (-1,99 %) , United Utilities $UUGRY (+0,56 %) , Enagas $ENG (-0,49 %) , Centric $CENTR (-1,98 %) , Spirax-Sarco Engineering $SPX (+0,29 %) , Soitex $SOI (-0,55 %) , Geberit $GEBN (+0,81 %) , Aixtron $AIXA (-1,24 %) , Orsted $ORSTED (+1,34 %) , Verbund $VER (+1,58 %) , SAFRAN $SAF (-8,86 %) , Thales $THALES (+0,57 %) , NKT $NKT (+1,74 %) , Andritz $ANDR (-1,67 %)
_________________________
Holding Period
Since infrastructure development is likely to continue for several more years, the holding period is clearly geared toward the long term. Short-term trading is avoided.
_________________________
Sources of Information
The following sources of information are primarily used to identify stocks:
Companies’ quarterly reports and financial statements.
Analyst reports and industry studies from global investment banks.
Business media and financial publications.
_________________________
I’m curious to see how the portfolio will perform over the long term. Monthly updates will keep you informed.
www.wikifolio.comEuro AI Backbone
55
2 Comentarios
I'm not going to invest, but I'll keep it in mind :)
•
11
•3Lun·
🏗️ Introduction: Euro AI Backbone Wikifolio ⚡⚙️
Dear Community,
To kick off the week, I’d like to introduce you to my “Pick-and-Shovel” wikifolio “Euro AI Backbone” (in German: Backbone). More detailed information will follow; for now, this is just a rough overview.
_________________________
Background
The market’s focus is primarily on the U.S., while Europe often plays a more subordinate role. Yet recent years in particular have made it clear just how dependent Europe is on other countries such as the U.S., Russia, and China.
By the time the “Orange Man” began his second term, it had become clear:
Europe must become more independent —not only in the field of defense but also in the field of AI.
For nearly five years, Goldman Sachs has maintained an index called “EU AI Capex,” which consists of 64 European stocks. This served as the blueprint for my wikifolio.
The wikifolio was launched on June 18, 2026. For the wikifolio to receive “Investable” status, it needs, among other things, 10 bookmarks. So I’d really appreciate it if you could click “Add to Watchlist” on the wikifolio—thanks in advance.
_________________________
The “Pick-and-Shovel” Approach
The wikifolio aims to cover as much of the value chain for operating modern artificial intelligence as possible.
The focus here is primarily on five areas:
- The Shovels: Semiconductors and machinery (e.g., lithography systems, wafer deposition, chip assembly)
- The Gas: Electricity and energy generation (e.g., wind power, hydroelectric power, solar power plants)
- Highways: Networks and cables (e.g., transformers, high-voltage undersea cables, power grid infrastructure, transmission lines)
- The brain: Automation and data center cooling (e.g., liquid cooling, power distribution cabinets, data networks, control systems)
- The Physical Foundation: Construction, emergency power, and security (e.g., construction of the facilities, emergency power generators, cybersecurity)
_________________________
Investment Universe
The portfolio includes European large-, mid-, and small-cap stocks.
Focus: Technology (semiconductor equipment), utilities (electricity, grids), and industrials (automation, specialty cables, data center construction, cybersecurity).
The Core: European market leaders with global monopolies and competitive moats.
The Tech Specialists: Profitable second-tier suppliers as yield boosters.
The foundation: Energy producers, grid operators, and construction specialists for stable cash flows and risk hedging.
Regular rebalancing, which typically takes place at the beginning of each month, prevents concentration risk. While the foundation remains unchanged, the weightings of individual securities may be adjusted. The replacement of individual stocks, the addition of new stocks, or the exclusion of individual stocks can also take place at the beginning of the month.
Initially, the portfolio consists of 37 stocks. There is no cash reserve.
The current allocation of holdings is as follows:
By sector:
- Industrial: 44%
- Utilities: 29%
- Technology: 26%
- Consumer Discretionary: 1%
By country:
- Germany: 24%
- United Kingdom: 14%
- Switzerland: 13%
- Netherlands: 12%
- France: 12%
- Spain: 10%
- Italy: 9%
- Denmark: 2%
- Finland: 2%
- Austria: 2%
Investments are made exclusively in European stocks. None ETFs, no investment certificates, no funds, no leveraged products.
_________________________
Initial Holdings
At the start, the portfolio comprises the following 37 securities, sorted by their current weighting:
Infineon $IFX (-0,39 %) , ASML Holding $ASML (+0,22 %) , Siemens $SIE (+0,43 %) , Enel $ENEL (-0,5 %) , Rolls-Royce $RR. (-5,56 %) , Schneider Electric $SU (-1,85 %) , Iberdrola $IBE (-0,23 %) , ABB $ABBN (-1,59 %) , VAT Group $VACN (-2,52 %) , Siemens Energy $ENR (+0,27 %) , Prysmian $PRY (-2,61 %) , ASM International $ASM (-1,71 %) , BE Semiconductor Industries $BESI (-4,86 %) , STMicroelectronics $STM (-0,26 %) , RWE $RWE (-1,4 %) , E.ON $EOAN (+0,58 %) , Legrand $LR (-0,12 %) , National Grid $NG. (-0,46 %) , Nokia $NOKIA (+2,19 %) , SSE $SSE (-0,49 %) , EDP Renovaveis $EDPR (+0,08 %) , Hochtief $HOT (-0,28 %) , Red Eléctrica de España $RED (-1,04 %) , Nexans $NEX (-1,99 %) , United Utilities $UUGRY (+0,56 %) , Enagas $ENG (-0,49 %) , Centric $CENTR (-1,98 %) , Spirax-Sarco Engineering $SPX (+0,29 %) , Soitex $SOI (-0,55 %) , Geberit $GEBN (+0,81 %) , Aixtron $AIXA (-1,24 %) , Orsted $ORSTED (+1,34 %) , Verbund $VER (+1,58 %) , SAFRAN $SAF (-8,86 %) , Thales $THALES (+0,57 %) , NKT $NKT (+1,74 %) , Andritz $ANDR (-1,67 %)
_________________________
Holding Period
Since infrastructure development is likely to continue for several more years, the holding period is clearly geared toward the long term. Short-term trading is avoided.
_________________________
Sources of Information
The following sources of information are primarily used to identify stocks:
Companies’ quarterly reports and financial statements.
Analyst reports and industry studies from global investment banks.
Business media and financial publications.
_________________________
I’m curious to see how the portfolio will perform over the long term. Monthly updates will keep you informed.
www.wikifolio.comEuro AI Backbone
99
7 Comentarios
3Lun
Good luck, Mikey—I'm curious to see how the EU AI Wiki does. Just a quick side note... The Wikifolio won't be "investable" until it has successfully gone through the issuance process ;-) But it'll all work out :-)
•
44
•4Lun·
🏗️🔋Euro AI Backbone - My Bet on Europe's AI Backbone 🎲
Dear Community,
Throughout last year, I found myself repeatedly wanting to focus on the European market as well. But the same old arguments kept dissuading me: The European market doesn’t deliver; Europe doesn’t meet my desire for a growth-oriented, high-yield portfolio, etc.
I also asked myself: Which sectors and industries do I want to cover? Where do I see enough potential to justify taking the risk? To what extent do I want to align my portfolio with this strategy?
In today’s episode, Alles auf Aktien: Fiese Gewinnwarnung bei BMW und Europas KI-Unabhängigkeitsaktien , something caught my attention:
A basket from Goldman Sachs, consisting of 64 European stocks, with the wonderful name: EU AI Capex.
Performance over the past five years: 17.5 percent annualized, including dividends.
_________________________
And which industries are covered?
- Semiconductors
- Machinery
- Electricity
- Networks
- Cables
- Energy
- Automation
Unfortunately, existing ETFs such as the iShares STOXX Europe 600 Utilities UCITS ETF or the iShares STOXX Europe 600 Technology UCITS ETF do not cover all of these sectors.
"Sounds exactly like what I was looking for," I thought to myself, and used my day off today to create an index tailored to my preferences.
Goldman Sachs has listed 12 of the 64 holdings, including their percentage allocations. The remaining 52 holdings appear to be known only to institutional investors, as the index isn’t publicly available.
So I created my own “Pie” through Trading 212. More specifically, a “Pie” is a personalized investment portfolio in which I can invest in multiple stocks and ETFs according to a percentage allocation I set myself and save toward them simultaneously via a single automated savings plan—with no expense ratio and no order fees.
It would go beyond the scope of this post to write about every individual security, which is why I chose this particular one. I didn’t make these decisions entirely on my own. Gemini helped me with this. In the end, we settled on 37 securities.
_________________________
On Selecting the Holdings
Together, we gradually added European market leaders across the entire value chain. We always kept an eye on the sectors—none should be left out.
_________________________
On the Percentage Allocation
It’s important to note upfront that the “pie” will be funded with 150 euros per month going forward. Since the minimum investment amount at Trading 212 is one euro, the smallest weighting in the “pie” must be at least 0.7%:
1.00 euro / 0.70% = 142.85 euro
The percentage allocation was then based on pricing power and global scalability.
More details on this may follow in a later post.
_________________________
About the Stocks
From EU AI Cortex Basket taken over by Goldman Sachs:
- Infineon ($IFX (-0,39 %)): 7.10%
- ASML ($ASML (+0,22 %)): 6.80%
- Siemens ($SIE (+0,43 %)): 6.00%
- Rolls-Royce ($RR. (-5,56 %)): 5.40%
- Enel ($ENEL (-0,5 %)): 5.40%
- Schneider Electric ($SU (-1,85 %)): 5.40%
- ABB ($ABBN (-1,59 %)): 5.00%
- Iberdrola ($IBE (-0,23 %)): 4.90%
- Siemens Energy ($ENR (+0,27 %)): 4.70%
- ASM International ($ASM (-1,71 %)): 3.70%
- Prysmian ($PRY (-2,61 %)): 3.60%
- BE Semiconductor ($BESI (-4,86 %)): 3.20%
Supplemented by the following stocks:
- VAT Group ($VACN (-2,52 %)): 4.50%
- STMicroelectronics ($STM (-0,26 %)): 2.50%
- Legrand ($LR (-0,12 %)): 2.00%
- RWE ($RWE (-1,4 %)): 1.95%
- Nokia ($NOKIA (+2,19 %)): 1.90%
- E.ON ($EOAN (+0,58 %)): 1.90%
- National Grid ($NG. (-0,46 %)): 1.80%
- SSE plc ($SSE (-0,49 %)): 1.70%
- EDP Renováveis ($EDPR (+0,08 %)): 1.60%
- Red Eléctrica ($RDEIY (-0,68 %)): 1.50%
- Nexans ($NEX (-1,99 %)): 1.50%
- Hochtief ($HOT (-0,28 %)): 1.50%
- Enagás ($ENG (-0,49 %)): 1.40%
- United Utilities ($UU. (-0,17 %)): 1.40%
- Spirax-Sarco ($SPX (+0,29 %)): 1.30%
- Centrica ($CNA (+1,1 %)): 1.30%
- Aixtron ($AIXA (-1,24 %)): 1.30%
- Orsted ($ORSTED (+1,34 %)): 1.15%
- Verbund AG ($VER (+1,58 %)): 1.10%
- Soitec ($SOI (-0,55 %)): 1.10%
- Safran ($SAF (-8,86 %)): 1.00%
- Thales ($HO (+0,2 %)): 1.00%
- Geberit ($GEBN (+0,81 %)): 0.90%
- NKT A/S ($NKT (+1,74 %)): 0.80%
- Andritz ($ANDR (-1,67 %)): 0.70%
The figures $IG (+0,29 %) , $SRG (+0,17 %) , $TRN (-0,89 %) , $ALFA (-0,61 %) , $ATCO B (-0,77 %) or $AEMMY can unfortunately only be traded via CFDs on Trading 212. Therefore, these securities could not be included.
_________________________
Trading 212 Pie
The Pie now accounts for about 10% of my portfolio, and I’ll be contributing 150 euros to it each month going forward.
I am convinced that Europe will succeed in becoming more independent. However, in my opinion, a self-sufficient Europe without any dependence whatsoever is simply not possible (keyword: globalization).
_________________________
Pie Composition
By country:
- Germany: 24.35%
- France: 15.4%
- Netherlands: 13.7%
- United Kingdom: 12.9%
- Switzerland: 10.4%
- Italy: 9%
- Spain: 7.8%
- Denmark: 1.95%
- Austria: 1.8%
- Portugal: 1.6%
By sector:
- Technology: 32.3%
- Industrial & Capital Goods: 31.5%
- Utilities & Energy Infrastructure: 36.2%
By industry:
- Semiconductors & Data Center Chips: 27.8%
- Energy Equipment & Grid Technology: 25.5%
- Electricity Generators: 16.1%
- Physical Networks & Storage: 10.1%
- Cable Infrastructure: 5.9%
- Vacuum Technology & Components: 6.5%
- Network Technology & Connectivity: 1.9%
- Data Centers & Industrial Construction: 3.1%
- Cyber and Perimeter Security: 3.1%
_________________________
I’m curious to see how the pie chart will develop.
P.S.: You can find the pie chart on Trading 212 under the name Euro AI Backbone GS to copy.
1515
2 Comentarios
I'm investing in the $IEFM. While it doesn't cover the sectors you mentioned, it focuses on the top performers from the past 6–12 months.
•
11
•
4Lun·
European AI “Independence”
According to Ifo President Clemens Fuest, Europe faces an “existential threat”: Europe uses AI but has virtually no infrastructure. About 75 percent of the world’s high-performance computing capacity for modern AI is located in the U.S., with China accounting for about 15 percent and the EU for less than five percent.
He is therefore calling for an emergency program that includes more data centers, chip factories, energy infrastructure, faster approvals, and, if necessary, special economic zones. Energy is becoming a strategic issue, as AI data centers require enormous amounts of reliable electricity.
A study by the American investment bank Goldman Sachs titled “The Post-Modern Cycle” describes a new investment supercycle: AI, data centers, electricity, chips, defense, and infrastructure. The digital world suddenly needs concrete, cables, transformers, and power plants.
Goldman has created a corresponding portfolio called EU AI Capex.
It comprises 64 components. It is Europe’s publicly traded bet on AI infrastructure. Over the past five years, the index has gained 124 percent including dividends, which translates to an annualized return of 17.5 percent. The Stoxx Europe 600 has only managed 64 percent over the same period—an annualized rate of 10.3 percent.
The largest holdings show what this is all about: Infineon
$IFX (-0,39 %) has a weighting of 7.1 percent, ASML
$ASML (+0,22 %) stands at 6.8 percent, Siemens $SIE (+0,43 %) accounts for 6 percent, Rolls-Royce $RR. (-5,56 %) , Enel $ENEL (-0,5 %) and Schneider Electric
$SU (-1,85 %) at 5.4 percent. ABB $ABBN (-1,59 %) has a weighting of five percent, Iberdrola
$IBE (-0,23 %) at 4.9 percent, Siemens Energy
$ENR (+0,27 %) at 4.7 percent, ASM International
$ASM (-1,71 %) at 3.7 percent, Prysmian $PRY (-2,61 %) at 3.6 percent, and BE Semiconductor
$BESI (-4,86 %) at 3.2 percent.
This means the index is not purely a tech index, but rather reflects Europe’s physical AI value chain: semiconductors, machinery, electricity, networks, cables, energy, and automation. ASML is Europe’s strategic crown jewel. Fuest even says that ASML is so far Europe’s only truly strategic asset in this sector, because the U.S. also depends on it.
The risk: Europe talks, but doesn’t build. Energy remains expensive, permits take a long time, regulation slows down projects—and in the end, we remain customers of American models.
The opportunity: Europe is waking up. Then digital sovereignty will trigger a capex boom, and stocks will get a new boost. Anyone who wants European AI must definitely buy European infrastructure.
Source: “Welt” (excerpt), June 17, 2026
99
3 Comentarios
True words—you see this problem everywhere. Here where I live in 🇩🇰, they’re planning to build a data center. It’ll create 600 jobs, and it’s far away from any residential areas—about 10 km. But once again, there are people organizing protests against it. I’m glad to live in a country governed by the rule of law, but there are our problems again… everyone wants it, but no one wants it on their own doorstep. Right now, the project is on hold again 🙄
•
33
•6Lun·
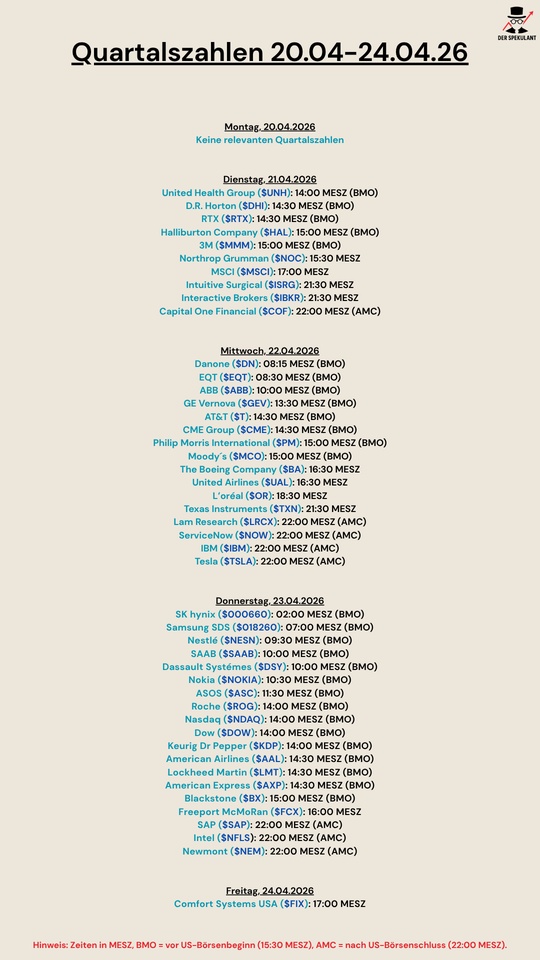
Quarterly figures 20.04-24.04.26
$UNH (-0,4 %)
$DHI (-0,57 %)
$RTX (-0,1 %)
$HAL (+0,41 %)
$MMM (-0,42 %)
$NOC (-0,58 %)
$MSCI (-0,13 %)
$IBKR (+0,93 %)
$ISRG (-0,35 %)
$COF (+0,18 %)
$BN (-0,32 %)
$EQT (+0,25 %)
$ABBN (-1,59 %)
$GEV (+0,99 %)
$T (-3,98 %)
$CME (+0,26 %)
$PM (+0,14 %)
$MCO (-0,34 %)
$BA (-0,18 %)
$UAL (-0,33 %)
$OR (+1,19 %)
$TXN (+0,09 %)
$LRCX (+1,92 %)
$NOW (-0,32 %)
$IBM (-0,19 %)
$TSLA (+0,71 %)
$000660
$018260
$NESN (-1,31 %)
$SAAB B (+1,71 %)
$DSY (+0,48 %)
$NOKIA (+2,19 %)
$ASC (-2,18 %)
$ROG
$NDAQ (-0,49 %)
$DOW (+0,96 %)
$KDP (-0,05 %)
$AAL (+1,89 %)
$LMT (-0,29 %)
$AXP (-1,41 %)
$BX (-0,99 %)
$FCX (+0,47 %)
$SAP (-0,79 %)
$INTC (+1,79 %)
$NEM (-1,96 %)
$FIX (+6,66 %)
1212