💶 Amundi: Europe's financial architect - Does he build the most solid assets? 🏗️
Company profile
$AMUN (-0,62%) is one of Europe's leading asset managers and is headquartered in Paris. The company was formed in 2010 from the merger of the asset management segments of $ACA (-0,85%) and $GLE (-5,26%) and has been listed on the stock exchange since 2015. With assets under management of EUR 1.98 trillion (as at June 2024), Amundi is one of the world's largest players in asset management.
Historical development and business model
Since its foundation, Amundi has enjoyed continuous growth and offers a wide range of investment solutions for institutional and private investors. The portfolio ranges from actively and passively managed funds to ETFs and customized mandates. A particular focus is on the management of liquidity reserves and the development of specialized investment strategies for companies.
Core competencies and future prospects
Amundi's success is based on several core competencies:
- In-depth expertise across all asset classes and markets
- Leading position in European money market management
- Pioneering role in technological innovation, in particular through the ALTO investment platform
- Low-cost ETFs for investors
Looking to the future, the company is focusing on further growth, particularly in the areas of ETFs and sustainable investments.
Strategic initiatives
Amundi pursues various strategic initiatives to achieve its objectives:
- Increased expansion of the ETF business, with the aim of becoming the market leader in Europe
- Focus on sustainable investment strategies and the integration of ESG criteria
- Expansion into emerging markets, particularly in Asia
- Further development of digital platforms, such as the ALTO technology
Market position and competition
Amundi is the largest asset manager in Europe and among the top 10 worldwide. Its main competitors include global asset management giants such as BlackRock, Vanguard and Fidelity. In the European ETF market, Amundi ranks behind iShares ($BLK (+1,46%) ) and Xtrackers ($DWS (-1,58%) ).
Market potential
The global asset management market is growing steadily, particularly in the ETF and sustainable investment segments. Amundi is well positioned to benefit from these growth trends and further expand its market position.
Share performance
Since the IPO in 2015, the Amundi share has achieved a TR of 127%, 27% more than DWS in the same period.
Performance
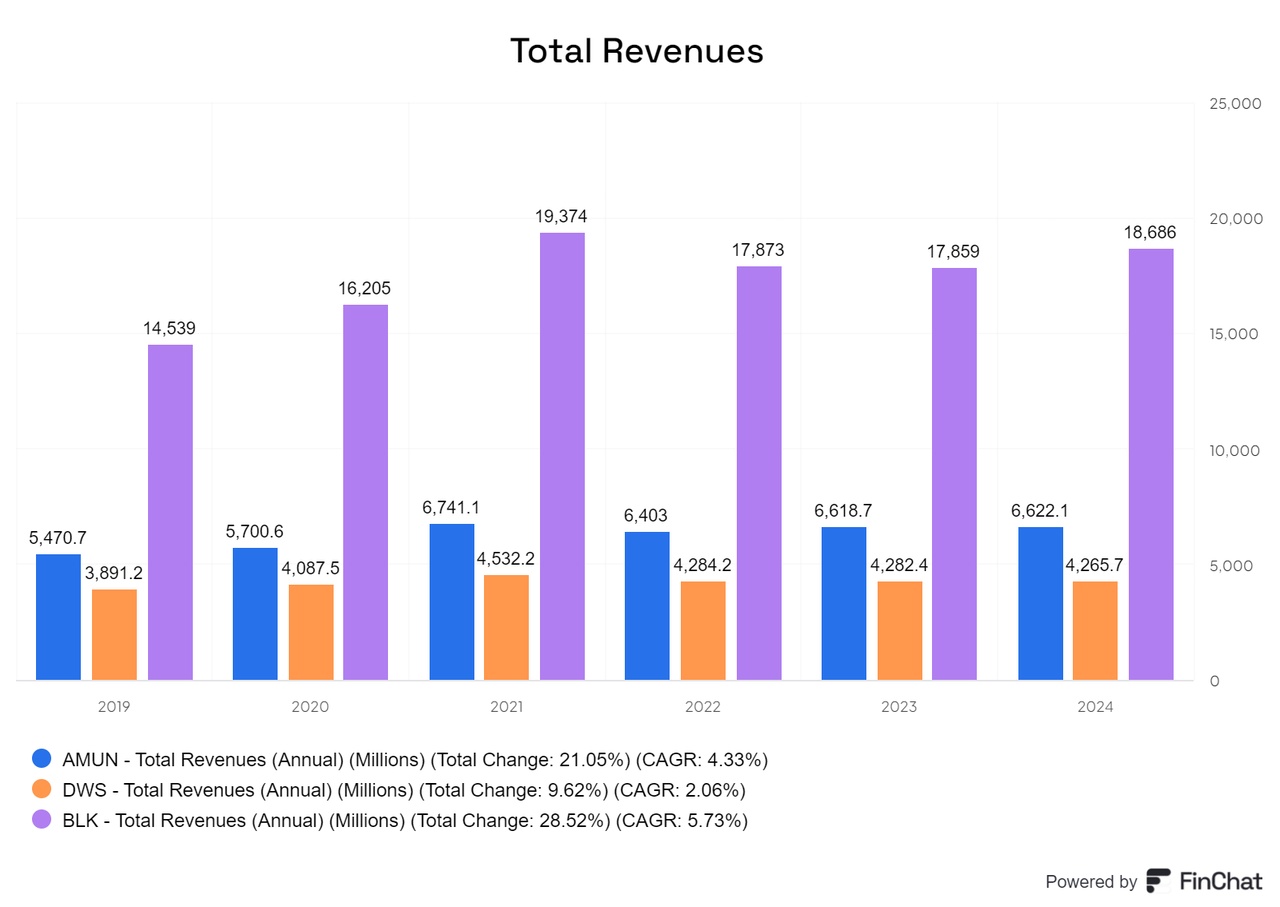
In terms of turnover, Amundi is significantly smaller than BlackRock, but larger than the German company DWS. BlackRock also has numerous other sources of income, such as from financial technology.
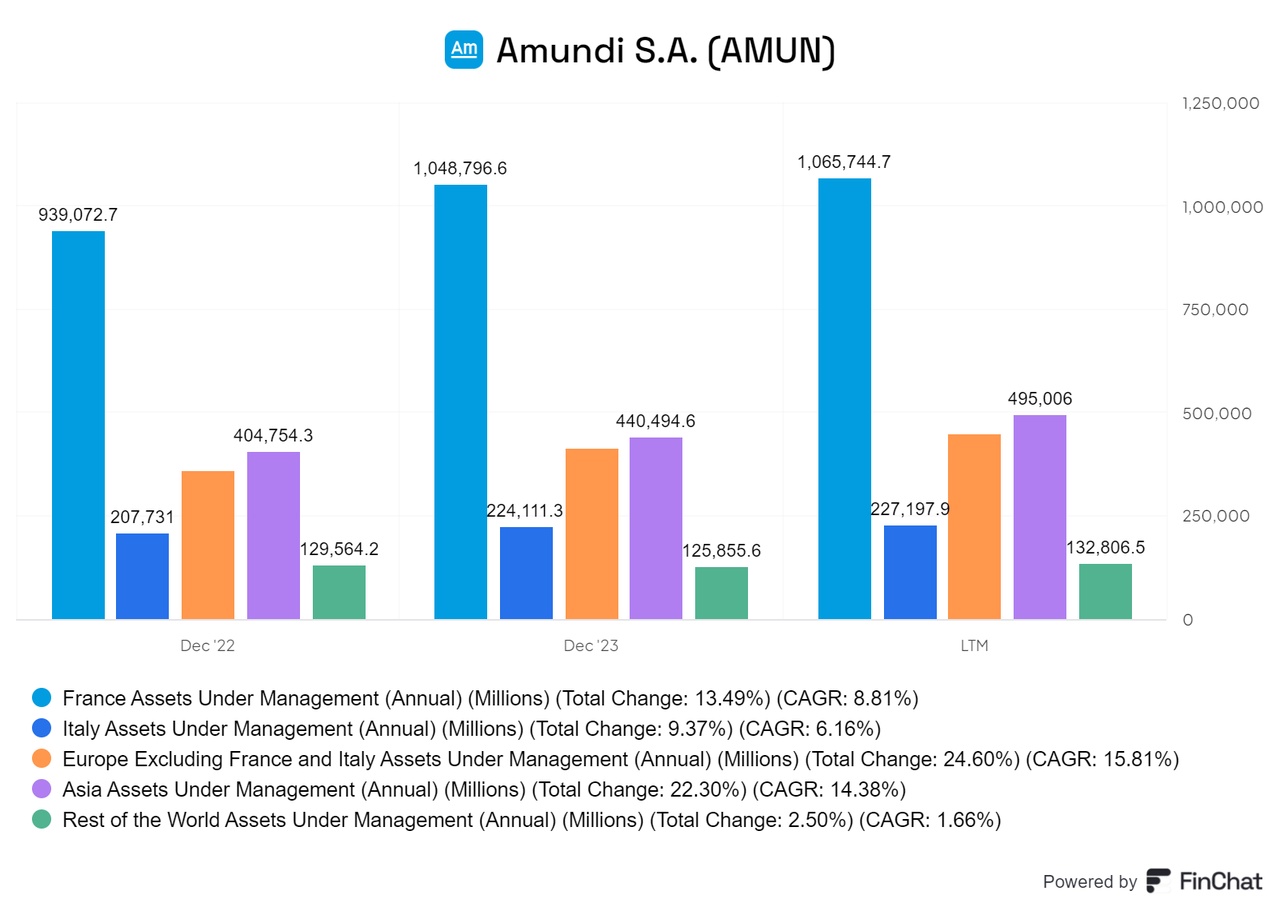
Looking at the assets under management (AUM), the dependence on Europe and Asia becomes clear, which at the same time underlines Amundi's strong positioning there. In contrast, Amundi's presence in the USA is small and its exposure in other regions is also limited. Amundi is therefore primarily a bet on Europe and Asia - two markets that still have relatively little capital in the asset management sector, but are showing an upward trend. There is also growing pressure to move towards more sustainable financial solutions, which positions Amundi well in these regions.
Amundi leads in sales growth and is expected to continue to benefit from the European trend as long as BlackRock does not introduce cheaper and even more offerings.
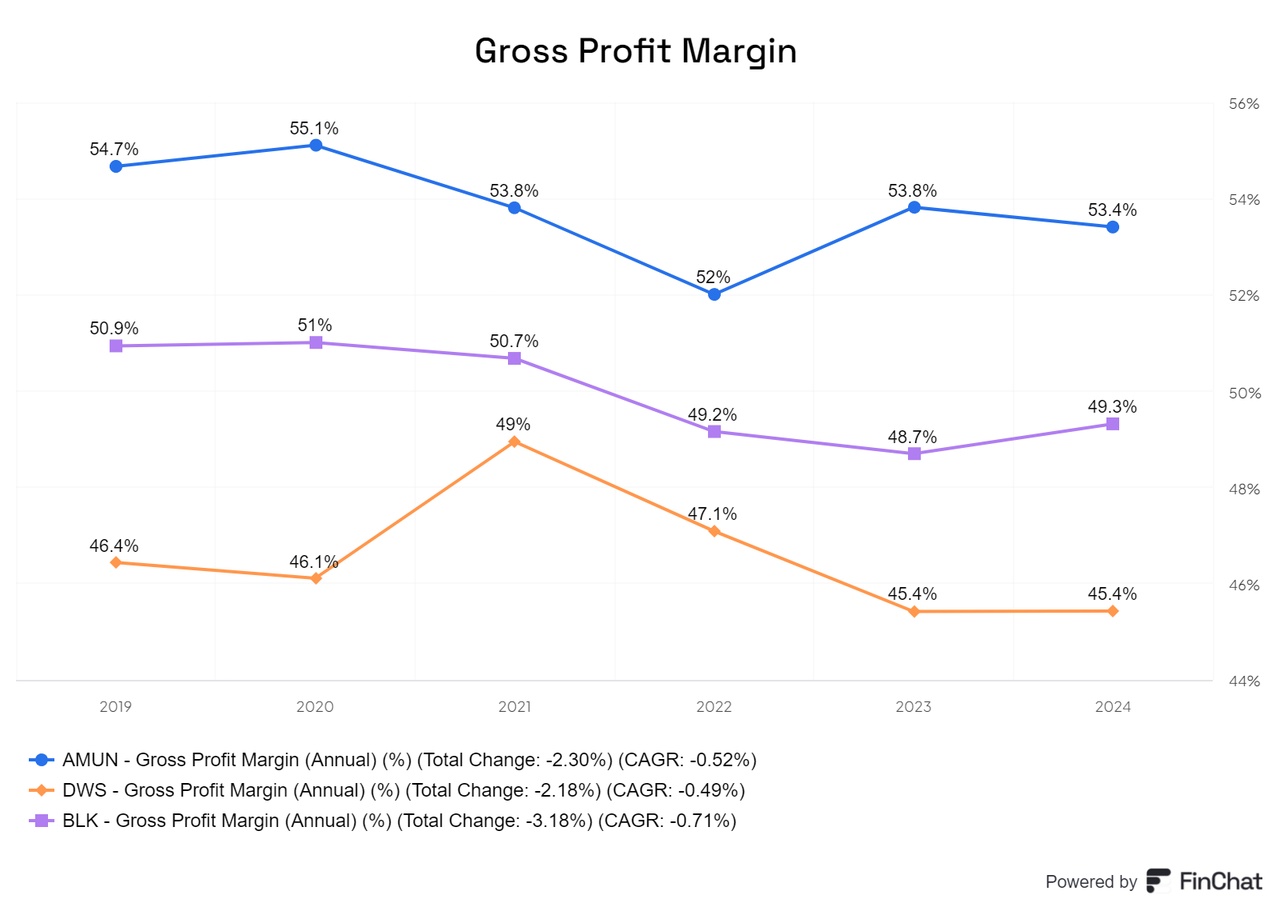
Amundi is also ahead in terms of gross profit margin.
However, its net profit margin is well behind BlackRock's, partly due to BlackRock's product mix.
In terms of earnings per share (EPS), BlackRock leads by a wide margin and was able to increase this significantly with an annual growth rate of almost 8%.
Free cash flow (FCF) is currently positive at all three companies. Amundi, on the other hand, was briefly negative in some cases, while State Street is a special case anyway.
The share-based remuneration essentially only affects BlackRock.
However, BlackRock buys back more shares and is therefore net negative. Amundi has also made purchases from time to time.
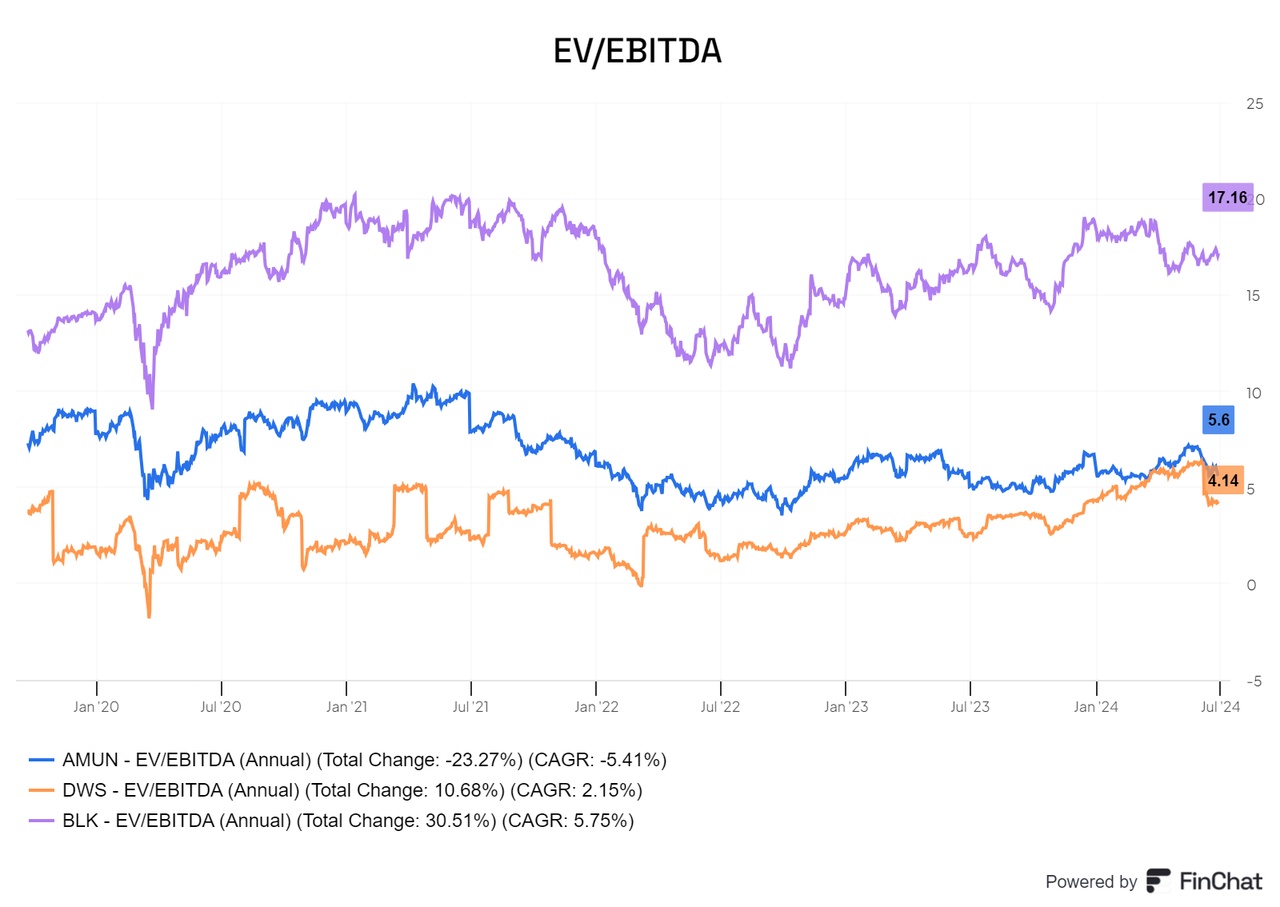
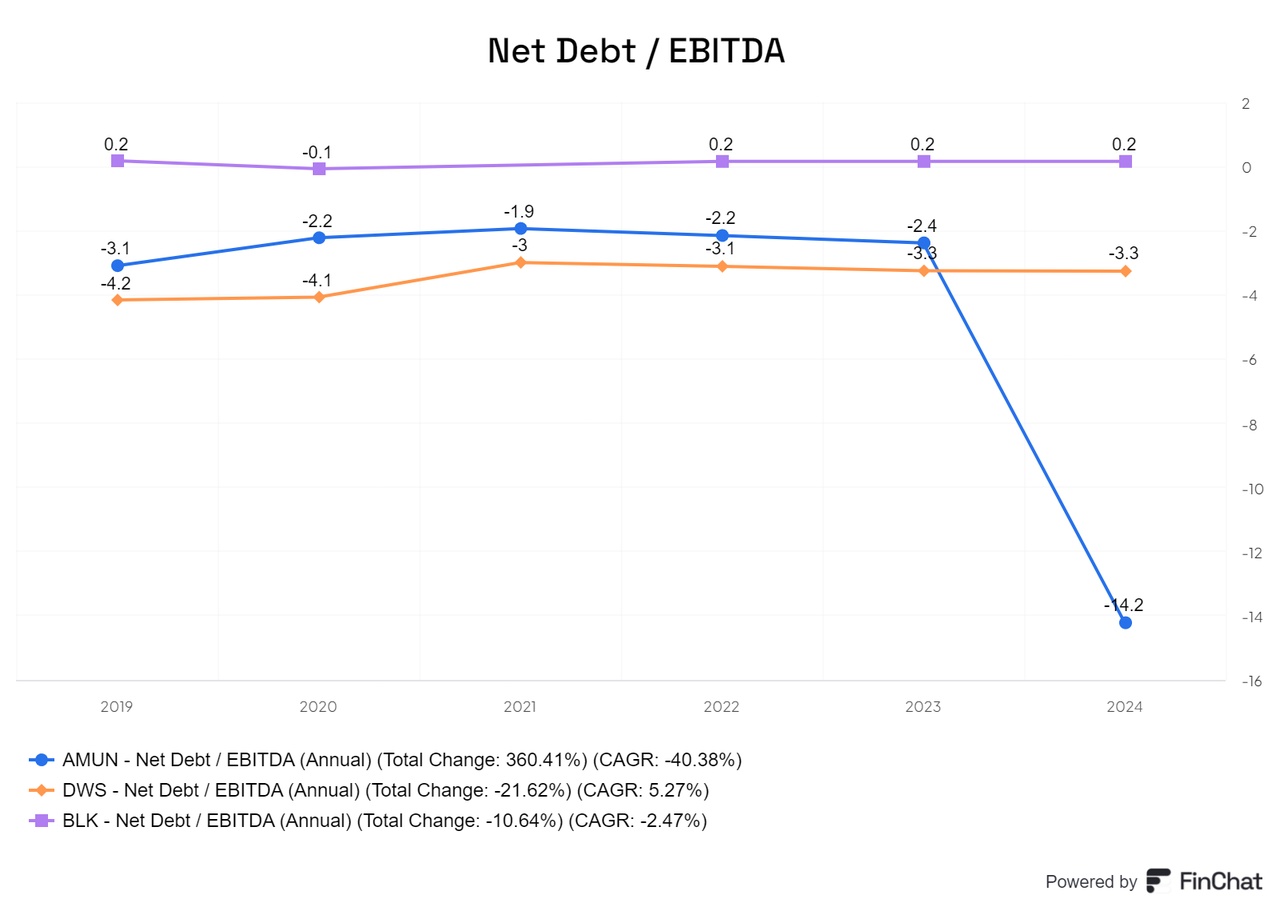
All companies are very well positioned in terms of the ratio of net debt to EBITDA.
Part 2:https://getqu.in/aiK2Y3/


