Turnaround for the Dutch problem children $RDC (+1,94%) and $WKL (+6,71%) or just a temporary rebellion? What do you think?

Redcare Pharmacy
Price
Discussione su RDC
Messaggi
70Speckulative opportunity for
a technical long reaction at $RDC (+1,94%) ? The stock has been in a downtrend for some time and keeps forming new 52-week lows. Furthermore, it is sold quite short.
But in my opinion, the last price setbacks were exaggerated due to seasonal sales declines in August and it could be time for at least a leveraged counter-reaction. After all, the best months of the fall and winter are now approaching with many colds
What do you think about this @TomTurboInvest ? Do you see opportunities or more risks?
Redcare Pharmacy: What's going on here again?
$RDC (+1,94%) does anyone have any news about today's or the recent crash?
Redcare Pharmacy
Hello everyone,
here is an overview of the latest developments at Redcare Pharmacy $RDC (+1,94%) formerly known as Shop Apotheke Europe.
📈 Key financial figures (as of Q2 2025)
- Turnover (TTM): USD 1.33 billion
- EBIT (TTM): USD -74.83 million
- Adjusted EBITDA margin (Q2): 2.6%
- Sales growth (Q2 YoY): +26,5 %
- Current share price: approx. EUR 102.70
🔍 Analysis
Strengths:
- Strong sales growth: In the second quarter of 2025, Redcare Pharmacy achieved impressive sales growth of 26.5% year-on-year.
- Adjusted EBITDA margin: Adjusted EBITDA margin increased to 2.6%, the highest level in the last 12 months
- Expansion into international markets: The International segment (Belgium, the Netherlands, France and Italy) grew by 26.2 % to EUR 135 million in the first quarter of 2025.
Challenges:
- Unprofitability: Despite sales growth, the company remains negative in terms of EBIT.
- Regulatory uncertainties: The pharmacy market is highly regulated, particularly in Europe, which poses potential risks.
- Competitive pressure: The online pharmacy market is highly competitive, which can lead to pressure on margins.()
📌 Conclusion
Redcare Pharmacy shows solid growth figures and a positive development in international markets. The rising EBITDA margin indicates progress in profitability. However, the company is still in negative territory in terms of EBIT, which could continue to make investors cautious.
What do you think about the current development of Redcare Pharmacy? Do you see potential for sustainable profitability? $RDC (+1,94%)
I look forward to your opinions!
*REDCARE PREV. -1.4% - PHARMACIST BOSS: E-PRESCRIPTION MORE UNRELIABLE THAN DEUTSCHE BAHN
Trading Part4 - Deepdive indicators 📈📉☕
As always, first the link to the first post, where you will also find the links to all the other parts https://getqu.in/cbIOkg/
Today there are a few more details on the indicators from part 3 https://getqu.in/9XGYtO/
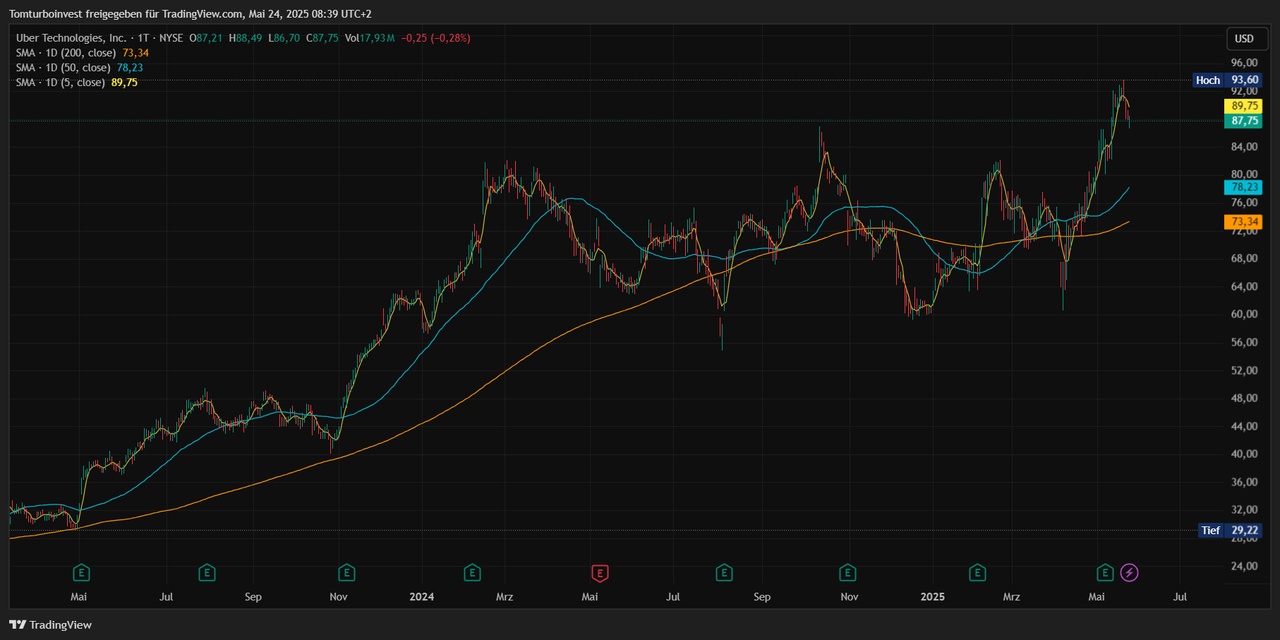
As described in part 3, I start my analysis with the SMA 200 / 50 / 5 daysto get an overview of the trend.
Example $UBER (+1,15%)
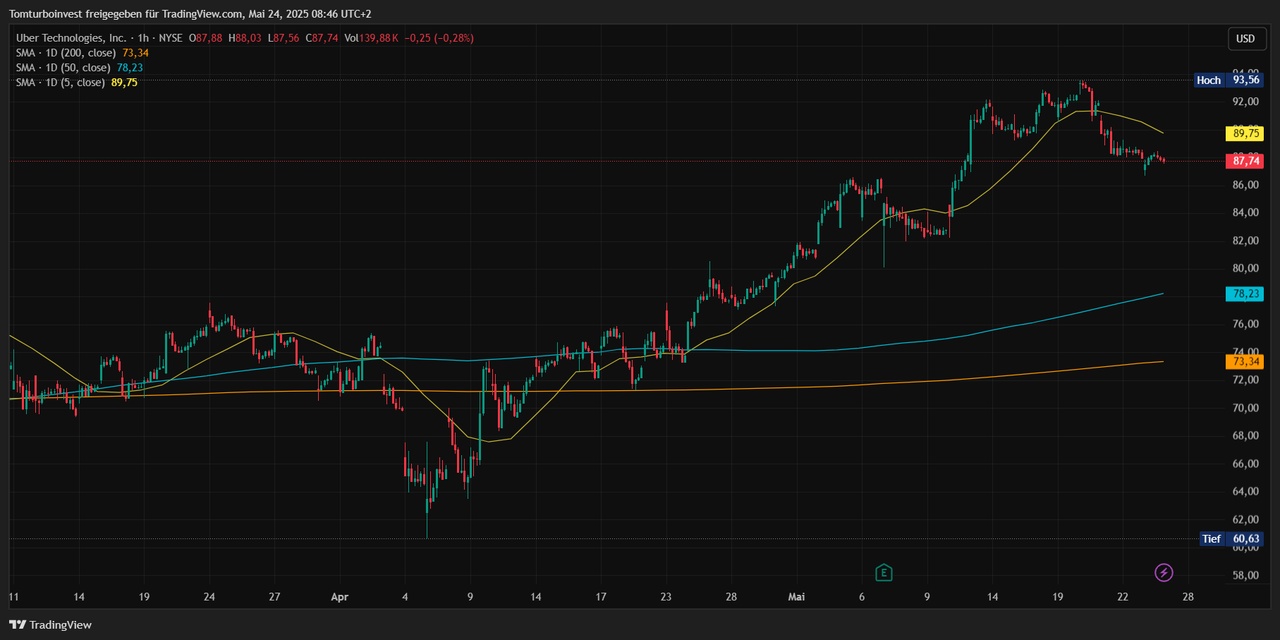
For me, an important setting for the SMA is that I always use the SMA regardless of my chart setting always on a daily basis. daily basis. This means that even if I have set the chart to weekly or 4h, it always shows me the SMA on a daily basis.
Example $UBER (+1,15%) 1h hour chart - but the SMA are still on a daily basis, not like the default setting, which always refers to the chart - then the SMAs would be calculated on a 200 / 50 / 5 hour basis!
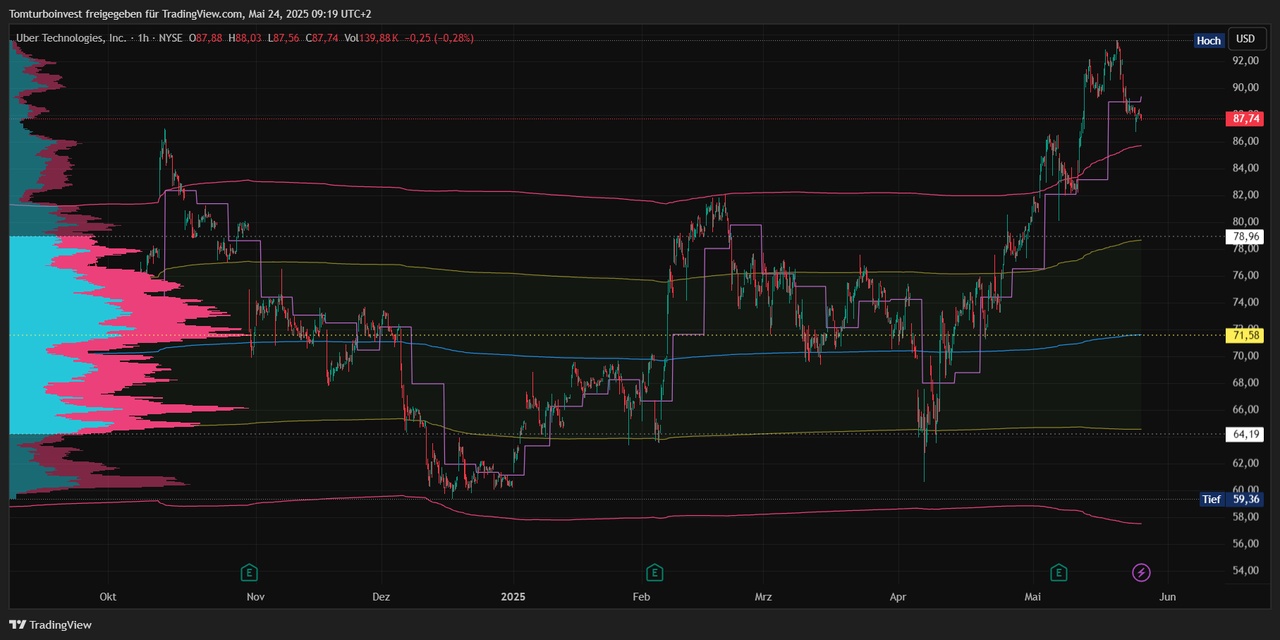
Next, I'll get the VRVP to see the volumes. I have set the chart to the range since Uber has been in an overarching sideways phase.
I can see the price area with the highest volume and the distribution where 68% of the volume has taken place.
My VRVP settings are as follows, I adjust the line size depending on the visible range - the larger the range, the larger the number of lines.
So, I now have a good overview of the trend after a few minutes.
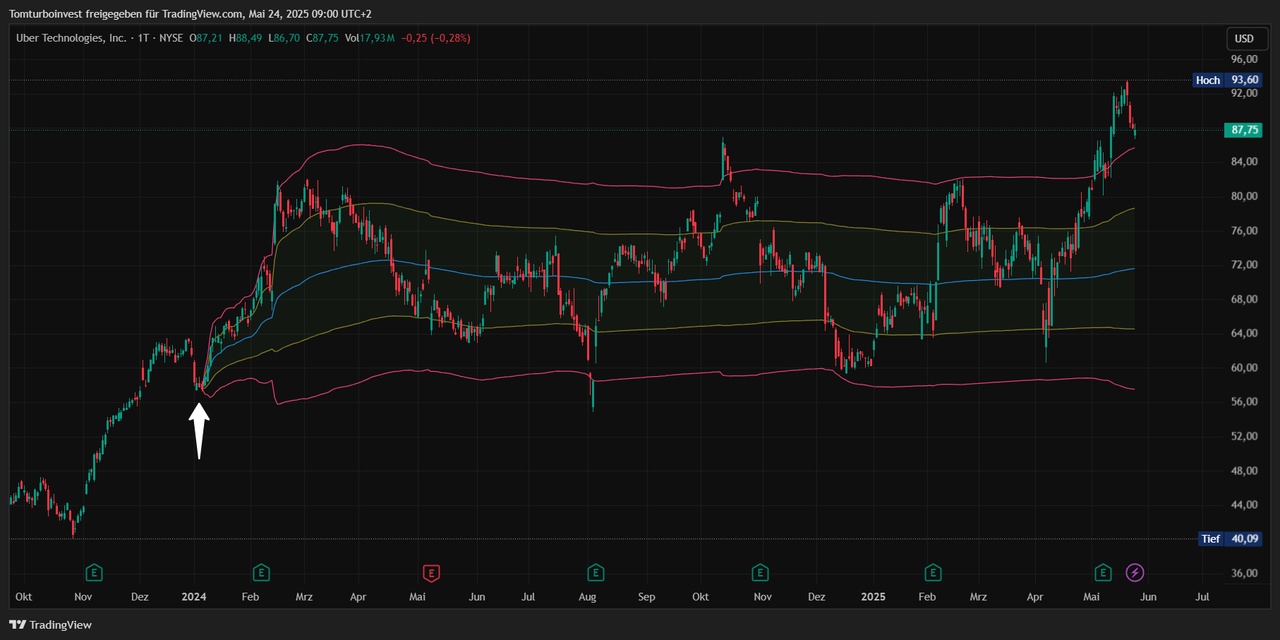
Now it's time to continue with the VWAP. My anchored VWAP I place it in a prominent position for me. In this case the last low before the start of the sideways phase. This is how I see the "DNA" of Uber - How does Uber behave in the statistical areas of the volume-weighted average price.
For my short-term trades, I zoom into the close range, but the anchored VWAP remains. I only switch to the 1 hour chart and the last few months.
The white circles then show potential entries and exits for me. The orange circles at the bottom show the earnings, there's always a lot of movement😁
Of course, I also look in detail at the price action, i.e. the candles per time unit.
In principle, this describes my main procedure for determining the buy/sell point.
That's it 🤷♂️ has been working for me for a long time with the outcome as described in part 2 https://getqu.in/TVNdpR/
Because of the overview, I have hidden the VRVP in the VWAP views, but I always leave it on for my analysis.
Example anchored VWAP with VRVP and SMA5 for the short-term trend
Example anchored VWAP with VRVP and VWAP on a weekly basisI can see where the VWAP of the current week has moved. It's also nice to see how and where the big volumes of the week have positioned themselves 😁
So, that's a bit more detail on my setup. As you can see, with a little practice and routing, you can analyze a stock in a short time. For me, such an analysis usually takes no longer than 10 minutes and I know whether a trade makes sense for me and where to place my buy and sell orders.
PS: I have found a clever script on TradingView for some of my stock screener filters. You can always display some criteria live - in the chart at the bottom right
You can find it under the indicators: Ticker Dashboard For Better Stock Selection
$ADYEN (-1,36%)
$MMK (-1,57%)
$MRK (-2%)
$KTN (+1,97%)
$BRBY (-3,52%)
$OMV (+0,17%)
$VER (-1,3%)
$BG (+0,09%)
$VOE (+1,4%)
$ZAL (-0,94%)
$VRTX (+0,74%)
$RDC (+1,94%)


+ 6

It reads very well. 💪🏼
Trading part3- more than hectic trades and coffee consumption ☕☕☕☕
As always, first the link to the first post, where you will also find the links to all the other parts https://getqu.in/cbIOkg/
Thanks to the bad weather, the next part will be published before the weekend! 🌨🌨 Next week I'll be traveling for work from Monday to Wednesday - so long posts will be difficult. But maybe I'll be able to pick up some exciting insights from SAP & Amazon. 😊
I'm pretty busy, but if anyone happens to be at SAPPHIRE in Madrid... 🍻
Today I'll give you an insight into my trading setupbut first I'll briefly talk about the outcome bias. This is an important topic that can become a trap, especially at the beginning of trading.
Outcome bias
Outcome bias is the misconception that the quality of a trade is determined by the result. Anyone who enters into a trade on the straight and narrow and then makes a profit often thinks they have got the hang of it. I like to compare it to a casino: I bet on red, win and consider myself "strategic" 🤪😅
When trading, it is important to success or the strategy by the repeatability by repeatability. By clear rules. A strategic trade can lead to a loss. An intuitive decision can lead to a profit. Anyone who makes the latter the yardstick for their trading is undermining long-term success.
👉 Remember: In trading, it is not those with courage and luck who are rewarded in the long term, but the systematic ones!
This leads us straight to the first details of my setup.
What are my premises?
- I only trade shares - no derivatives, leveraged products, KOs, Forex or anything else
I have tried a few things, but for my trading behavior shares have proved to be the most sustainable with the best profit/loss ratio.
- Keep it simple - Only a handful of indicators
Over the years I have tried all kinds of indicators and oscillators. From RSI, MACD, Fibonacci, all possible trend lines, so that the actual chart progression was barely visible 🤪
- I only trade when it makes sense according to my rules
Trading not just for the sake of trading. Quality before quantity, if it doesn't fit or if time is tight, then I don't trade for a week or two.
Now that you know that my focus is only on equities, I'll move on to stock selection. In my opinion, this is just as important as chart analysis and deriving entry and exit points.
What are my filter criteria for screening?
- ADR Average Daily Range
The daily range is the range between the daily high and the daily low, a large range facilitates short-term trading, e.g. intraday or only a few days
- ADV Average Daily Volume
- $VOL
Average daily volume multiplied by the last daily closing price
These two filters ADV and $VOL ensure the liquidity to get out of the trade at any time.
- Market capitalization
I am not a fan of penny stocks and very small market capitalization
- Gap greater than 5% on earnings
- Upcoming earnings
I also like to trade around earnings, there's often a lot of movement.
In general, I like stocks that are moving in a sideways trend, or prices that are at the VWAP or at one of the outer edges of the deviation bands.
What are my indicators for chart analysis?
- SMA 200 / 50 / 5 for trend determination
Attention ONLY for trend determination - is not used for entry/exit points!
- VRVP Visible Range Volume Profile - the volume profile on the Y-axis. You can usually see it on the left-hand side of my charts. This shows me volume areas where there was a lot of trading. I derive my entry/exit points from this indicator and the VWAP
- VWAP Volume Weighted Average Price - shows me the average volume-weighted price at the various time levels. I usually look at this on a monthly and weekly basis. For very short-term trades such as intraday also on a daily basis or on a session basis. I then use the "anchored" VWAP for the entry/exit prices. In return for the fixed values of the VWAP such as month, week or day, I can place it exactly where I want to see the VWAP from. Points for anchored VWAP are swing changes.
- Volume per time unit I usually hide it again after the first glance in order to keep a clear overview. It's about seeing the interest per candle.
Conclusion: I only use SMA and volume, no more, but also no less.
PS: A short "deepdive" on the indicators, the exact settings, etc. will follow in a separate post👆 https://getqu.in/Ka18zh/
In general, I always start my analysis on the stock's home exchange. First a quick look at the last 10 years in the weekly chart, then I continue with the daily chart looking at the last 2-3 years and then the close range of the last months or even just days, depending on how the time horizon of my trade is set up. In the close range, I also like the 4h, 1h or 15min chart. The whole thing is overlaid with the 3 SMAs 200 / 50 and 5 days for the short-term trend.
Once I have a good overview of the trend, I move on to the 2nd layout with VRVP and VWAP or aVWAP. I am always happy when significant volumes of the VRVP coincide with the VWAP or the bandwidths 1 and 2 of the anchored VWAP. According to my statistics, the success rate is highest here. Depending on which exchange I want to trade on, I then also set the chart to this exchange.
I could write endlessly about volume in connection with the VWAP, but that would go beyond the scope of this article. Volume highs, volume lows, POC, volume area, deviation bands 1 and 2, etc...
To see how I use these indicators, you are welcome to read my posts on $NOVO B (+0,84%) or also $UBER (+1,15%) to see them. Or also my short 5min analysis for $MRK (-2%) which I recently created for my compatriot @7Trader recently. You can find them all in the feed of my profile from the recent past.
Should I go into more detail on charts & inferences in my future trading posts? Let me know in the comments!
So, that's it again for today - have a nice week!
Click here for part 4


Trading part2- more than hectic trades and coffee consumption ☕☕☕☕
Link to the first post in which you will also find the link to all other parts https://getqu.in/cbIOkg/
Today I'm giving you an insight into my trading routine! I'll show you how much time I invest, how my trades have gone so far in 2025 and how I use my capital.
- Time spent
- Trade frequency
- Profit/loss trades YTD 2025
- Capital employed
Time spent
I invest on average 5 hours per week in trading. But not just blindly!
Weekend preparation: 1 hour for stock selection & chart analysis
At the weekend, depending on my mood, the weather and other family activities, I prepare for the "trading week". This can be Saturday morning or Sunday evening. I spend about 1 hour selecting stocks and analyzing charts. I usually focus on 3 to a maximum of 5 stocks, for which I consider entry and exit points for the coming week.
The initial stock analyses are always carried out on the home stock exchange, I look at the price development at the various time levels, then superimpose my two layouts and I already have a clear picture and can decide whether trading makes sense. My focus is on trading qualitatively rather than quantitatively.
It's not about being active all the time, but only hitting the right setups. Therefore, "more time" is not a criterion for success. I know full-time traders who don't trade more than 3 hours a day.
During the week: About 30-45 minutes a day to execute & monitor trades
If the worst comes to the worst, you can intervene and add to your position or adjust your trading SL to protect your profits. If you are traveling for work, you can also rely only on the orders placed in advance - see the post in the feed from $ADYEN (-1,36%)
.
Trade frequency, profit/loss trades YTD 2025 and capital employed
I am summarizing these points because it fits thematically and I can then cover several interesting aspects in one capital.
As of May 16, 62 trades have been closed, compared to 128 buy orders, which is because I usually enter in tranches.
- 128 buy orders
- 62 sell orders
- Total 190 orders,
- average 42 per month, just under 10 per week
There are weeks when I don't trade at all, others with more trades.
What is the balance of the 62 closed trades?
Only realized profits/losses count for traders. Book profits/losses are only temporary movements in the defined areas of risk management.
- 50 trades with profit (80%)
- 12 with a loss (20%)
And what does that mean in euros?
This question brings us to the next interesting piece of information. Is this more than just fun and enjoyment in trading? Or are you just one of the 80% who supposedly only lose money by trading?
The following figures are net, i.e. less KEST, order fees and other costs such as for the securities account, subscription to TradingView, etc.
Losses: €1,266.73 (9 trades <€100 loss, 3 trades in the range between €200 and €400)
Gains: 14.797,21€
(most of the gains are between 5% and 10% per trade)
Total net: 13.420,97€ (Jan-Mid-May)
The trading frequency makes it. It's not about the one big "tenbagger", but about an appropriate trading frequency with solid trades. It is easier to achieve 10 times 10% than to wait for a tenbagger and have the capital tied up in a trade for a long time.
Conclusion: Trading as a side income can be worthwhile - my average net income: 2,982.43€ per month for 5 hours of effort per week.
Anyone expecting to become a millionaire quickly will be disappointed - but as a hobby it is a solid regular income!
Question for dividend investors: How much capital do you need to invest to get a net dividend of around 3k a month?
Yes, yes 😅 it's clear that trading is different from pursuing a dividend strategy. It's just to illustrate that you can achieve a nice side income with relatively little capital compared to dividends.
This question brings us to today's final point. How much capital do I need to invest for short-term trading?
I keep about 40-50k as risk capital for short-term trading, with position sizes between 5k and 10k.
For beginners: Don't worry! I started with €500 to €1,000 per trade and gradually worked my way up. Confidence in your own setup is the key. The proceeds flowed into steadily increasing position sizes. Like B&H, it's a snowball effect!
In addition to my capital for short-term trading, I also have around 100k parked in longer-term "swing trades" (months to 1-2 years). But from a trading point of view it's the same, only the time horizon is different. Today's post, including the figures, only refers to short-term trading.
So, I hope this article has clarified your previous picture of a part-time trader.
In the next post I will reveal my trading setup, my indicators and my exact preparation for the trading week!
Click here for part 3 https://getqu.in/9XGYtO/
Below are links to a few stocks that I have recently written about.
$ADYEN (-1,36%)
$UBER (+1,15%)
$BRBY (-3,52%)
$NOVO B (+0,84%)
$RDC (+1,94%)
$KTN (+1,97%)

Titoli di tendenza
I migliori creatori della settimana