1Settimana·

Trading Part4 - Deepdive indicators 📈📉☕

As always, first the link to the first post, where you will also find the links to all the other parts https://getqu.in/cbIOkg/


Today there are a few more details on the indicators from part 3 https://getqu.in/9XGYtO/


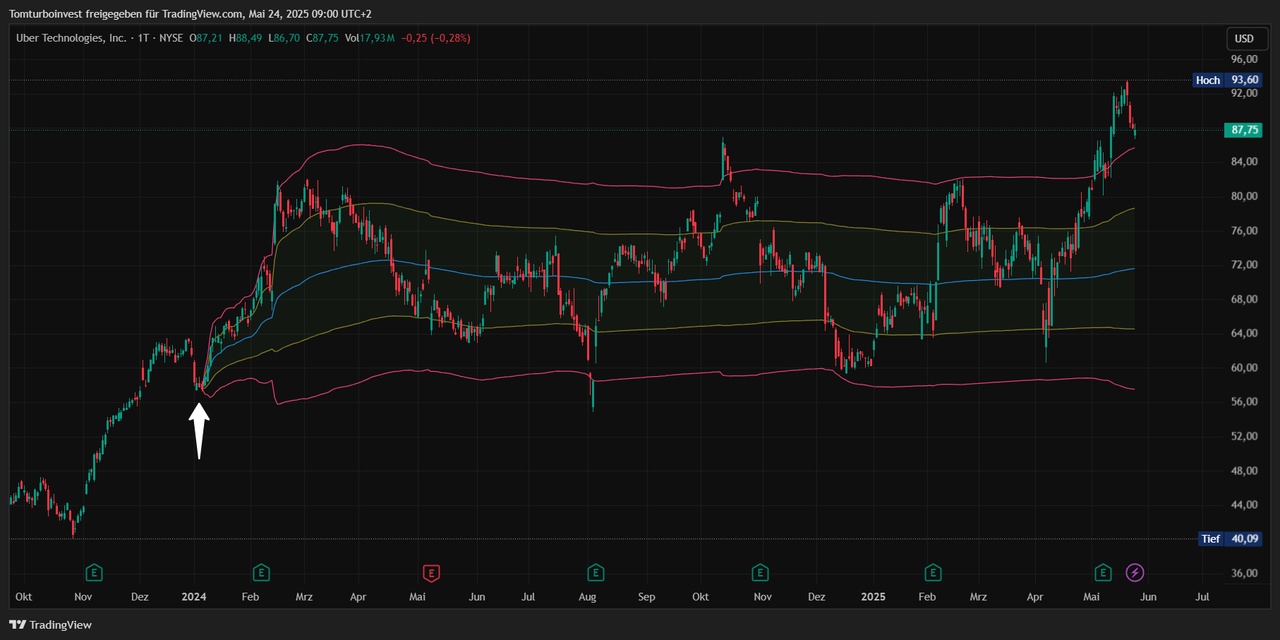
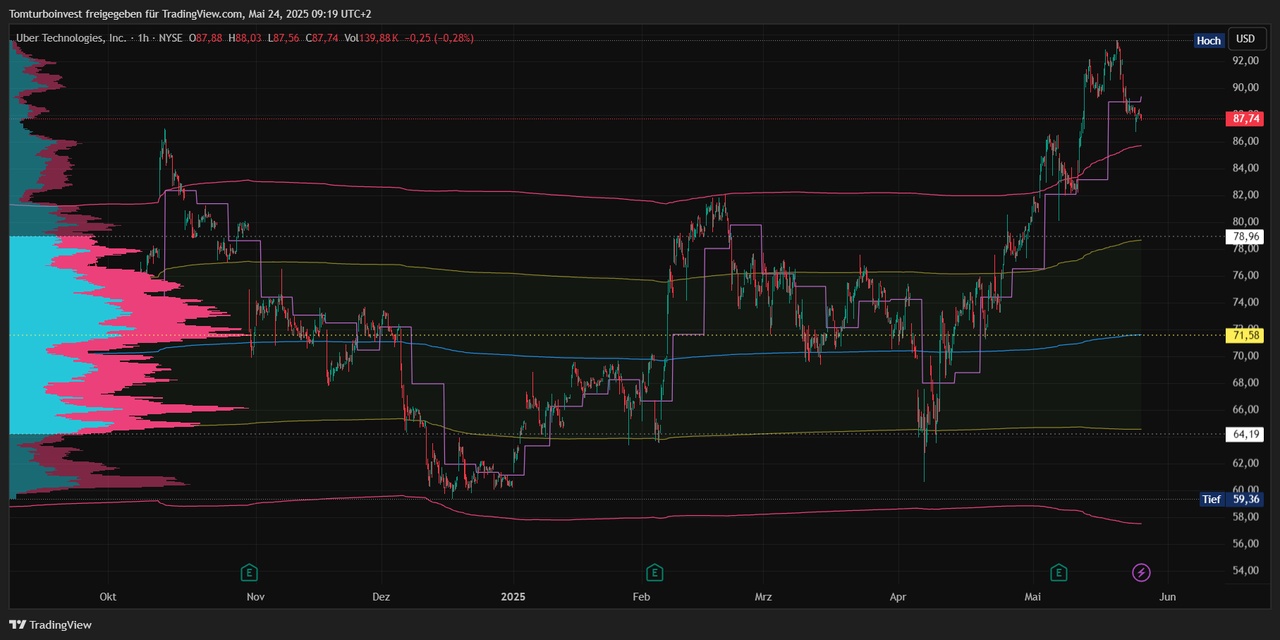
As described in part 3, I start my analysis with the SMA 200 / 50 / 5 daysto get an overview of the trend.


Example $UBER (+0,03%)

attachment


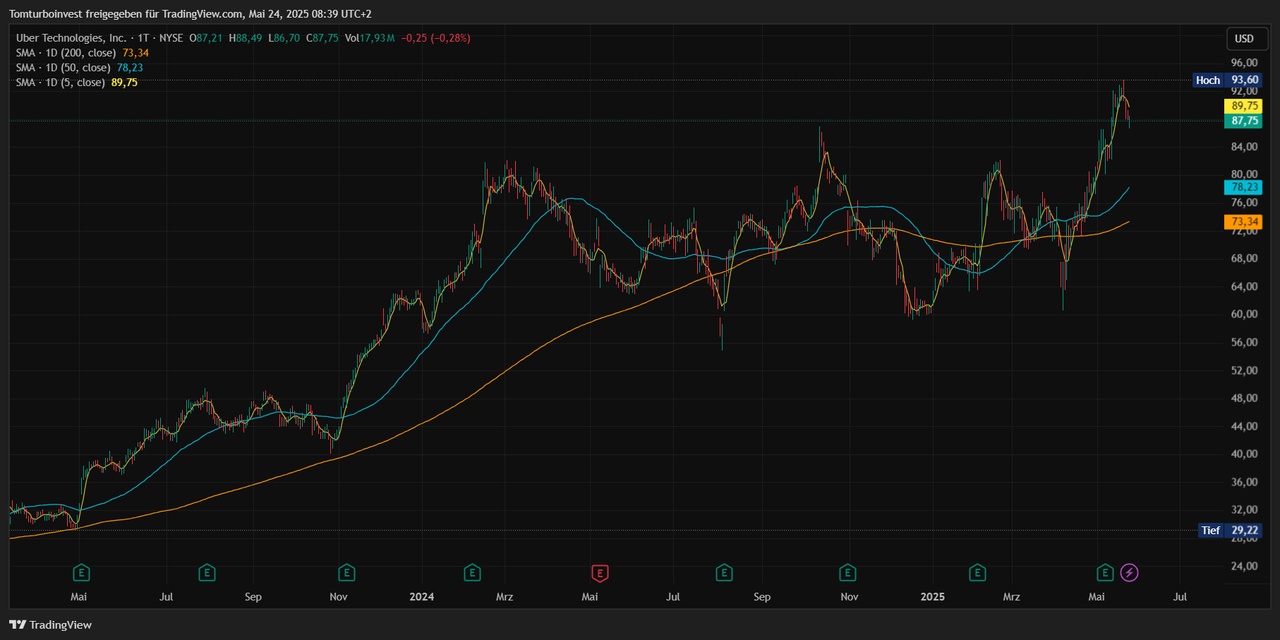
For me, an important setting for the SMA is that I always use the SMA regardless of my chart setting always on a daily basis. daily basis. This means that even if I have set the chart to weekly or 4h, it always shows me the SMA on a daily basis.
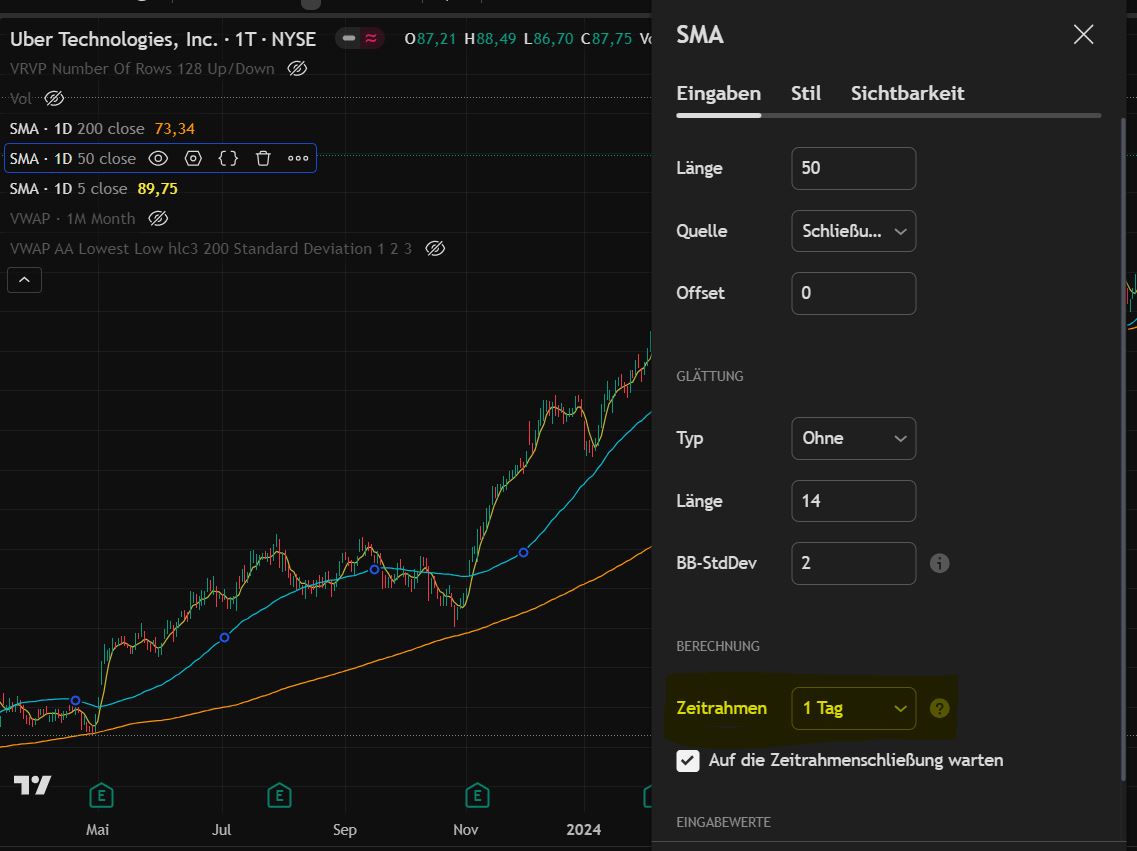
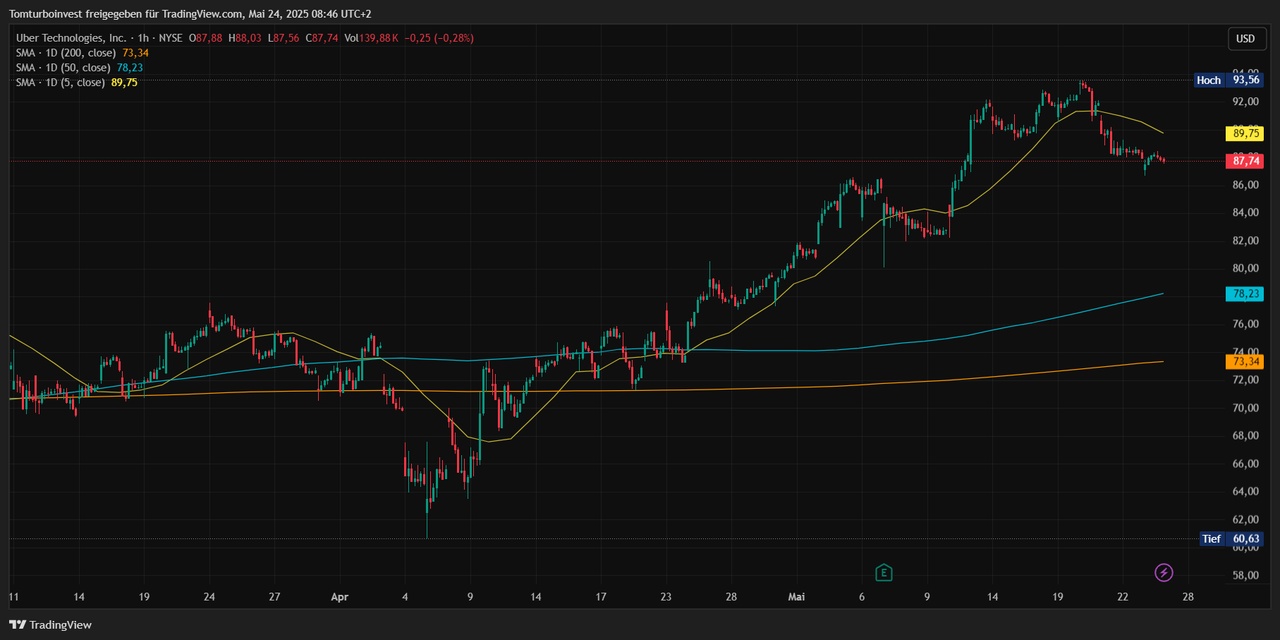
attachment

Example $UBER (+0,03%) 1h hour chart - but the SMA are still on a daily basis, not like the default setting, which always refers to the chart - then the SMAs would be calculated on a 200 / 50 / 5 hour basis!

attachment

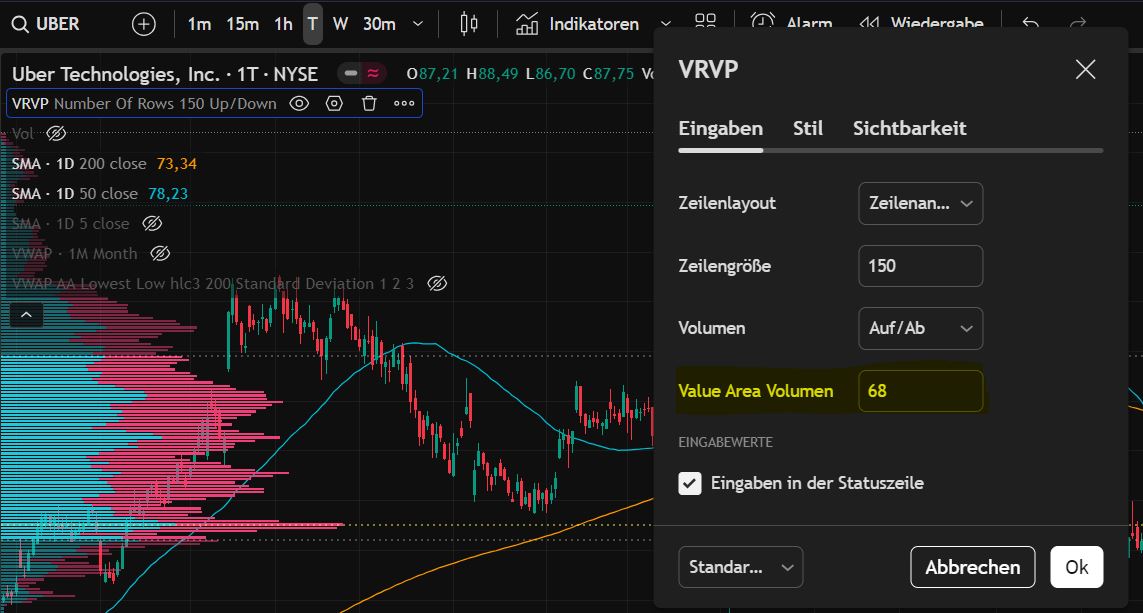
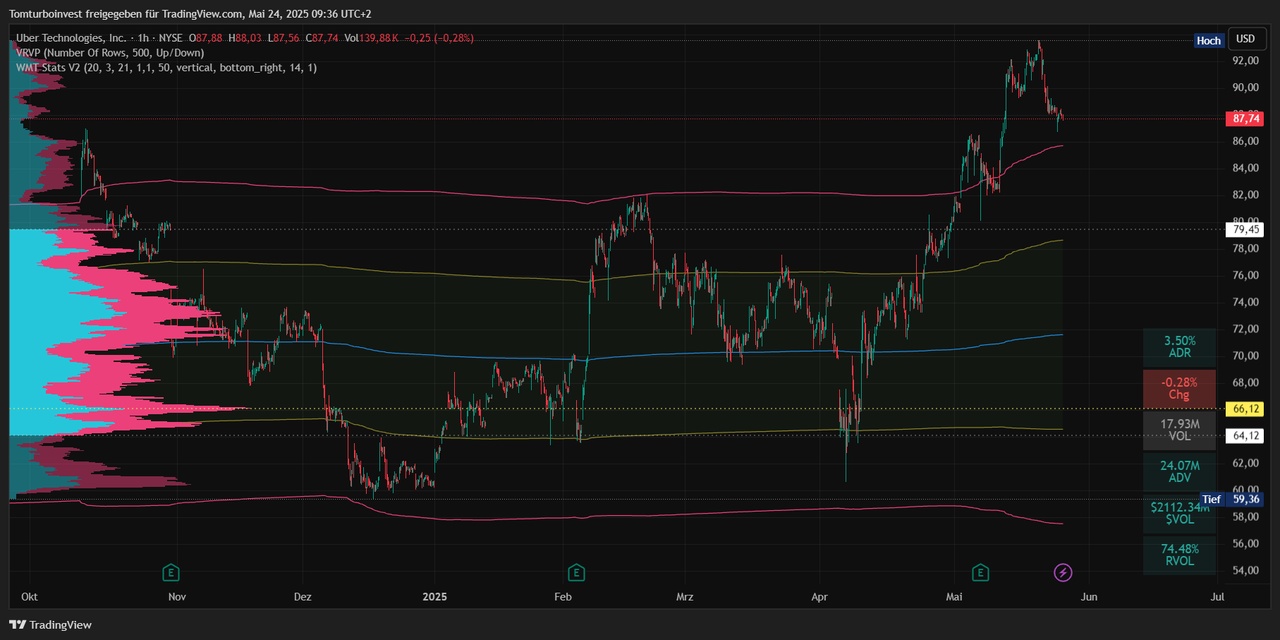
Next, I'll get the VRVP to see the volumes. I have set the chart to the range since Uber has been in an overarching sideways phase.

attachment

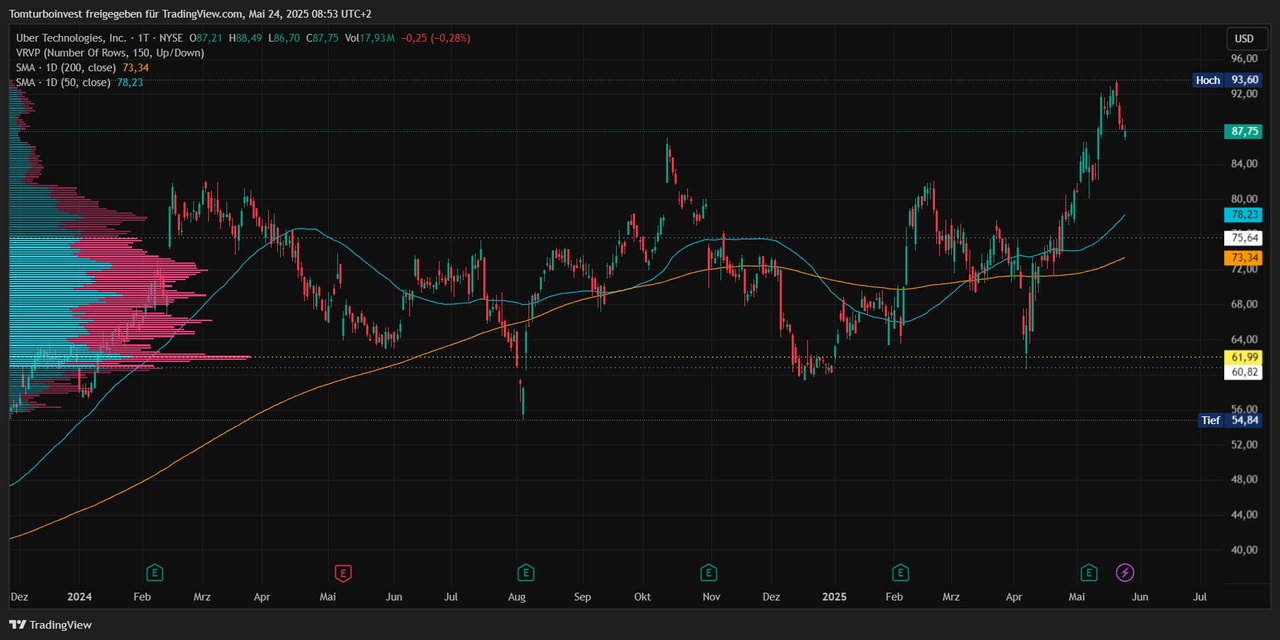
I can see the price area with the highest volume and the distribution where 68% of the volume has taken place.


My VRVP settings are as follows, I adjust the line size depending on the visible range - the larger the range, the larger the number of lines.

attachment

So, I now have a good overview of the trend after a few minutes.


Now it's time to continue with the VWAP. My anchored VWAP I place it in a prominent position for me. In this case the last low before the start of the sideways phase. This is how I see the "DNA" of Uber - How does Uber behave in the statistical areas of the volume-weighted average price.

attachment

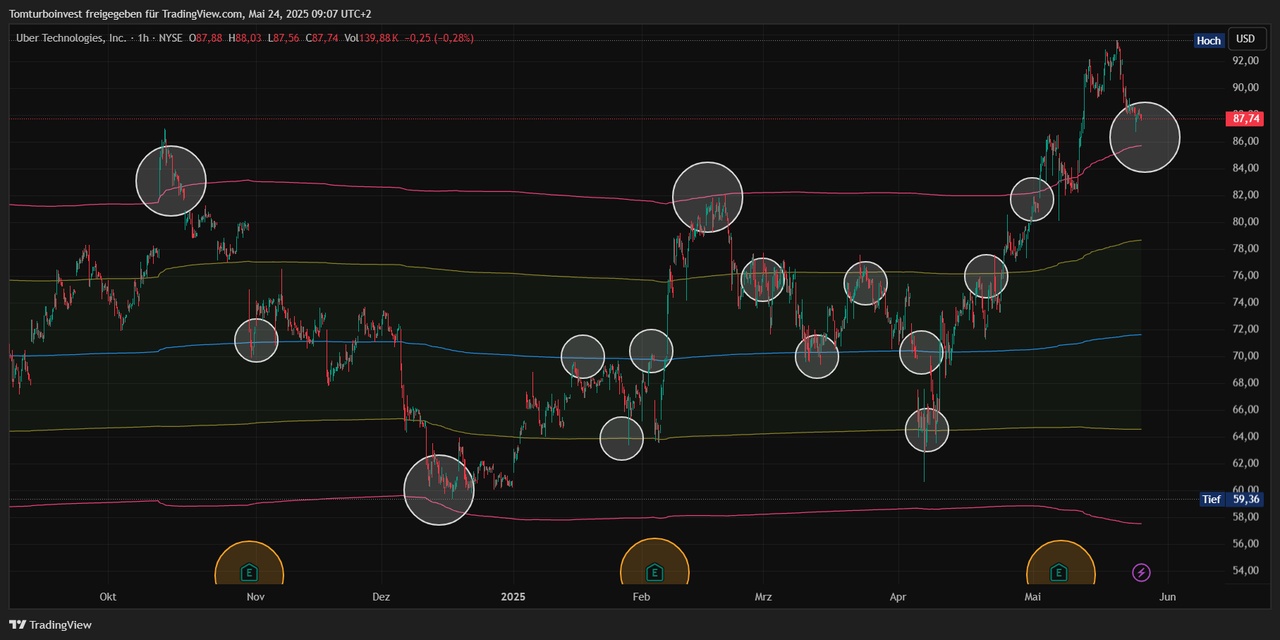
For my short-term trades, I zoom into the close range, but the anchored VWAP remains. I only switch to the 1 hour chart and the last few months.


The white circles then show potential entries and exits for me. The orange circles at the bottom show the earnings, there's always a lot of movement😁

attachment

Of course, I also look in detail at the price action, i.e. the candles per time unit.


In principle, this describes my main procedure for determining the buy/sell point.


That's it 🤷‍♂️ has been working for me for a long time with the outcome as described in part 2 https://getqu.in/TVNdpR/


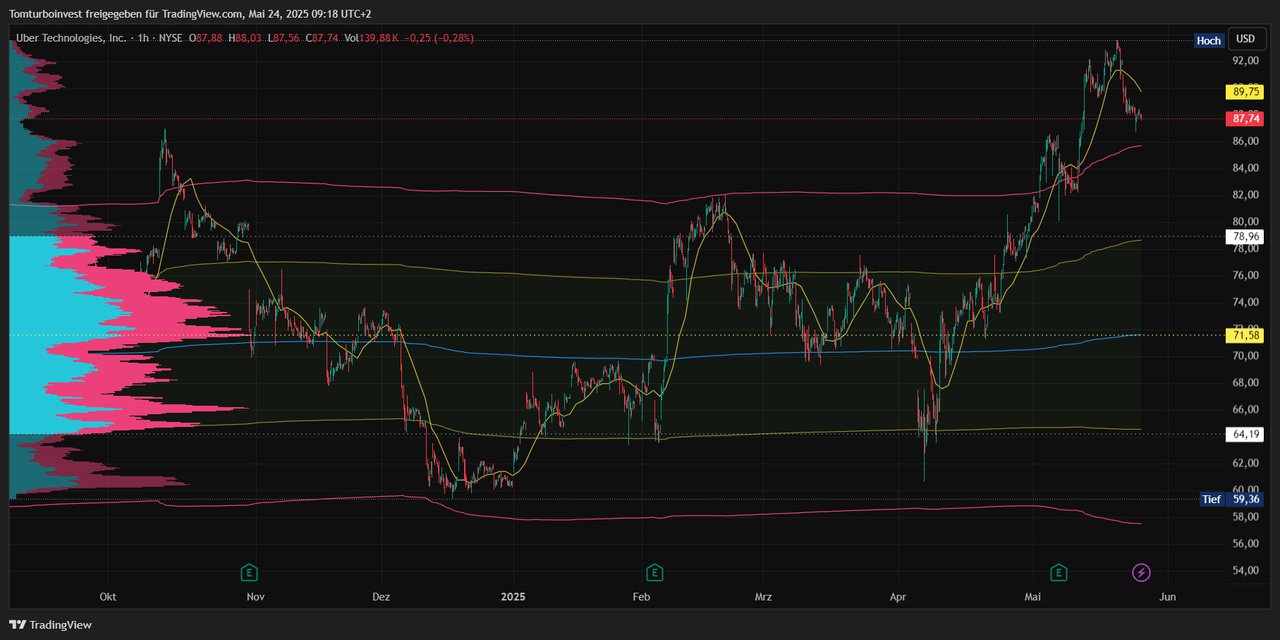
Because of the overview, I have hidden the VRVP in the VWAP views, but I always leave it on for my analysis.


Example anchored VWAP with VRVP and SMA5 for the short-term trend

attachment

Example anchored VWAP with VRVP and VWAP on a weekly basisI can see where the VWAP of the current week has moved. It's also nice to see how and where the big volumes of the week have positioned themselves 😁

attachment

So, that's a bit more detail on my setup. As you can see, with a little practice and routing, you can analyze a stock in a short time. For me, such an analysis usually takes no longer than 10 minutes and I know whether a trade makes sense for me and where to place my buy and sell orders.


PS: I have found a clever script on TradingView for some of my stock screener filters. You can always display some criteria live - in the chart at the bottom right


You can find it under the indicators: Ticker Dashboard For Better Stock Selection

attachment


$ADYEN (+0,71%)
$MMK (-0,13%)
$MRK (+1,19%)
$KTN (+0%)
$BRBY (+1,49%)
$OMV (-0,25%)
$VER (+0,55%)
$BG (+0,37%)
$VOE (-1,53%)
$ZAL (+1,03%)
$VRTX (-0,98%)
$RDC (-0,85%)

#trading

40
15 Commenti

immagine del profilo
1Settimana
Thank you for the elaborate article and the impressions.
It reads very well. 💪🏼
2
immagine del profilo
Thank you very much for your effort 💖
Extremely exciting 😄
1
immagine del profilo
@Aminmeskini it's really exciting 😅especially if you're a bit "analytical" like me.
And it's really fun once you've found a setup that works for you. Everyone has to try it out for themselves.

And🤫, it's a hobby that my wife fully supports 😂 When I take the time to analyze stocks, there are never any complaints😉
2
immagine del profilo
@TomTurboInvest you have a great wife!!! ☺️
1
immagine del profilo
@TomTurboInvest First of all, thank you once again for sharing your knowledge - hats off!
I have carefully studied and understood parts 1 to 3.
I am now stumbling with part 4. But that's not because of you, but because of a lack of basic knowledge on my part. That's not surprising, because I'm a beginner in the field of trading, which means I still need to acquire a lot of knowledge and understanding.

Therefore, I would like to ask if it is ok for you to ask some "stupid" questions on my part.
My goal is to understand and comprehend your approach and then be able to apply it (initially in the "practice room" via paper trading at Tradingview).
Does that suit you?
1
immagine del profilo
@Investor-College feel free to ask what interests you, that's what a forum is for. As I'm always away on business, it can sometimes take a few days, but an answer will come, and if I don't know the answer, I'll let you know 😅
immagine del profilo
@TomTurboInvest Ok - I think that's great!
As I understand it, you carry out 3 main steps:
1. show SMA 5, 50 and 200 days
2. show VRVP
3. anchor VWAP

You explain all three, but I realize that I am quickly left behind (which is probably obvious to you, but I want to be taken along and learn from you).

Let's go slowly so that I can keep up: Let's look at the first step. Here are my questions:
- What exactly do you deduce from the first picture showing Uber's price action over about 1 year, with SMA 5, 20 and 200 plotted on it?
- What is going through your mind here, what are your thoughts on this?
- What do you recognize at this point?
- What makes this chart and the SMAs interesting for you, what do you deduce from it, what do you notice?
- What is the quintessence or summary for you after this first step?

I'm quite curious, I know. But it has to do with my job as a journalist, which I did for almost 25 years. And incidentally that's why I was a regular at Sapphire :-)
1
immagine del profilo
@Investor-College 😉 I'm on my way to Madrid for SAPPHIRE so I have a bit of time.

From the SMAs I read the trend - from the SMA200 - moving average price of the last 200 days - I read the overarching trend. from the 50s the "shorter" term trend and from the 5 days the current short term trend. The 5-day is relevant for me for daily/weekly trades.

If they are all pointing upwards, this is a stable uptrend, so focus on long trades. If the SMAs point in different directions, e.g. the 200 and 50 point upwards, but the current 5-day trend points downwards, then for me this means, for example, I wait until the price reaches the VWAP again or one of the next lower volume edges, which could then be a good entry for longs, as the overriding trend such as the 200 and 50 is still pointing upwards. It will then probably only be a short setback within the trend channel.

It is almost impossible to describe all of this in a commentary, but I hope this example shows what you can read from it. It should be noted that the 200 and 50 are always lagging indicators. This means that even if the trend reverses, they will still point upwards for some time! My contributions do not replace a trader's education - the intention was to show what a "hobby" trader does, what it takes and what the time expenditure is. That not everything that has to do with trading is always bad 😉

General rule - don't trade against the trend! Always follow the trend in the short term - watch out for consolidation in the price actions (price development of the candles) and then get in. In the long term, I always enter turnaround trades, i.e. although the trend is still going down, I try to anticipate a bottom from the volume and volume-weighted data - but there is never 100% certainty, so losing trades are also part of the business.
1
immagine del profilo
@TomTurboInvest Perfectly explained, I understood it and can understand it - it fits perfectly.

So let's move on to step 2: The VRVP is displayed.

My questions about this:
- What range or observation period makes sense?
- What do you read from this, what insights do you gain here?
- Does this complement step 1 or can it be seen as two "separate" insights (which is my guess)?

Have a good trip and good luck!
1
immagine del profilo
@Investor-College The sensible time period for the VRVP depends a little on the time period you want to invest in the trade.
For short-term trades, I often only look at the last 2-3 months, but if I'm going for a longer trade or turnaround, then I also look back a few years.
For me, the VRVP and VWAP are actually separate steps, but you still have to take all the information into account when making decisions.

The so-called high volume nodes and low volume nodes are interesting, from which you can deduce at which prices a lot of volume was traded, or just a little.
High volume nodes show you resistance/support, whereas low volume nodes are areas where even small volumes can lead to larger price movements.
I recommend that you simply google VRVP and search for YT videos, there is a lot of content there. It is not possible to explain this in detail in a comment.
If you are interested, do a lot of your own research, hand in hand with the open chart in a tool.
1
immagine del profilo
Very helpful articles! I would like to ask if these indicators come with free trading view version and also, how so that you are not fan of fibonaci? Thanks for the answers!
1
immagine del profilo
@teoo SMAs are for free. I'm not sure, but I think the VRVP and anchored vwap aren‘t available in the free version.
I don't use Fibonacci because vwap gives me better results, especially for short-term horizons. At least, that's what my statistics show.
If Fibonacci works for you, keep it. Everyone has to find the setup that suits them and leads to success.
1
immagine del profilo
1
@TomTurboInvest really great post and I think some of us could understand your approach very well! I think it would be helpful for many of us to see your current setting, for example which aktiento trade or which entry you see where. Do you see a possibility to take it with you somehow so that we can follow your trade promptly? Because I think that's the best way for us to gain your expertise. I can quite understand that you can't and don't want to do this in front of a large audience 🙈😅 so please write me a PN if you would like to "take along" four or five interested parties here a little more closely.
Have a great time in Madrid with lots of great impressions, including at the SAP event
1
immagine del profilo
@Phil0308 Thanks for the feedback! Madrid was interesting, and I was also able to make a small contribution as a speaker 🤪😅. I flew back yesterday evening. Enjoying the public holiday in Austria today and getting an overview of what's happening on the stock market again.

As I wrote at the very beginning in the first post, I don't want to throw around tips, promises of profits and/or hot trading signals. Everyone has to trade for themselves and on their own responsibility. But what I do, as time permits, is to post my trades promptly, but always against the background of the chart, so that you can understand why a stock is interesting at time x. Like the post on $STZ just now, for example
So there are practical examples of my setup. "After trading" is always dangerous, as my posts can't always be made promptly. I don't manage to post all the trades here anyway, etc. This means that you would always be later, both when entering and exiting - and my risk management will not match yours either.

But I always try to post something before or after the trade, not just afterwards when everything has gone well. Let's see how long I hold $STZ, there will certainly be an update at some point, whatever the outcome. Losing trades are also part of it.
1
Partecipa alla conversazione