As always, first the link to the first post, where you will also find the links to all the other parts https://getqu.in/cbIOkg/
Today there are a few more details on the indicators from part 3 https://getqu.in/9XGYtO/
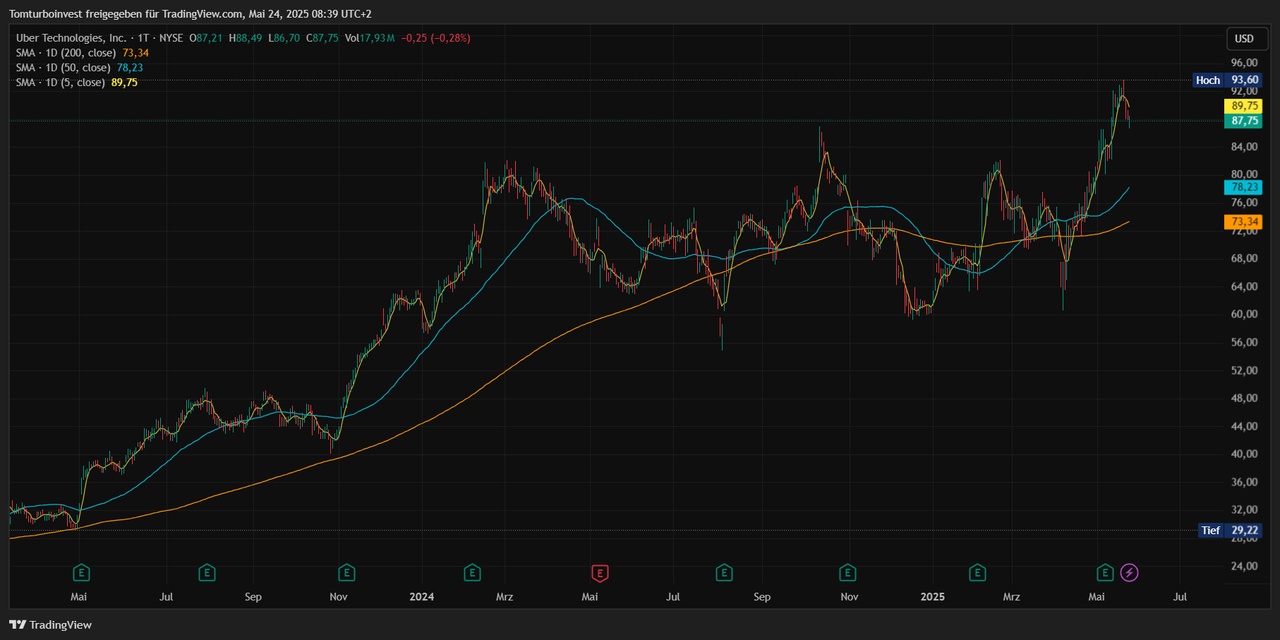
As described in part 3, I start my analysis with the SMA 200 / 50 / 5 daysto get an overview of the trend.
Example $UBER (+0,99%)
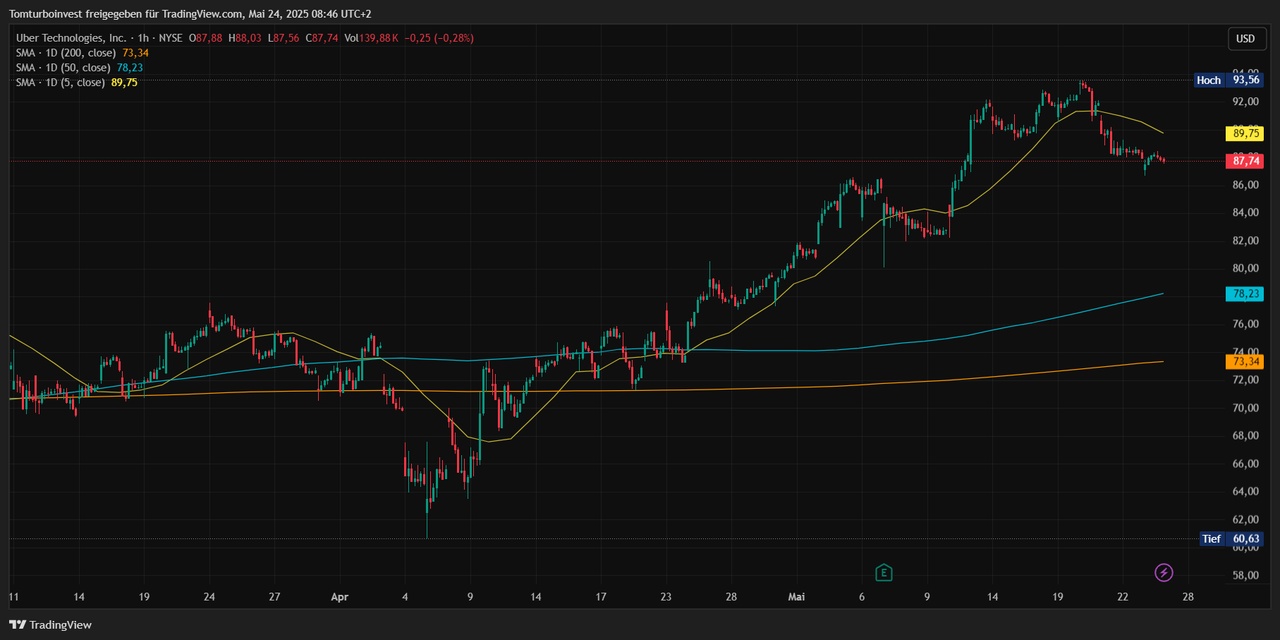
For me, an important setting for the SMA is that I always use the SMA regardless of my chart setting always on a daily basis. daily basis. This means that even if I have set the chart to weekly or 4h, it always shows me the SMA on a daily basis.
Example $UBER (+0,99%) 1h hour chart - but the SMA are still on a daily basis, not like the default setting, which always refers to the chart - then the SMAs would be calculated on a 200 / 50 / 5 hour basis!
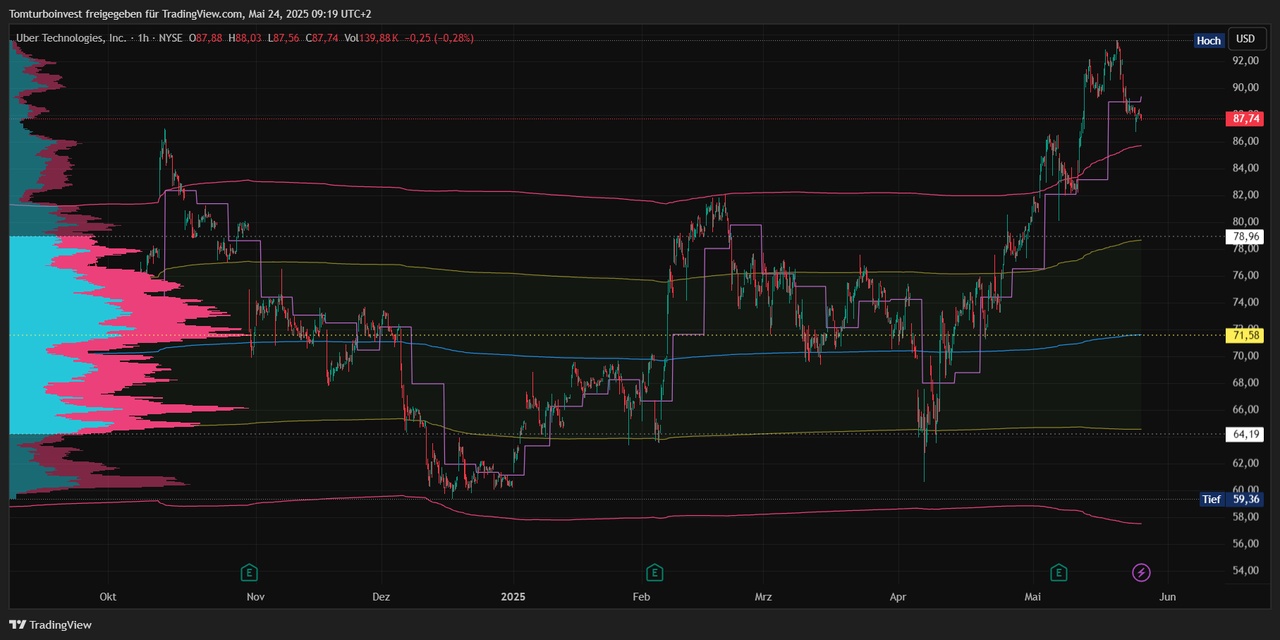
Next, I'll get the VRVP to see the volumes. I have set the chart to the range since Uber has been in an overarching sideways phase.
I can see the price area with the highest volume and the distribution where 68% of the volume has taken place.
My VRVP settings are as follows, I adjust the line size depending on the visible range - the larger the range, the larger the number of lines.
So, I now have a good overview of the trend after a few minutes.
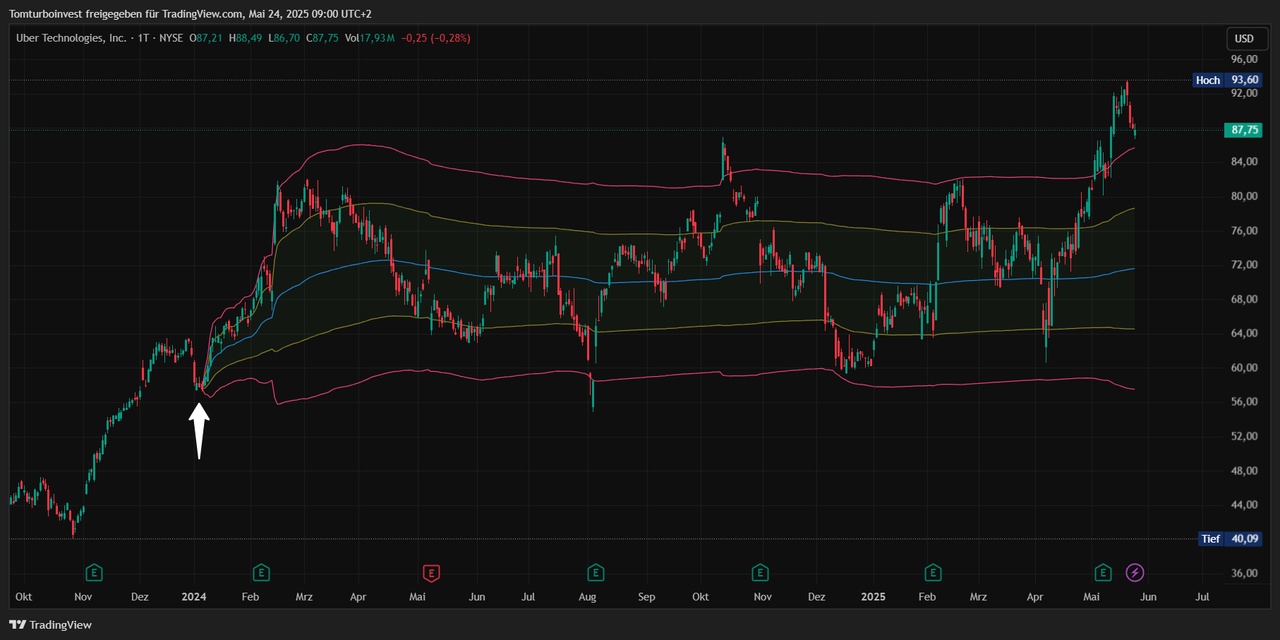
Now it's time to continue with the VWAP. My anchored VWAP I place it in a prominent position for me. In this case the last low before the start of the sideways phase. This is how I see the "DNA" of Uber - How does Uber behave in the statistical areas of the volume-weighted average price.
For my short-term trades, I zoom into the close range, but the anchored VWAP remains. I only switch to the 1 hour chart and the last few months.
The white circles then show potential entries and exits for me. The orange circles at the bottom show the earnings, there's always a lot of movement😁
Of course, I also look in detail at the price action, i.e. the candles per time unit.
In principle, this describes my main procedure for determining the buy/sell point.
That's it 🤷♂️ has been working for me for a long time with the outcome as described in part 2 https://getqu.in/TVNdpR/
Because of the overview, I have hidden the VRVP in the VWAP views, but I always leave it on for my analysis.
Example anchored VWAP with VRVP and SMA5 for the short-term trend
Example anchored VWAP with VRVP and VWAP on a weekly basisI can see where the VWAP of the current week has moved. It's also nice to see how and where the big volumes of the week have positioned themselves 😁
So, that's a bit more detail on my setup. As you can see, with a little practice and routing, you can analyze a stock in a short time. For me, such an analysis usually takes no longer than 10 minutes and I know whether a trade makes sense for me and where to place my buy and sell orders.
PS: I have found a clever script on TradingView for some of my stock screener filters. You can always display some criteria live - in the chart at the bottom right
You can find it under the indicators: Ticker Dashboard For Better Stock Selection
$ADYEN (+0,81%)
$MMK (-1,65%)
$MRK (+0,19%)
$KTN (+0,82%)
$BRBY (+3,45%)
$OMV (-0,14%)
$VER (+0,34%)
$BG (+0,93%)
$VOE (+0,48%)
$ZAL (-0,93%)
$VRTX (+0,9%)
$RDC (-2,18%)
#trading


