
$WDC (-13,98 %)
$STX (-12,87 %)
$LRCX (-6,2 %)
And risk big for tomorrow $MUU

Postes
14$WDC (-13,98 %)
$STX (-12,87 %)
$LRCX (-6,2 %)
And risk big for tomorrow $MUU
$STX (-12,87 %) , $WDC (-13,98 %) , $SNDK (-10,98 %) , $LITE (-5,52 %) , $ARM (-5,22 %) , $MU (-6,43 %) ,$BTC (+0,94 %) , $ETH (+0,6 %) Stock market and Bitcoin performance still have makes new story every years. From both in race to get more high level position and market trends reasonable to have strategy from demand and supply in Q2- Q3 this years.
■ this time semiconductor and memory chips makes point on high level market and bitcoin still movement from traditional weakness in cycle frame time after halving season 2024-2025 (2y high).
■ Partial in get momentum for wave cycle could be better from Quartal season meanwhile cruide oil to hike and gold makes downward for this month. Its not different from wave cycle in market to get average return performance. (JUNE - SEPT)
■ World Cup 2026 "Burger and Beer" 24 hour and perfect in time "Las Vegas" open. There is match point from momentum and makes new momentum and strategy market for United State.
■ Underpressure and Tension from Crude Oil, High Price for stock market and Bitcoin low season, this is not just on strategy to get market trends (every 4 years in frame time). However its gonna be hits to get score onboard from Trump Part 2 and Goal score for "time to buy" ✅️🎯
■ Remember this event (4 years in frame time) 🚀


🚀🚀 May (the 5th month since the launch) also delivered a great performance. 🚀🚀
It only ran out of steam a little in the final week. But in the last 30 minutes of trading it has turned upwards again. I am following the algorithm with Western DIgital ($WDC (-13,98 %)), Lumentum ($LITE (-5,52 %)), Ciena ($CIEN (-1,45 %)), Kioxia ($285A (-7,92 %)) and Bloom Energy ($BE (-16,9 %)) at the start.
The initial value was approx. 22,700 euros. Of this, 60 euros were lost due to capital gains tax on the switch to Kioxia and there was a capital inflow of 1,300 euros. This capital inflow largely flowed outside the algorithm into 1 SanDisk share ($SNDK (-10,98 %)), as SanDisk is now one of the most valuable 100 companies in the world and has shown the most explosive momentum signals in the last 12 months, but is still stuck in the MSCI World Small Cap Index. To my surprise, this will remain the case for the coming quarter, which means that I will retain my "special position" for the time being. So it started at the beginning of May with 6 shares and 23,750 euros. And May flushed almost exactly +21% into the satellite portfolio.
+5,000 euros price gain - 21% up in 30 days 🚀
Who started and who performed how?
The overall increase is thus very strongly fueled by Western Digital. But Kioxia was the last and thus smallest position size to be added and has overtaken all other stocks with 71%. Ciena has done a stable job and Bloom Energy and Lumentum have stagnated somewhat without harming the portfolio too much. The special position in SanDisk improved the monthly average slightly. So we did everything right.
YTD the momentum performance is at an outstanding +122% TTWROR. 🤯😍
I hope to close above the 30k mark for June.
Here is a general summary of how the portfolio is made up before the stocks for June are published:
It consists of 3 pots:
Pot 1 selects the momentum stock from the MSCI World with the strongest momentum signal.
Pot 2 selects 4 stocks from the top 30% market capitalization (deciles 8 to 10) with the strongest momentum signal.
Pot 3 selects 3 stocks from deciles 7 to 9 with the strongest momentum signal.
It is to be expected that there will be duplications from the various pots. These are not overweighted, but kept simple. This means that there can be between 4 and 8 stocks in the portfolio.
How will the portfolio change in June?
It's nice to see that almost all stocks ended May on a positive note and even nicer to see that there will still be a change. This means that "from below" a stock has achieved stronger momentum than a stock that was held. In my view, this is the strategy's preferred behavior when it comes to switching.
Micron ($MU) (-6,43 %) is back, but Dell ($DELL (-3,5 %)) will also make it into the portfolio, displacing Ciena. According to the score, Western Digital would also be narrowly beaten by Intel ($INTC (-4,69 %)), but due to the 5% holding threshold there is no change. This means that Intel has once again narrowly missed out on the portfolio.
The composition for June follows:
Evaluation of the pots:
Pot 1
Kioxia wins by a wide margin ahead of Micron and Ibiden ($4062) (-6,14 %).
Pot 2
Kioxia
Micron
Dell
Western Digital
A hair's breadth ahead of Intel, Seagate ($STX (-12,87 %)) and Murata Manufacturing ($6981 (-6,06 %))
Pot 3
Absolute dominance of
Kioxia
Bloom Energy
Lumentum
ahead of Ciena and, among others, RocketLab ($RKLB (+0,2 %) ).
May the games continue.
Only 35X to the million 🥹

$VRT (-6,83 %)
$SNDK (-10,98 %)
$AMD (-2,79 %)
$STX (-12,87 %) all bought today.
$RET (+0,43 %)
$QTUM
$MSFT (+5,11 %) all sold on stop losses 5% gain and 10% on QTUM.
$NLY (+1,56 %) sold to go get some quick gains on memory after the oil prices come down.
Im expecting big gains on the portfolio after the oil prices correction. Let’s wait now.
Which ones are you invested in?
+107% Intel $INTC (-4,69 %)
+92% Credo Techn. $CRDO
+91% Astera Labs $ALAB (-2 %)
+73% MediaTek $2454
+72% AMD $AMD (-2,79 %)
+72% Seagate $STX (-12,87 %)
+71% SanDisk $SNDK (-10,98 %)
+67% KIOXIA $285A (-7,92 %)
+66% ON Semiconductor $ON (-17,77 %)
+61% STMicroelectronics $STM (-4,56 %)
+55% Marvell $MRVL (-5,65 %)
+51% NXP $NXPI (-8,82 %)
+49% Siltronic $WAF (-5,88 %)
+47% GLOBALFOUNDRIES $GFS (-8,24 %)
+47% SK Hynix $000660
+47% Micron $MU (-6,43 %)
+46% Infineon $IFX (-4,84 %)
+45% Western Digital $WDC (-13,98 %)
+43% Texas Instruments $TXN (-9,76 %)
+42% Arm Holdings $ARM (-5,22 %)
+41% QUALCOMM $QCOM (-7,82 %)
+41% Monolithic Power $MPWR (-5,79 %)
+40% Aixtron $AIXA (-1,91 %)
+40% Microchip Techn. $MCHP (-6,53 %)
+34% Broadcom $AVGO (-4,09 %)
+30% Skyworks $SWKS (-2,81 %)
+25% Samsung Electronics $005930
+24% Analog Devices $ADI (-7,74 %)
+18% TSMC $TSM (-1,11 %)
+16% Lam Research $LRCX (-6,2 %)
+14% KLA $KLAC (-4,68 %)
+13% NVIDIA $NVDA (-1,75 %)
+10% Applied Materials $AMAT (-5,73 %)
+9% ASML $ASML (-2,59 %)
I have AMD. Which one do you have?

$VZ (+0,47 %)
$DPZ (+3,55 %)
$CDNS (+1,64 %)
$BARC (-1,13 %)
$SPOT (+4,31 %)
$BP. (-1,65 %)
$SPGI (+3,17 %)
$KO (+2,21 %)
$UPS (-0,28 %)
$AIR (-1,63 %)
$SBUX (+0,84 %)
$ENPH (+0,07 %)
$NXPI (-8,82 %)
$STX (-12,87 %)
$BE (-16,9 %)
$V (+1,41 %)
$MDLZ (-1,34 %)
$HOOD (+4,8 %)
$MBG (-3,44 %)
$UBSG (-1,89 %)
$DBK (-2,32 %)
$LMND (+4,12 %)
$SOFI (+2,76 %)
$TER (-7,9 %)
$ADS (+1,65 %)
$ABBV (+3,93 %)
$G24 (+0,49 %)
$WM (+0,79 %)
$APH (-1,29 %)
$CMG (+3,45 %)
$GOOG (-1,85 %)
$META (+0,95 %)
$MSFT (+5,11 %)
$AMZN (+1,94 %)
$005930
$BAS (-1,12 %)
$SU (-1,79 %)
$INGA (-0,24 %)
$ULVR (+0,45 %)
$IDR (-1,47 %)
$DHL (-1,36 %)
$CAT (-5,41 %)
$MA (+1,47 %)
$PUM (+1,33 %)
$MRK (+2,14 %)
$CNHI (+0,83 %)
$LLY (+7,16 %)
$FSLR (-4,11 %)
$WDC (-13,98 %)
$RBLX (+1,96 %)
$RDDT (+5,05 %)
$SNDK (-10,98 %)
$AAPL (+2,41 %)
$TWLO (-0,73 %)
$EL (-1,68 %)
$CL (+0,96 %)
$XOM (-0,47 %)
$CVX (-0,84 %)
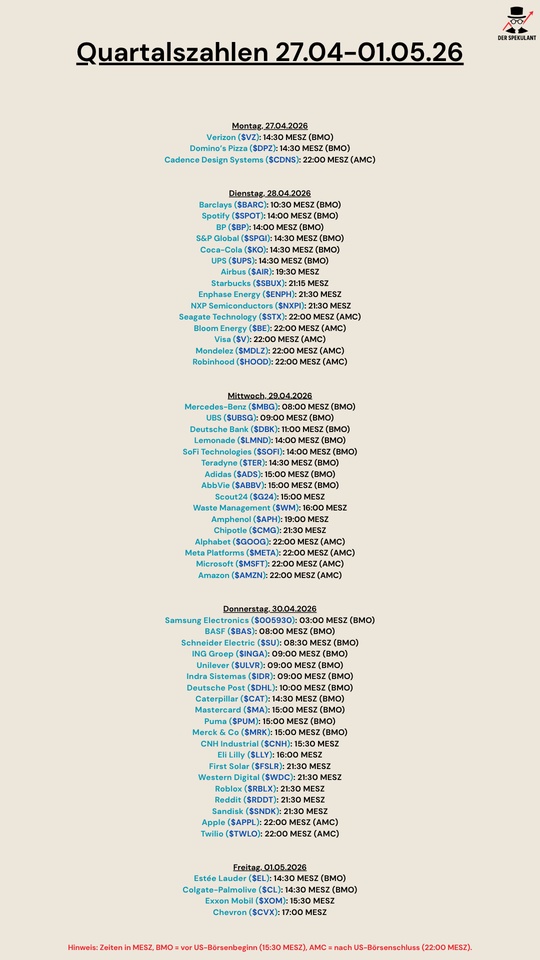

Good figures and, above all, a strong outlook caused the share price of $STX (-12,87 %) rose by almost 10% after the close of trading. It is now up 260% for the year.
Since around 80% of revenue comes from the sale of storage for data centers, this is probably a good sign for the industry as a whole.
A good start to the reporting season :-)
$RYA (-1,28 %)
$UNH (+2,19 %)
$GM (-0,97 %)
$RTX (+0,76 %)
$UPS (-0,28 %)
$UNP (-0,42 %)
$NOC (+0,48 %)
$BA (-0,52 %)
$MC (+0,18 %)
$TXN (-9,76 %)
$STX (-12,87 %)
$SSAB A (-2,85 %)
$ASML (-2,59 %)
$GEV (-3,5 %)
$SBUX (+0,84 %)
$T (+0,91 %)
$GD (+0,63 %)
$MSCI (+1,75 %)
$META (+0,95 %)
$NOW (+8,61 %)
$IBM (+4,55 %)
$LRCX (-6,2 %)
$TSLA (+0,55 %)
$MSFT (+5,11 %)
$000660
$005930
$SAP (+3,68 %)
$ABBN (-3,15 %)
$DBK (-2,32 %)
$ROG (+0,39 %)
$DOW (-0,31 %)
$NDAQ (+0,29 %)
$LMT (+0,6 %)
$CAT (-5,41 %)
$TMO (+1,3 %)
$HON (-0,39 %)
$MA (+1,47 %)
$BX (+0,6 %)
$WM (+0,79 %)
$WDC (-13,98 %)
$SNDK (-10,98 %)
$V (+1,41 %)
$AAPL (+2,41 %)
$SOFI (+2,76 %)
$CL (+0,96 %)
$AXP (-0,96 %)
$XOM (-0,47 %)
$CVX (-0,84 %)
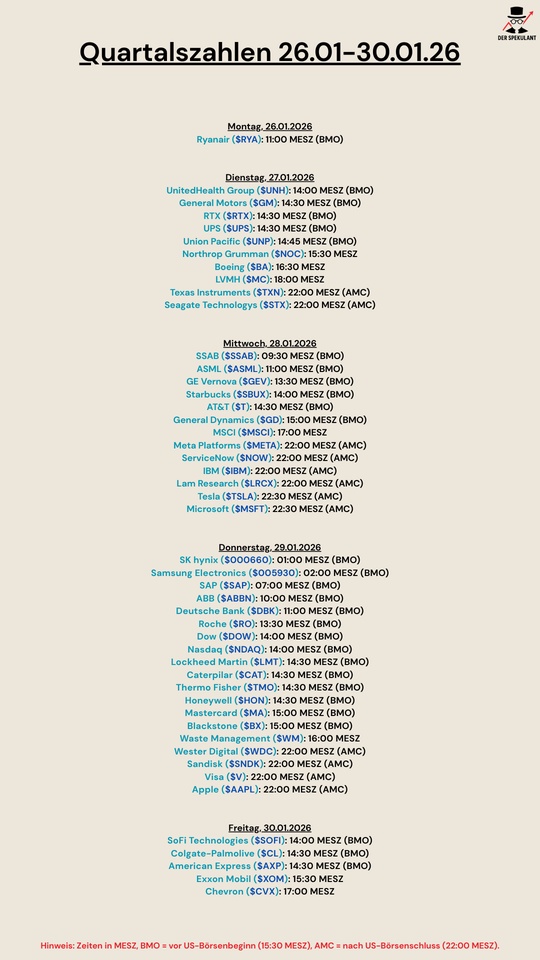

Frohes neues Jahr zusammen! 🎆 Pünktlich zum Jahresstart möchte ich mein Depot-Update für den Top 8 Aktienpool mit euch teilen und einen Ausblick auf 2026 geben.
Eines vorweg: Niemand weiß, ob 2026 ein Bullen- oder Bärenjahr wird. Predictions für einzelne Assets sind oft unseriös. Deshalb bleibe ich meinem regelbasierten Modell treu und präsentiere euch die aktuelle Top 10.
🔝 Meine Top 8 für die Vorauswahl 1. Halbjahr 2026:
Rank Aktie Sektor Momentum-Score
1 Western Digital ($WDC (-13,98 %) IT / Speicherlösungen 115,2 %
2 Warner Bros. Discovery ($WBD (-1,09 %) ) Kommunikation / Medien 103,8 %
3 Micron Technology ($MU (-6,43 %) ) IT / Halbleiter 103,2 %
4 Seagate Tech ($STX (-12,87 %) IT / Speicherlösungen 83,0 %
5 Albemarle ($ALB (-6,43 %) Chemie / Lithium 74,7 %
6 Teradyne ($TER (-7,9 %) IT / Halbleiter-Test 67,3 %
7 Newmont ($NEM (+0,72 %) ) Rohstoffe / Gold 66,4 %
8 AppLovin ($APP (+6,27 %) Software / AdTech 64,4 %
(Dicht gefolgt von $HOOD (+4,8 %)
und $LRCX (-6,2 %)
auf den Plätzen 9 & 10).
🔍 Ein paar Insights zum Modell:
Spannend ist dieses Mal die Sektoren-Gewichtung. Wir sehen ein starkes Klumpenrisiko (aber eben auch Momentum!) im Bereich Speichertechnologie und Halbleiter.
Interessant: Fast alle Titel haben ihre Performance erst im 2. Halbjahr 2025 generiert. Da mein Filter die jüngste Vergangenheit stärker gewichtet als die ältere, wurden diese Titel nach oben gespült. Das könnte ein Signal sein, dass der Trend hier weiterhin richtig Fahrt aufnimmt.
Und mit welchen beiden Aktien starten wir ins Jahr 2026?
Es sind weiterhin $MU (-6,43 %) und $WDC (-13,98 %) da diese im Ranking innerhalb des Aktienpools mit relativ großem Abstand auf Platz 3 und 4, die beiden Leader sind.
Dies bedeutet dass erstmal kein Handeln erforderlich ist und erst Ende Januar der nächste Check erfolgt.
🎯 Mein Ziel für 2026: Die 50.000 € Marke
Ich starte mit einem Kapital von 31.000 €. Zur Motivation habe ich meine Hochrechnungen basierend auf verschiedenen Rendite-Szenarien erstellt:
Mein persönliches Ziel für Ende 2026 ist ein Depotwert von ca. 50.000 €. Das erfordert eine Performance von rund 60 %. Sportlich? Ja. Unmöglich mit Momentum? Nein.
Wie ist eure Einschätzung?
Gerade bei den Speicherwerten ($WDC (-13,98 %) , $MU (-6,43 %) , $STX (-12,87 %) scheiden sich oft die Geister. Seht ihr den Sektor 2026 weiterhin als Leader oder ist die Luft hier bald raus? 💬
Ich wünsche euch allen ein erfolgreiches Börsenjahr und vor allem Gesundheit! 🍀
Vorwort
Ich weiß, was ihr denkt. Ist es schon wieder Zeit für Finance Porn? Solche Zahlen sieht man normalerweise nur in dubiosen Youtube Videos,, WhatsApp- oder Telegramm Gruppen. Aber hinter dieser theoretischen Performance steckt kein „Zaubertrick“, sondern ein knallhartes, quantitatives Regelwerk. Ihr werdet weiter unten nicht nur die historischen Backtest Renditen sehen, sondern ich zeige euch selbstverständlich auch die echten Renditen, die seit Beginn des Projektes erzielt wurden. Entscheidet am Ende selbst, wie realistisch und wie hoch die durchschnittliche jährliche Rendite sein kann.
Einleitung
Viele Privatanleger investieren nach Bauchgefühl, News-Schlagzeilen oder „Hot Tips“. Ich habe mich entschieden, den Lärm auszuschalten und auf die nackten Zahlen zu vertrauen. Nach monatlicher Entwicklungsarbeit und intensiven Backtests präsentiere ich euch heute die Logik meines S&P 500 Hybrid-Momentum-Modells.
Mein Ziel: Euch zu motivieren, Momentum nicht als „Zocken“, sondern als quantitative Ingenieursleistung zu verstehen und natürlich so nah wie möglich an die Renditen des Backtests heranzukommen.
🔍 Der Ursprung: Vom ETF zum Einzelwert
Angefangen hat alles mit klassischen Momentum-ETFs und Strategien wie GTAA (Global Tactical Asset Allocation). Doch ich wollte wissen: Lässt sich dieses Prinzip auf Einzelaktien übertragen, um den Markt deutlich zu schlagen? Nach hunderten Backtests, der Analyse verschiedener Universen (SPY, QQQ) und Sektoren, steht nun mein Regelwerk.
💡 Die Grundidee: „Buy high, sell higher“
Gewinner“ laufen statistisch gesehen weiter, währen „Verlierer“ weiter fallen – Der Kauf am ATH ist historisch gesehen profitabler, als der Kauf am ATL.
Während Value-Investoren nach dem Motto „Buy low, sell high“ agieren, nutzt Momentum die statistische Tendenz: Gewinner laufen weiter.
🧩 Das Konzept: Ein selektives Kraftpaket
Mein Ansatz ist ein rein quantitatives Regelwerk, das die stärksten Trends im S&P 500 isoliert:
Das Universum: Fokus auf die 500 liquidesten US-Large-Caps (S&P 500).
Die Selektion: Ein Pool aus 8 Aktien wird durch ein zeitgewichtetes Momentum-Scoring gefiltert. Neuere Kursentwicklungen (letzte 6 Monate) wiegen schwerer, um Trendwenden frühzeitig zu erfassen.
Die Anker: Öl & Krypto-Proxys fließen als strategische Gegengewichte ein, um in spezifischen Zyklen (Inflation/Risk-On) zusätzliche Performance zu generieren.
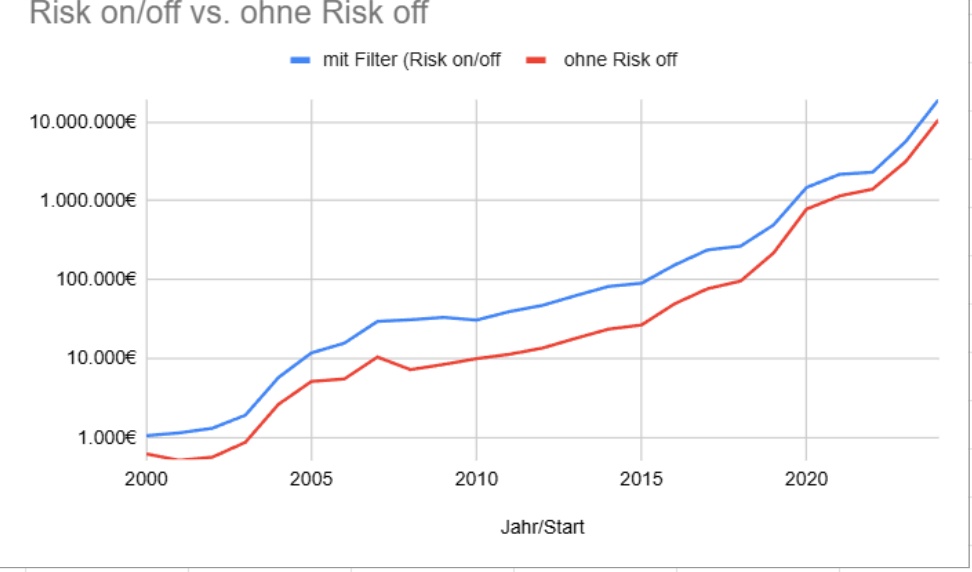
Der Sicherheitsgurt (Absolutes Momentum): Um massive Drawdowns wie 2000 oder 2008 zu vermeiden, fungiert der S&P 500 Index als Markt-Filter. Liegt das Signal im Minus, wechselt das Modell konsequent in Cash bzw. Geldmarkt-ETFs.
⚙️ Die Execution: Konzentration auf die Leader
Jeden Monat findet eine Überprüfung statt. Nur die Top 2 Assets mit dem höchsten Durchschnitts-Score werden gehalten.
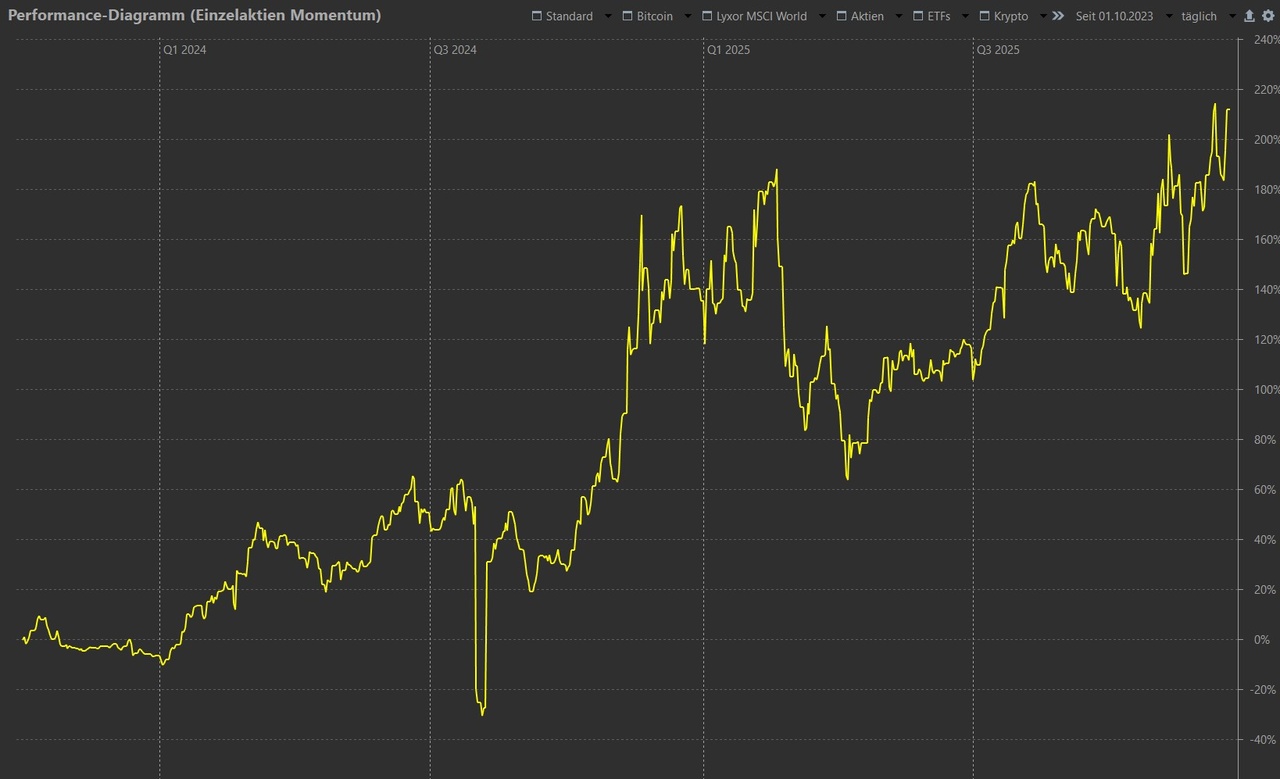
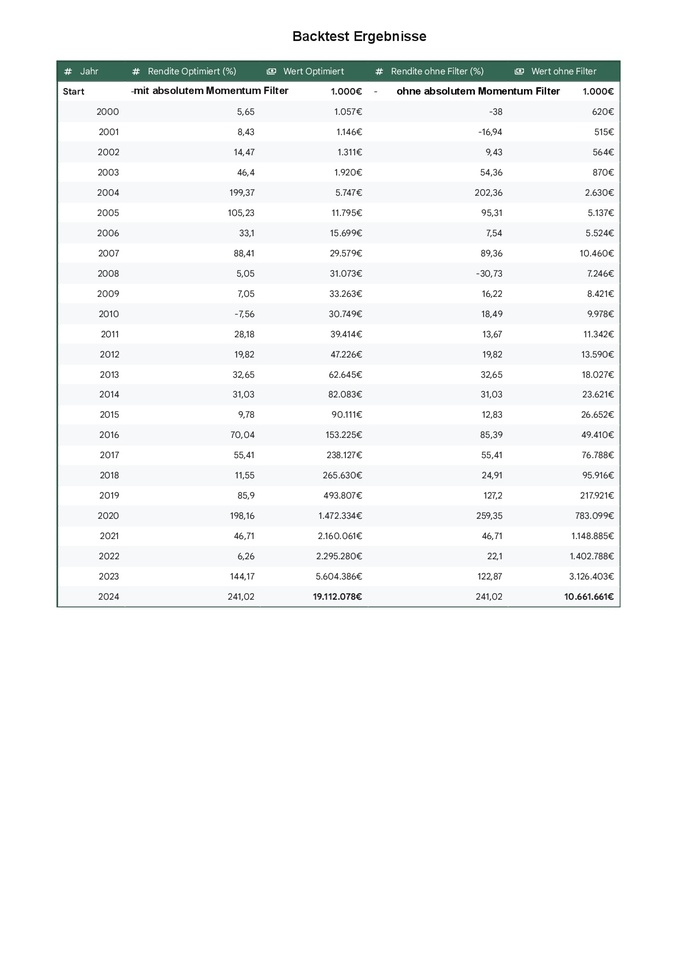
📊 Performance & Live-Ergebnisse
Die theoretischen Daten (2000–2024) zeigen eine beeindruckende CAGR von 56 %. Seit Ende 2023 setze ich das Modell aktiv um – mit ca. 80 % meines Gesamtdepots aus voller Überzeugung:
Renditen
⚠️ Transparenz zu Risiko & Volatilität
Hohe Renditechancen fordern eiserne Disziplin. Die Strategie ist nichts für schwache Nerven:
Fazit
Ich werde hier regelmäßig Updates geben, wie das Modell die aktuelle Phase einschätzt. Dieser Weg ist nicht der einzige, um erfolgreich zu sein – aber er ist mein systematischer Weg.
Werdet zum Engineer eures eigenen Portfolios. Testet, optimiert und bleibt diszipliniert.
Habt ihr Fragen zur Thema oder sonstiges ? Schreibt es mir in die Kommentare! 👇
#Momentum
#Investing
#SP500
#SystematicTrading
#Finanzen
#TradingStrategy
#Backtest
#Wealth
Risikohinweis: Keine Anlageberatung. Historische Kurse garantieren keine zukünftigen Gewinne. Jedes Investment kann zum Totalverlust führen.
PS: Die Strategie kann man sich jetzt auch als wikifolio ansehen/vormerken:
Meilleurs créateurs cette semaine


