
Hello to Community✌️
At the end of the month, I would like to introduce you to another stock that I personally find extremely exciting. After that, that's it for the next few weeks. 👀
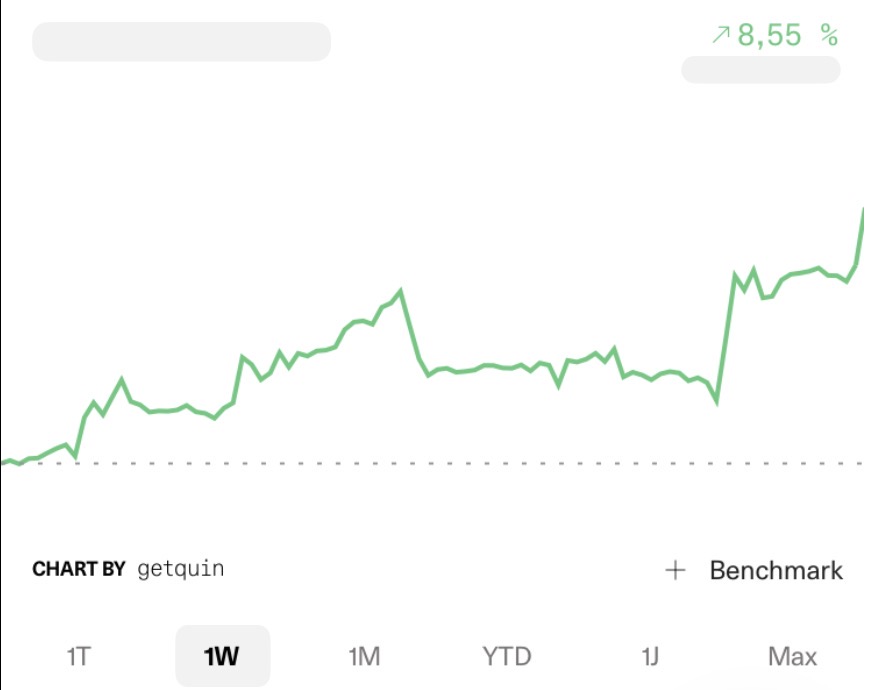
In my opinion, this stock is interesting for both short-term gamblers and long-term investors. The former 🫵 @Multibagger will primarily celebrate the momentum and the potentially rapid price movements. 📈
Others could discover an exciting growth story with long-term potential. 👀🤔
Today it's all about Boku $BOKU
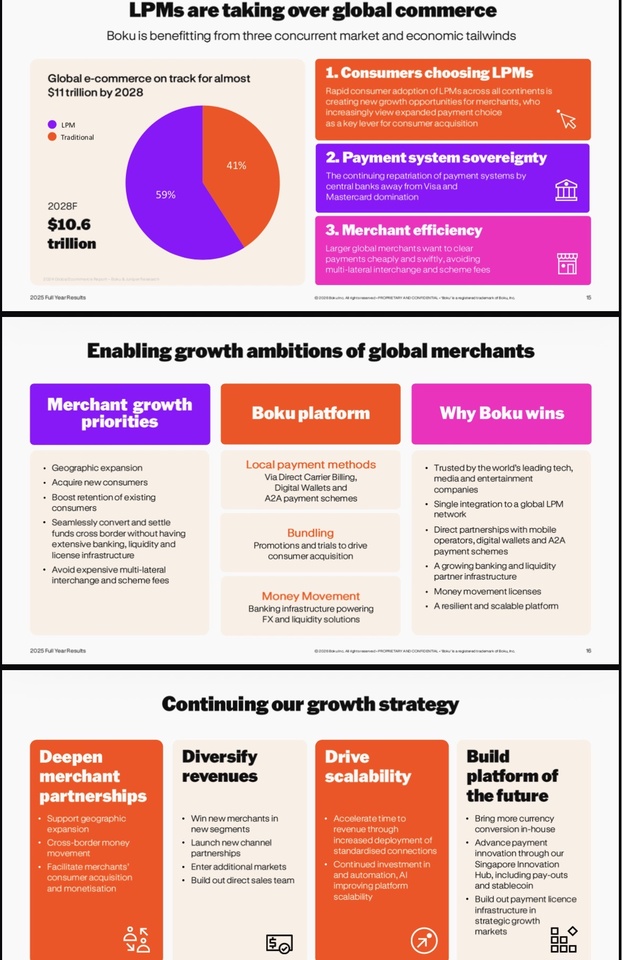
BOKU INC. : The invisible tollbooth of the global tech giants:
Boku $BOKU is not a hyped, unprofitable FinTech dream that thrives on venture capital. It's a highly profitable, UK-based network powerhouse that's carving out the niche of Alternative Payment Methods (APMs) has occupied. While traditional credit card giants are reaching their limits in emerging markets and with Generation Z, Boku $BOKU acts as the invisible digital toll booth for the world's biggest companies. If someone is on Spotify, $SPOT (+1,89 %) Netflix $NFLX (+1,2 %) or the $GOOGL (-2,66 %) Google Play Store via cell phone bill (direct carrier billing) or local eWallet (such as Pix, Mercado Pago $MELI (-2,05 %) , Alipay $9988 (-2,06 %) or GrabPay $GRAB (-4,08 %) ), Boku mercilessly cuts off its fee in the background. Boku $BOKU benefits from the unstoppable global trend of digital consumption - regardless of which app is currently in vogue.
📱The business model: the 3-pillar transaction rocket 💳🌐📈
Boku $BOKU has transformed itself from a pure SMS payment service into a state-of-the-art, global identity and payment network (Boku Platform):
The insatiable eWallet & Account-to-Account (A2A) lever: Traditional business mobile operators (DCB) is solid, but the real hyper growth is coming from local wallets (Pix in Brazil, PromptPay in Thailand, Twint in Switzerland). Boku connects these fragmented local markets via a single API for the tech giants. This segment is growing rapidly and driving up transaction value (TPV) massively.
The fortress customer base (The "Whale" portfolio): Boku's client list reads like a who's-who of Silicon Valley: Apple $AAPL (+0,5 %)
, Google $GOOGL (-2,66 %)
, Meta $META (-2,93 %)
, Microsoft $MSFT (-1,59 %)
, Netflix $NFLX (+1,2 %)
, Spotify $SPOT (+1,89 %)
, Amazon $AMZN (-1,05 %)
, Tencent $700 (-3,05 %) . These giants won't just throw Boku out of their checkout infrastructure because setting up their own local connections in 60+ countries would be regulatory and technical suicide. High switching costs par excellence.
The recurring network effect premium (NRR 124%): Boku grows organically with the success of its customers. The more subscriptions $AMZN (-1,05 %) Amazon Prime or Spotify $SPOT (+1,89 %) sell in India or Southeast Asia, the more transaction volume automatically flows through Boku's servers - without Boku having to burn new marketing money.
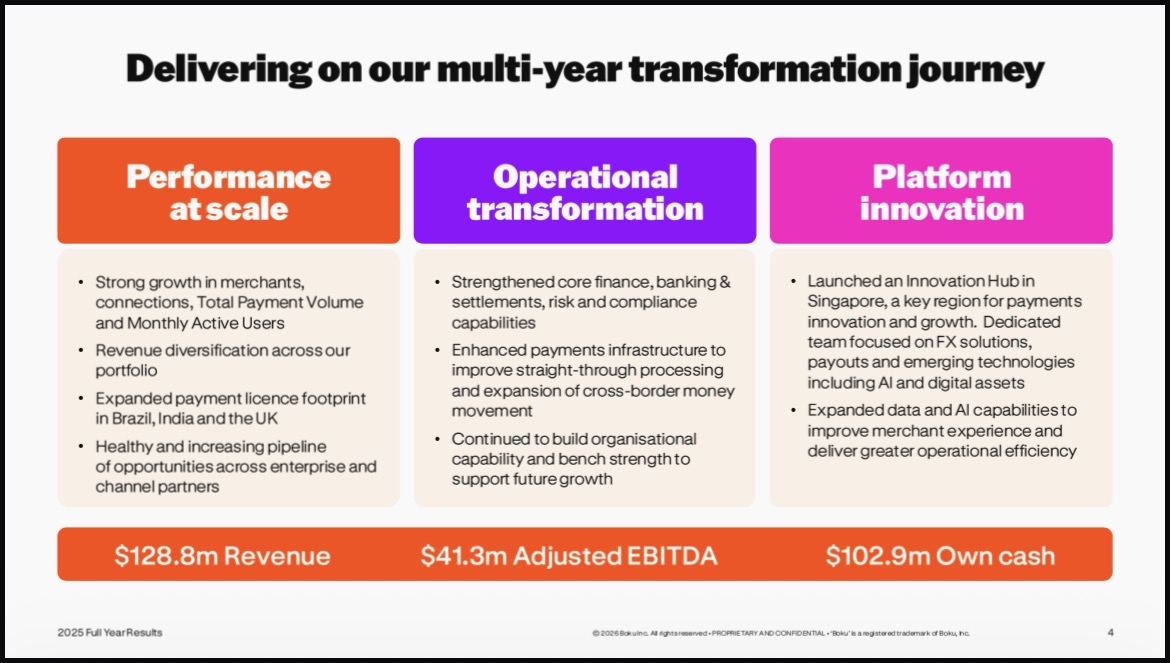
📊The key figures (as of Q1 2026 / FY25 history)
Market capitalization: Approx. GBP 540 million / ~EUR 635 million (Listed on the London Stock Exchange, AIM). A genuine, profitable small cap.
Sales momentum: Continuous growth of around +15% p.a. The shift from pure mobile billing to eWallets and A2A payments is taking off completely and is compensating for the maturity of the old DCB business.
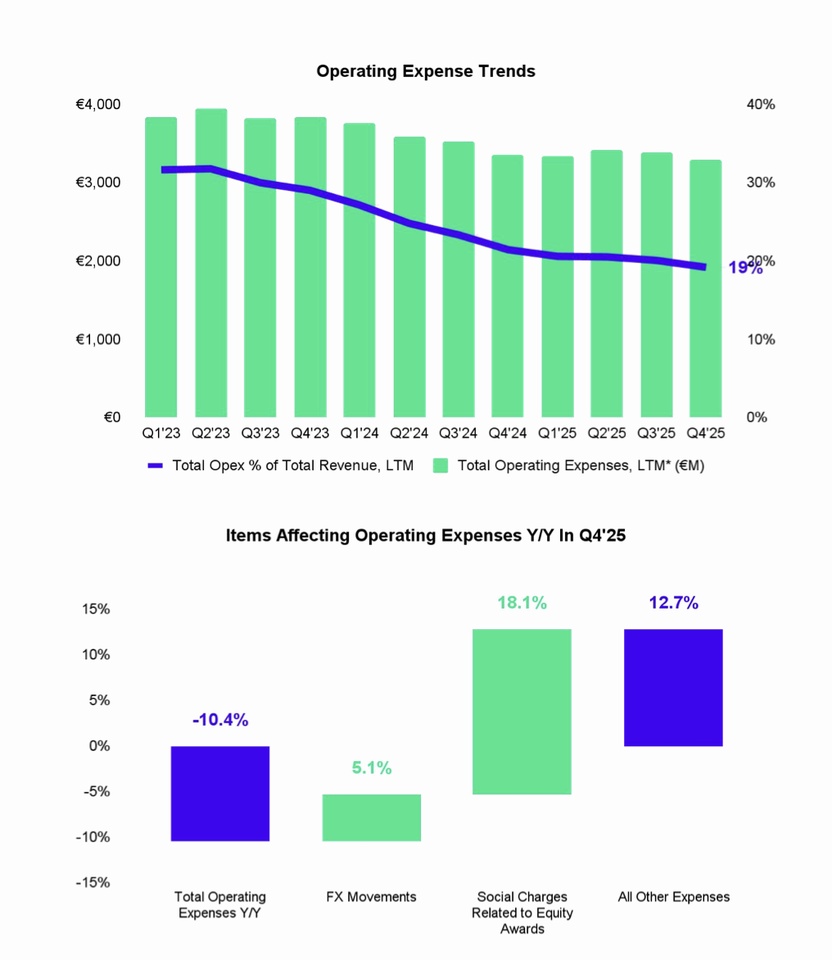
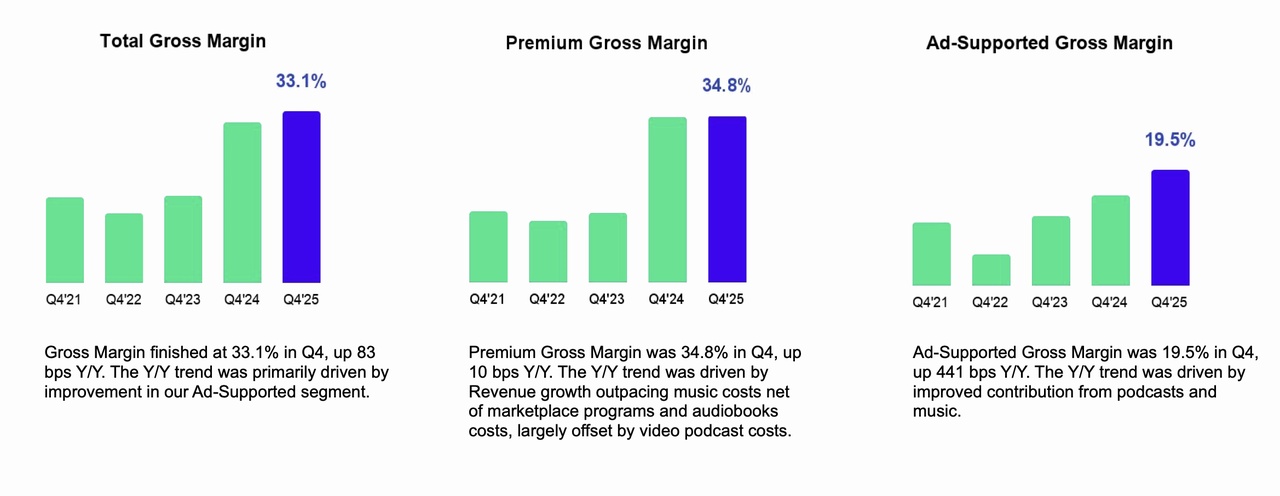
EBITDA levers & margins: The adjusted EBITDA margin is scratching the 35% mark. As the platform infrastructure is in place, almost every additional dollar in transaction fees flows directly through to the bottom line (Gross margin of a proud ~68.5%).
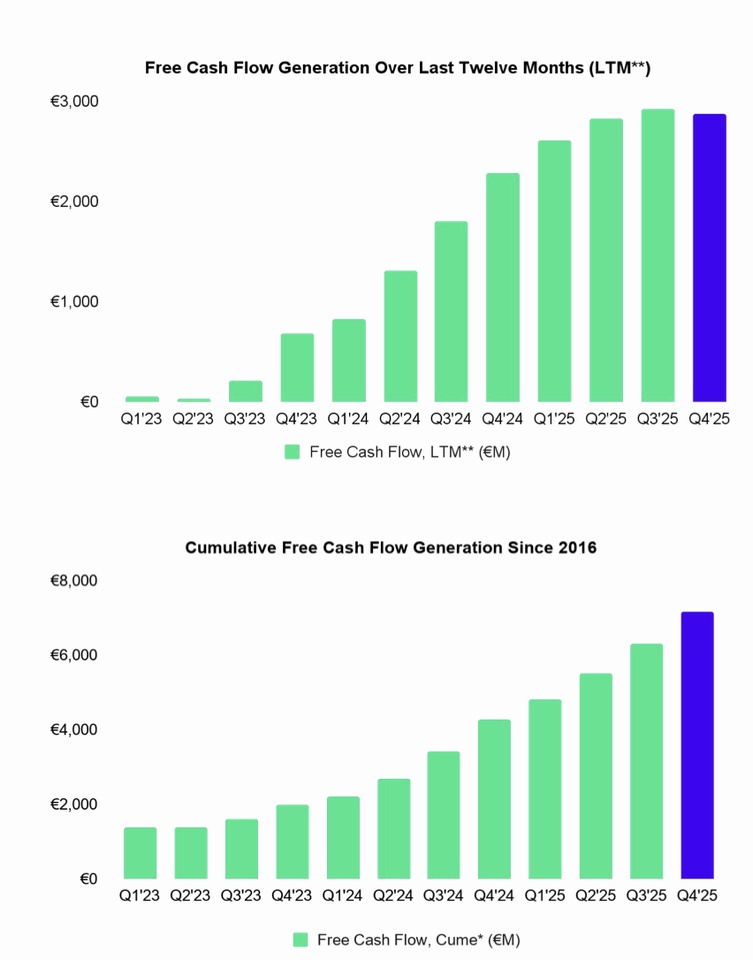
Real FCF margin (SBC-adjusted): Strong ~24,0% of sales. Boku is a cash machine that easily digests its share compensation from operating cash flow without painfully diluting shareholders.
Balance sheet solidity (net cash): No long-term financial debt. Boku is sitting on a net cash position of around USD 50-60 million. This means zero refinancing risk in the current interest rate environment and maximum flexibility for smaller, strategic tech acquisitions.
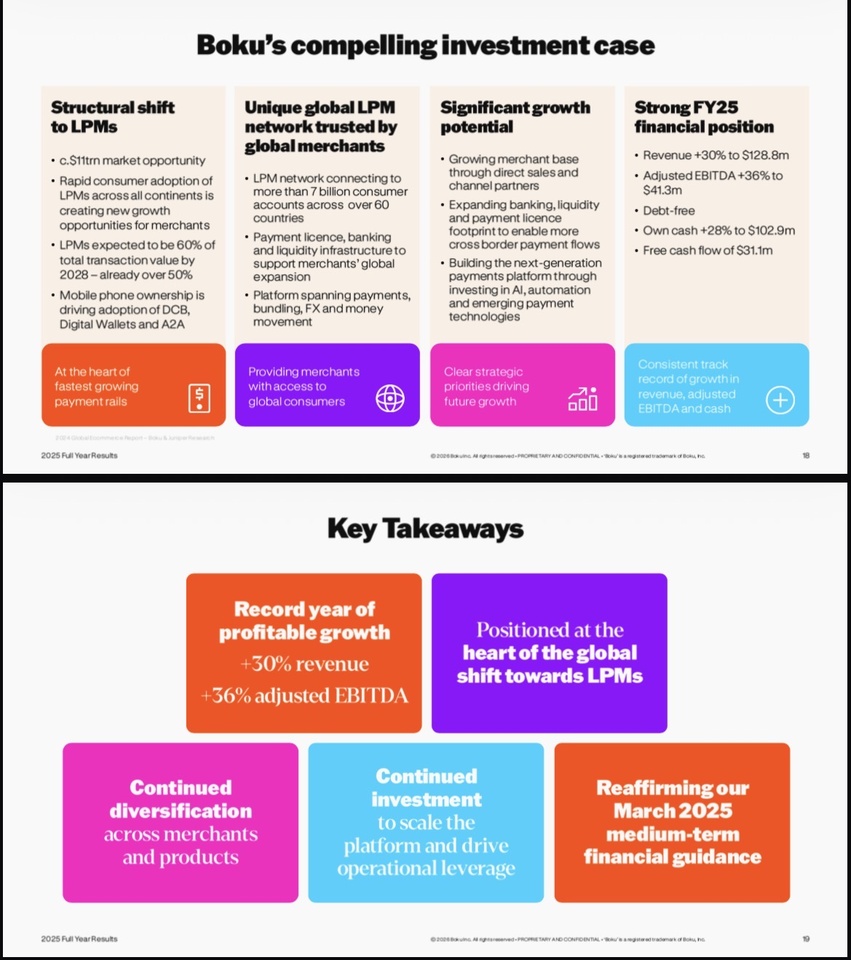
🚀Why is the share exciting?
✅The demographic bet in e-commerce: In the growth regions (South East Asia, Latin America, Africa), billions of people don't have a credit card, but almost everyone has a smartphone and a local wallet. If you want to sell subscriptions there as a Western tech company, you have to use Boku.
✅The win-win shield against big tech: The often criticized cluster risk is not a one-way street. In markets such as Indonesia, Brazil and India, Boku is $BOKU for Apple $AAPL (+0,5 %) and Google $GOOGL (-2,66 %) not an annoying cost factor, but the exclusive revenue enabler. Without Boku's local infrastructure, the tech giants would have to do without millions of customers who are willing to pay and simply do not have a credit card. Apple $AAPL (+0,5 %) and Google $GOOGL (-2,66 %) are therefore structural partners 🤝not opponents - Boku brings them incremental revenue that they could not generate on their own.
✅Evolution of the moat & diversification: Management understood the historical "what if" scenario (the loss of a major customer) and proactively mitigated the risk. Through aggressive expansion into digital wallets and account-to-account (A2A) payments (which now account for 45% of revenue), Boku has fundamentally diversified. The moat today is of a technical, regulatory and geographical nature - not even a Silicon Valley giant can copy that in two quarters.
✅Operating leverage beats inflation: Boku's cost base consists primarily of IT infrastructure and developers. If the price of digital subscriptions rises worldwide due to inflation, Boku's transaction volume and thus its fee income automatically increases with it. A perfect inflation hedge.
✅Consolidation of the FinTech infrastructure: Boku $BOKU has spent years digging the regulatory foundation (licenses in dozens of countries). You don't rebuild this moat in two quarters. This also makes the company a permanent, highly attractive takeover target for larger payment groups.
⚠️Die Risks
❗️Brutal cluster risks (whale dependency): Apple $AAPL (+0,5 %) , Google $GOOGL (-2,66 %) and Amazon $AMZN (-1,05 %) account for a lion's share of the volume. If one of these giants decides to slash fees or build its own global wallet infrastructure, the Boku story will be fundamentally shaken
❗️Commercial pressure on margins: Unit economics for eWallets are often thinner than for the old Direct Carrier Billing (DCB). Boku has to bolt on massive volumes to cushion the structural decline in margins per transaction
❗️Currency effects (FX risk): As Boku collects fees worldwide in local currencies (and accounts in GBP), severe currency turbulence in the emerging markets can visually spoil operating performance .
✍️Mein personal conclusion + Reaper verdict 💀
I personally find Boku Inc. extremely exciting. Boku $BOKU has an amazingly strong business in the background. For me, this is a highly profitable niche champion with a strong balance sheet and a business model that is much more robust than it appears at first glance.
What I particularly like is that without Boku $BOKU companies like Google $GOOGL (-2,66 %) or Apple $AAPL (+0,5 %) would miss out on millions of potential customers that they would not be able to reach via their traditional payment channels. Boku $BOKU opens up sales for them that would otherwise simply not exist. Why should the tech giants invest hundreds of millions of dollars to apply for their own regulatory licenses in dozens of emerging countries and connect local payment systems when they can simply use Boku's ready-made infrastructure instead? Boku $BOKU solves a complex problem that its customers could only solve themselves with considerable effort and is paid well for doing so. This also seems to me to limit the risk of major customers suddenly ending the collaboration. The benefit is simply too great and the alternative too costly.
BONUS MATERIAL:
💀Jack's Verdict:
"Let's not kid ourselves: Boku's operating business is sexy as a perfectly oiled money printing press. The NRR of 124% shows that the tech giants are becoming more and more dependent on Boku's API. But on the stock market, the music is also made by the price. A fwd P/E ratio of over 31x and a PEG of 1.7 for 15% growth? Once again, the market has looked a little too deeply into the hype bowl. The market is currently pricing in that the next 10 years will be flawless. If Apple coughs tomorrow and pushes down the fees by one basis point, the valuation will plummet. Therefore: stock on the watchlist, no emotional market purchases. We are laying down at 135 GBX on the lookout. If the impatient retail investors lose their nerve at the next macroeconomic dip and the stock corrects there, we will grab it. Before that, the capital stays in the holster."
Reaper rating: WATCH, TEND TO BUY 🔥
Reaper Score:
6,8/10
@Get_Rich_or_Die_Tryin
@Tenbagger2024
@Raketentoni
@schlimmschlimm
@Stocktective and of course all other ✌️