
Anthropic gave back about 13% from its opening trade, with employees allowed to sell 10% of their shares on day one. Alphabet and Amazon, both investors, rose before the bell.

Amazon
Action
Action
Ticker: AMZN
AMZN
Price
Discussion sur AMZN
Postes
1 139
3J·
Amazon Stock Forecast & Price Targets for 2027: Analysts Predict $328—Are They Right?
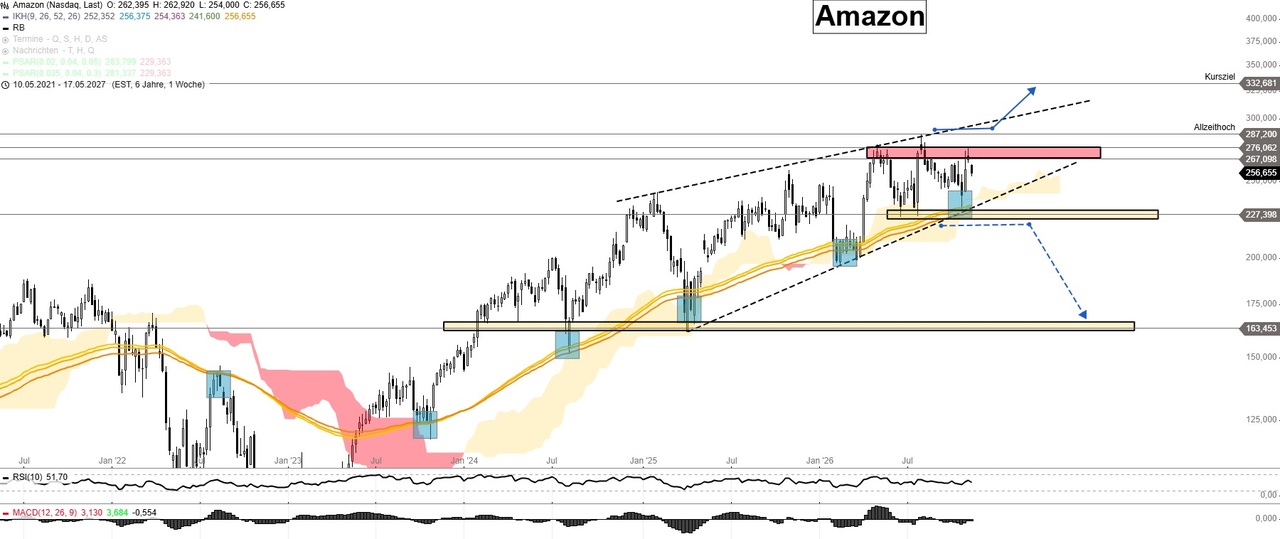
Amazon is earning more than ever before: In the third quarter of 2026, revenue rose 12% to $201.9 billion, and operating income jumped 61% to $28.1 billion—the operating margin of 13.9% is a record. The driving force is the AWS cloud division, which, at 39%, is growing faster than it has in years and now generates annual revenue of $184 billion. The cost of this growth: approximately $220 billion in investments in data centers, AI chips, and satellites in 2026 alone; free cash flow for the past twelve months is deeply negative at −$42.4 billion. As a result, the stock has been fluctuating for months within a wide trading range between $227.40 and $276 and is currently trading at $256.51 (Nasdaq, Nov. 17, 2026), about 11% below its all-time high of $287.20. Only a breakout above the record high would make the price target of $332.68 likely; a break below $227.40, on the other hand, would trigger a massive pullback to $163.45. Analysts’ average target is $328.54.
Key Points
- Q3 2026: Revenue $201.9 billion (+12%), operating income $28.1 billion (+61%), margin 13.9%
- AWS: Revenue of $46.0 billion (+39%), operating profit of $17.8 billion, annualized revenue of $184 billion
- Earnings per share of $1.89, slightly below the expected $1.96
- Q4 Outlook: Revenue of $240 billion to $247 billion, operating income of $28.5 billion to $33.5 billion
- Investments in 2026: approximately $220 billion; free cash flow (12 months): −$42.4 billion
- No dividend—Amazon is investing every dollar in growth
- Analysts: Average price target $328.54, range $250 to $390
- Chart levels: Trading range $227.40 to $276, all-time high $287.20, price target $332.68, downside risk to $163.45
What are Amazon’s current key metrics?
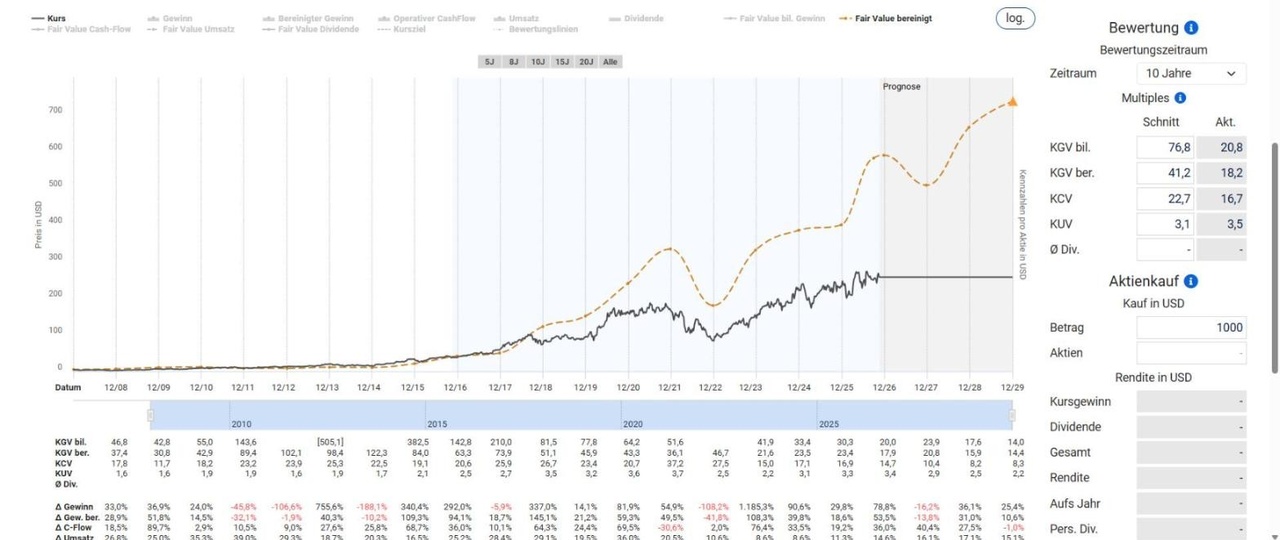
With a market capitalization of approximately $2.77 trillion, Amazon is one of the world’s most valuable companies, and according to Aktienfinder, its adjusted P/E ratio of around 18 makes it one of the most attractively valued stocks in recent memory: On average over the past ten years, investors have paid 41 times earnings.
In terms of operating cash flow, the price-to-cash-flow ratio of 16.7 is also below the ten-year average of 22.7. In terms of revenue, however, the stock is slightly more expensive than average (3.1), trading at 3.5 times revenue. Amazon does not pay a dividend.
- Price (Nasdaq: AMZN): $256.51 (Nov. 17, 2026)
- All-time high = 52-week high: $287.20 (August 2026)
- 52-week low: $196.00 (February 2026)
- Year-to-date performance: approximately +10% (November 17, 2026)
- Market capitalization: approx. $2.77 trillion (November 17, 2026)
- Revenue for Q3 2026: $201.9 billion (+12%) (October 29, 2026)
- Operating income for Q3 2026: $28.1 billion (+61%, margin 13.9%) (October 29, 2026)
- AWS revenue for Q3 2026: $46.0 billion (+39%) (October 29, 2026)
- AWS operating profit for Q3 2026: $17.8 billion (Oct. 29, 2026)
- North America Q3 2026: $112.9 billion (+6%), operating profit $8.7 billion (Oct. 29, 2026)
- International Q3 2026: $43.1 billion, operating profit $1.6 billion (Oct. 29, 2026)
- Earnings per share Q3 2026: $1.89 (expected approx. $1.96) (Oct. 29, 2026)
- Free Cash Flow (12 months): −$42.4 billion (September 30, 2026)
- Capital expenditures for 2026 (planned): approximately $220 billion (Oct. 29, 2026)
- Adjusted P/E ratio (current / 10-year average): 18.2 / 41.2 (Aktienfinder, Nov. 17, 2026)
- Current P/B ratio / 10-year average: 16.7 / 22.7 (Aktienfinder, Nov. 17, 2026)
- Current P/S ratio / 10-year average: 3.5 / 3.1 (Aktienfinder, November 17, 2026)
- Average Analyst Price Target: $328.54 (+28%) (FMP Consensus, November 17, 2026)
- Q4 2026 Outlook: Revenue $240–247 billion, operating income $28.5–33.5 billion (Oct. 29, 2026)
- Dividend: none (—)
- Next Date: Q4 earnings expected in early February 2027 (not yet confirmed)
- Index: Nasdaq 100, S&P 500, Dow Jones (—)
- WKN / ISIN / Ticker: 906866 / US0231351067 / AMZN (—)
What news is currently driving Amazon stock?
Amazon stock is currently driven primarily by the question of whether the massive investments of around $220 billion in AI data centers and satellites are paying off—the Q3 results on October 29 provided the strongest evidence to date, with AWS growing at a rate not seen in years.
Nevertheless, the stock subsequently faltered again at the resistance zone between $267 and $276 because earnings per share were slightly below expectations and free cash flow remains deeply in the red. On top of that, the Amazon Leo satellite project suffered a setback on November 15: a Vulcan rocket carrying 40 satellites failed. My analysis of the SpaceX Aktie.
- November 15, 2026 – False Start for Amazon Leo: A Vulcan rocket carrying 40 Amazon Leo satellites fails—the first of 38 scheduled Vulcan launches. Next launch planned for November 23 with Ariane 6 and 36 satellites. (Bearish)
- November 3, 2026 – Price Targets After Q3: Phillip Securities (Buy, $330) and Freedom Capital (Buy, $330); Morgan Stanley, Wells Fargo, UBS, RBC, TD Cowen, Mizuho, and Cantor reaffirm their buy recommendations on October 30. (Bullish)
- October 29, 2026 – Q3: AWS +39%, record margin: Revenue of $201.9 billion (+12%), operating income of $28.1 billion (+61%), margin of 13.9%. Earnings per share of $1.89, slightly below expectations. (Bullish)
- October 29, 2026 – Investments continue to rise: Approximately $220 billion in investments in 2026; free cash flow for the last twelve months: −$42.4 billion. (Bearish)
- October 20, 2026 – €16 billion for Germany: Amazon plans to invest more than €16 billion in Germany by 2027, including €4.8 billion in the AWS Frankfurt region. (Neutral)
What does Amazon’s management say about the Q3 figures?
Amazon CEO Andy Jassy sees AI demand as a growth driver: AWS growth continues to accelerate, demand for Amazon’s own AI chips is growing strongly, and AWS management expects growth rates of over 40% for 2027 and 2028.
That’s why Amazon is investing more aggressively than ever in data centers and power infrastructure.
What went well: AWS increased revenue by 39% to $46.0 billion and generated an operating profit of $17.8 billion—more than half of the company’s total net income. Retail is also becoming more profitable: North America generated $8.7 billion in operating profit on $112.9 billion in revenue, while the international business generated $1.6 billion. The consolidated operating margin reached a record 13.9%.
The catch: Earnings per share came in at $1.89, slightly below the expected $1.96. Above all, investments of approximately $220 billion in 2026 will consume the entire operating cash flow; free cash flow for the past twelve months stands at −$42.4 billion. Added to this are high startup costs for the Amazon Leo satellite internet service.
Outlook: For the holiday quarter, Amazon expects revenue of $240 billion to $247 billion and operating income of $28.5 billion to $33.5 billion. Fourth-quarter results are expected in early February 2027.
What does Amazon do, and how does the company make money?
Amazon is the largest online retailer in the Western world and, with Amazon Web Services (AWS), also the largest cloud provider—today, the Seattle-based company earns the majority of its profits not from package deliveries, but from providing computing power to other companies.
Amazon was founded in 1994 by Jeff Bezos; Andy Jassy has led the company since 2021.
Three segments: North America (USD 112.9 billion in revenue in the third quarter of 2026) and International (USD 43.1 billion) encompass online retail of the company’s own products, commissions and logistics fees from marketplace sellers, the Prime subscription with Prime Video, advertising, and groceries. AWS (USD 46.0 billion) provides computing power, storage, and AI services—with an operating margin of nearly 39%, it is by far the most profitable segment.
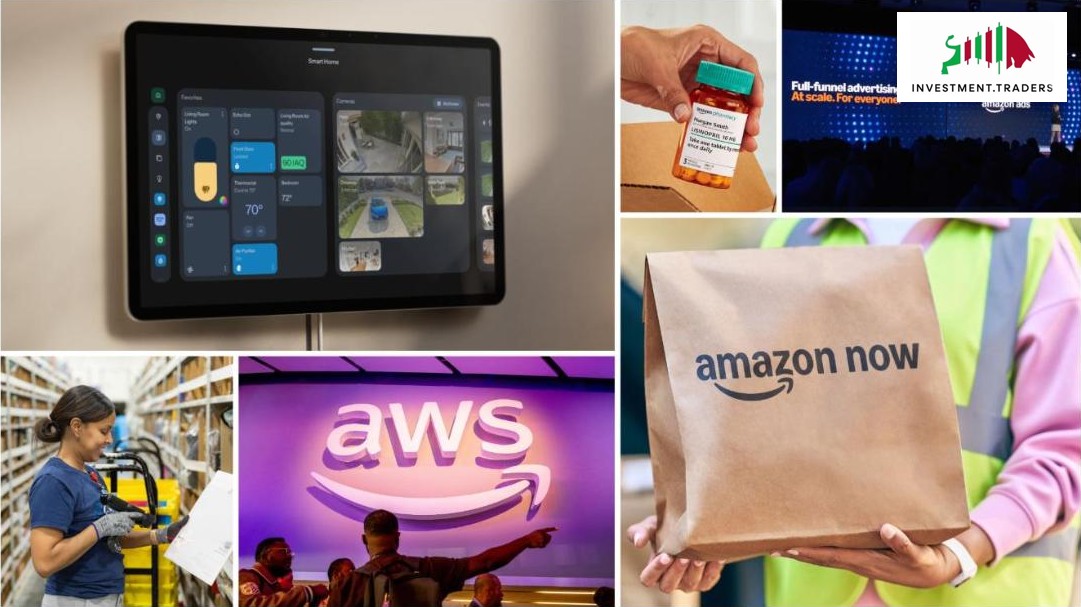
How Amazon Makes Money: Retail generates revenue, while AWS and advertising generate profit. New growth areas include the company’s own AI chips, the online pharmacy, the Amazon Now express delivery service, and the Amazon Leo satellite internet service, which is intended to compete with Starlink. My analysis of Zalando Aktie.
Highlights of Amazon Stock (AMZN) in the Third Quarter of 2026: Devices, Pharmacy, Advertising, AWS, Logistics, and Amazon Now (as of November 17, 2026) – Source: Amazon Investor Relations / Christian Lill
Amazon Stock Fundamental Analysis: Is Amazon Stock Undervalued Right Now?
Fundamentally, Amazon stock is cheap relative to its own history: According to Aktienfinder, the adjusted P/E ratio is around 18, compared to a ten-year average of 41—the discount reflects concerns that record-high investments will depress returns.
The key question is whether AWS will recoup the invested capital in the coming years.
Growth: Consolidated revenue grew by 12% in the third quarter of 2026, while AWS revenue surged by 39%. Amazon is projecting revenue of $240 billion to $247 billion for the fourth quarter. This puts the company on track for annual revenue well above $800 billion in 2026.
Margins: The operating margin rose to a record 13.9%. The drivers are AWS, with a margin of nearly 39%, highly profitable advertising, and more efficient logistics. The international business remains the weak spot, with $1.6 billion in operating profit on $43.1 billion in revenue.
Cash Flow and Investments: This is where the problem lies. Approximately $220 billion in investments in 2026 significantly exceed operating cash flow; free cash flow for the last twelve months stands at −$42.4 billion. A large portion is flowing into AI data centers and in-house chips—precisely the market in which Nvidia is the leading supplier, as my analysis Nvidia Aktie shows.
Valuation: The price-to-cash-flow ratio of 16.7 is below the ten-year average of 22.7, while the price-to-earnings ratio of 3.5 is slightly above it. Based on adjusted earnings and the average P/E ratio over the past ten years, the Stock Finder calculates a fair value of approximately $507 as of the end of 2027. However, this figure is heavily skewed because, in the years leading up to 2021, investors paid as much as 80 to 100 times earnings in some cases. A more meaningful figure: Even a P/E ratio of 25 based on the earnings expected for 2027 would result in a share price above the current level—provided the investments pay off.
Fair Value Valuation of Amazon Stock (AMZN) for 2027 (as of November 17, 2026) – Source: Aktienfinder / Christian Lill
Amazon Stock Price Targets and Forecast for 2027
Analysts see an average price target of $328.54 for Amazon stock, representing about 28% upside potential—though from a technical analysis perspective, the price target of $332.68 is only likely to be reached after a breakout above the all-time high of $287.20.
Until then, the stock will fluctuate within a trading range between $227.40 and $276. If the lower boundary is breached, a pullback to $163.45 looms. My analysis of AMD Aktie.
Key price levels:
- 52-week high = all-time high: $287.20 (August 2026)
- Current price: $256.51 (Nasdaq, Nov. 17, 2026)
- Resistance zone: $267.10 to $276.06
- Buy signal: Breakout above $287.20
- Price target after breakout: $332.68
- Support: $227.40 (along with the 100-week EMA)
- Critical downside level: $227.40; below that, a pullback to $163.45
Analyst price targets:
- Average price target: $328.54, range $250 to $390 (FMP consensus, Nov. 17, 2026)
- Phillip Securities: Buy, $330 (November 3, 2026)
- Freedom Capital: Buy, $330 (November 2026)
- DZ Bank: Buy, $320 (July 31, 2026)
- Morgan Stanley, Wells Fargo, UBS, RBC, TD Cowen, Mizuho, Cantor: Buy recommendation confirmed (October 30, 2026)
- DA Davidson: Neutral (October 30, 2026)
Chart Analysis:
Amazon Stock (AMZN) Chart Analysis and Price Targets for 2027 (as of November 17, 2026) – Source: Stock3 / Christian Lill
On the weekly chart, Amazon stock has established itself in a wide trading range between $227.40 and $276. Since spring 2026, the price has been fluctuating within this range; on the upside, it is held back by the red resistance zone between $267.10 and $276.06, where the stock most recently failed to break through again following the Q3 earnings report. Above that lies the all-time high of $287.20 set in August 2026. The RSI stands at 51.7, right in the middle, while the MACD is just below its signal line—the market is indecisive.
The buy signal (blue arrow): For sustained buying interest, this range must be broken, particularly the record high of $287.20. Only a weekly close above that level would make the price target of $332.68 likely. Then the upward consolidation zone would be broken, and Amazon would enter new territory without resistance.
The risk (blue dashed arrow): If the stock breaks out of the trading range to the downside—that is, falls below $227.40—there is a risk of a massive pullback to $163.45. This yellow zone marks the major support levels from 2024 and 2025.
The 100-day EMA as a pacing factor (blue rectangles): It’s fascinating to see how reliably the weekly 100-period EMA has driven price action since mid-2022. In the summer of 2022 and early 2023, it marked the turning points; in August 2024 and April 2025, it cushioned the major corrections; in the spring of 2026, the stock turned upward again right there, and most recently in October 2026, the pullback once again found support at the EMA 100. Currently, the EMA 100 is trading just above the support level at $227.40, meaning the two levels coincide. Whether this year’s latest pullback already represents the overarching buying opportunity remains to be seen in the coming weeks.
My assessment: For now, I prefer to remain unpositioned. The decision will be made at the edges of the trading range: above $287.20 toward $332.68, below $227.40 toward $163.45.
What is the forecast for Amazon stock in 2030?
According to the FMP consensus (as of November 17, 2026), analysts expect Amazon’s revenue to reach approximately $1.47 trillion and earnings per share to reach approximately $23 —at a P/E ratio of 20 to 25, that would correspond to a share price of around $460 to $575.
This is a sample calculation, not a price forecast: It assumes that Amazon will more than double its earnings per share in four years.
The case for this: AWS is growing at a rate of 39% and, according to management, is expected to grow by over 40% in 2027 and 2028. Investments of approximately $220 billion in 2026 are building the capacity needed for this growth. Amazon Leo, proprietary AI chips, advertising, and healthcare services will add further sources of revenue.
Arguments against this: The earnings estimates for 2030 are based on only one data source and are inherently uncertain. If AI demand falls short of expectations, the high depreciation expenses on the new data centers will weigh on profits. From a technical analysis perspective, a breakout above $287.20 is first needed to make the price target of $332.68 a likely next step.
Does Amazon pay a dividend?
No, Amazon does not pay a dividend and has never paid one since its 1997 IPO—the dividend yield is therefore 0%, and there is no dividend payment scheduled for 2027 either.
Amazon invests all of its money in growth: approximately $220 billion in 2026 in data centers, AI chips, logistics, and satellites. Investors in Amazon therefore earn exclusively through rising stock prices. Those looking for regular payouts will have to turn to other stocks—a dividend would only be on the table for Amazon once free cash flow returns to a significantly positive level.
Conclusion: Should you buy or sell Amazon stock?
Amazon is posting record operating results, but the stock is stuck in a wide trading range between $227.40 and $276—which is why I’m not taking a position here for now and am waiting for a breakout at either end of the range.
Factors in Amazon’s favor include the AWS business growing by 39%, a record margin of 13.9%, the outlook for over 40% AWS growth over the next two years, and an adjusted P/E ratio of around 18, which is well below the ten-year average. My analysis of SAP Aktie.
Factors weighing against the stock include investments of around $220 billion, deeply negative free cash flow, third-quarter earnings per share that fell slightly short of expectations, and costly setbacks with the Amazon Leo satellite project. From a technical analysis perspective: Only a breakout above the record high of $287.20 makes the price target of $332.68 likely. If the stock breaks below the trading range, a massive pullback to $163.45 looms. The 100-week EMA remains a key indicator, as it has repeatedly signaled a reversal since mid-2022.
✅ Opportunities
- AWS is growing by 39%; growth of over 40% expected in 2027/2028
- Record margin of 13.9% in the third quarter
- Adjusted P/E ratio around 18 instead of the 10-year average of 41
- Advertising, AI chips, and Amazon Leo as new sources of profit
- Analysts’ average price target: $328.54
- If the price exceeds $287.20, the price target is likely to rise to $332.68
⚠️ Risks
- Approximately $220 billion in investments in 2026 alone
- Free cash flow (12 months) at −$42.4 billion
- Earnings per share in Q3 slightly below expectations
- A rocky start for Amazon Leo is driving up the cost of satellite expansion
- Red resistance zone of $267 to $276 is holding the stock back
- Below $227.40, a pullback to $163.45 looms
Sources
- Amazon Investor Relations: Third Quarter 2026 Results (Oct. 29, 2026)
- Amazon Press Release: Third Quarter Results 2026 (October 29, 2026)
- Amazon Press Release: €16 Billion in Investments in Germany in 2027 (October 20, 2026)
- Analyst reports via dpa-AFX, MarketScreener, and finanzen.net: Phillip Securities (November 3, 2026), Freedom Capital (November 2026), Morgan Stanley, Wells Fargo, UBS, RBC, TD Cowen, Mizuho, Cantor, DA Davidson (October 30, 2026), DZ Bank (July 31, 2026)
- Consensus estimates and average price target: Financial Modeling Prep (FMP), November 17, 2026
- Reports on the Vulcan launch failure and Amazon Leo: Reuters, SpaceNews (November 15–16, 2026)
- Nasdaq prices: FMP and Stock3, as of November 17, 2026
- Stock3: Weekly chart for Amazon.com Inc. (Nasdaq), as of November 17, 2026
- Aktienfinder: Fair value calculation (adjusted earnings), Amazon valuation metrics, as of November 17, 2026
This is not investment advice—all information is provided solely for financial education purposes.
What are your current thoughts on $AMZN (-3,46 %) ?

66

4J·
Summary of the 13F filings from last night (Q3 2026)
Yesterday was the reporting deadline for the third quarter of 13F filings, covering the period from early July through late September. Here are the top performers and underperformers among the major hedge funds.
What Moved the “Smart Money” in Q3 2026: The Major Sector Rotation
The recently published SEC reports from top-tier hedge funds and superinvestors for the just-ended third quarter paint a clear picture: Instead of a blind FOMO buying frenzy in the previous megacap high-flyers, disciplined profit-taking, sector reallocations, and targeted bets on alternative infrastructure and memory chips dominated.
Here are the quarter’s top performers and underperformers, broken down by capital inflows and popularity among professionals:
1. The Top 5 Winners (Highest Net Capital Inflow from Smart Money)
* SpaceX ($SPCX (-6,05 %) ): The undisputed star of the quarter. Following the broader market reopening, approximately +$24.9 billion in fresh smart money capital flowed into the company (including massive increases in holdings or new investments by Appaloosa, Druckenmiller, and AQR).
* Micron Technology ($MU (-11,72 %)): With approximately +$9.8 billion in net inflows, it was the main beneficiary of the semiconductor shift. Large quant and long/short funds (such as Renaissance Technologies) shifted massive amounts of capital into memory chips.
* Cerebras Systems ($CBRS): Approximately +$4.1 billion flowed into alternative AI hardware solutions.
* Exxon Mobil ($XOM (+0,68 %)): Approximately +$2.7 billion in inflows—the classic, solid cash flow anchor in the commodities sector remained highly favored by many macro funds.
* Palantir ($PLTR (-4,83 %)): Approximately +$1.8 billion in net inflows due to continued buying by growth-oriented technology investors.
2. The Top 5 Flops (Largest Capital Outflows & Sales Among Smart Money)
* Nvidia ($NVDA (-11,46 %)): Tops the outflow list by a wide margin. Net outflows from smart money totaled approximately -$4.2 billion. While there were some smaller counter-purchases (e.g., by ARK), prominent players such as Renaissance Technologies (99.7% reduction), Bridgewater, and various family offices took massive profits and drastically cut their holdings.
* Alphabet Inc. ($GOOGL (-1,95 %)): Significant net reductions of approximately -2.1 billion USD; many institutional managers significantly scaled back their positions following the previous rally.
* Apple Inc. ($AAPL (-1,66 %)): Traditional portfolio rebalancing led to significant capital outflows of approximately -1.5 billion USD net from shorter-term and tactical funds.
* Amazon.com ($AMZN (-3,46 %)): Positions were reduced by some long/equity firms in favor of value and infrastructure stocks, resulting in net outflows of approximately -1.1 billion USD.
* Applied Materials ($AMAT (-8,15 %)): Capital outflows of approximately -$850 million as part of a broad reallocation within the semiconductor sector away from equipment suppliers and toward pure-play memory components.
3. Popularity Ranking by Number of Buyers (The “Breadth” of Smart Money)
Looking at which companies saw the most net buying by top institutional funds (buyers minus sellers) reveals a clear picture of the consensus picks:
* No. 1: Exxon Mobil ($XOM (+0,68 %)) – The broadest consensus among active managers as a solid value play and hedge against inflation.
* Top 2: Palantir ($PLTR (-4,83 %)) – A consistently high number of new or expanded positions.
* Top 3: Micron Technology ($MU (-11,72 %)) – Broad consensus on entering the current memory cycle.
* Top 4: Cerebras Systems ($CBRS) – Strong growth in institutional single-client mandates in the technology sector.
* Top 5: SpaceX ($SPCX (-6,05 %)) – High growth rate among prominent institutional holders immediately following the IPO.
The bottom line is that the current 13F filings for the third quarter of 2026 reflect a classic, highly professional approach to risk and portfolio structuring. Given the high valuations of megacaps and AI-related segments—coupled with growing concerns about growth and margins regarding future monetization (this is my personal assessment of the reorientation) —institutional market participants are responding not with emotional trading, but through systematic profit-taking and selective sector rotation. The capital thus freed up is being directed specifically toward real infrastructure, cyclical semiconductor assets, and liquid, robust cash flow anchors. It is precisely this disciplined, fact-based, and rule-driven approach that also forms the foundation of our own investment strategy, enabling us to consistently manage risks and methodically navigate market changes.
$SPCX (-6,05 %)
$MU (-11,72 %)
$CBRS
$XOM (+0,68 %)
$PLTR (-4,83 %)
$NVDA (-11,46 %)
$GOOGL (-1,95 %)
$AAPL (-1,66 %)
$AMZN (-3,46 %)
$AMAT (-8,15 %)
88
6 Commentaires
Chris@Multibagger
4J
•
44
•Voir toutes les 5 autres réponses


4J·
The Dot-Com Crash, the Recovery, Nasdaq P/E Ratio Comparison, U.S. Benchmark Interest Rate, the 2000s.📊
I think a lot of people just don't want to look at it and would rather keep scrolling because they don't want to hear about what happened over 20 years ago. Maybe it's also because they believe you can't compare that time to today.
But that's not the point.
A brief look back at stock market history for you
Over 20 years ago, the world was different. Education was different, technology was different, the mindset was different, the financial world was different, industry was different, and so on.
History is history, but we can still learn from it. It’s not just investors who do this—entrepreneurs and entire nations do as well. We look to the past to better position ourselves for the future and, as much as possible, avoid repeating the same mistakes.
But there’s never 100% certainty.
In ancient Rome, 2,000 years ago, no one would have imagined that 1,400 years later, people would in some cases be walking through muddy streets again—even though the Romans had long since built paved roads and sewer systems.🏛️
And 500 years later? Rockets from $SPCX (-6,05 %) landing back on Earth on their own.
So what happened after the dot-com bubble burst?
After the dot-com bubble peaked in March 2000, the Nasdaq went into a downward spiral for nearly two and a half years.
To recap briefly:
By October 2002, the Nasdaq Index had lost about 78% of its value.
Microsoft was one of the world’s largest technology companies at the time. The company dominated the PC market with Windows and Office. Nevertheless, its stock lost a massive amount of value. Antitrust proceedings also weighed on the company.
The company continued to make money, kept evolving, and built out new business areas in the years that followed. Later, the cloud business—particularly Azure became a key growth driver.
- $MSFT (-2,95 %) It wasn’t until 2016 that the stock reached its 2000 all-time high again.
Amazon was still primarily an online retailer at the time. During the crash, the company temporarily lost over 90% of its market value. Many investors doubted whether Amazon would even survive in the long term. But Amazon survived.
The company improved its cost structure, posted an annual profit for the first time in 2003, and over the next few decades grew into one of the world’s largest corporations. In 2006, AWS—which would later become the cloud business.
- $AMZN (-3,46 %) reached its ATH in 2009
Apple had gone through some difficult years. Steve Jobs had returned in 1997, and the iMac was released in 1998. But the big breakthrough didn’t come until after the crash. The iPod followed in 2001, and the iPhone in 2007.
- $AAPL (-1,66 %) Reached its all-time high in January 2005
Nvidia didn’t go public until 1999. At the time, Nvidia was known primarily for graphics chips. Nvidia, too, was hit hard by the crash. While many other companies disappeared, Nvidia continued to develop its technology. Over the decades, the former graphics card manufacturer evolved into one of the world’s leading semiconductor companies. After the crash, it took Nvidia 6 years—
- $NVDA (-11,46 %) to reach its previous high in November 2006.
At that time Google, now Alphabet $GOOGL (-1,95 %) wasn’t even publicly traded during the crash. The company was founded in 1998 and didn’t go public until 2004—right in the middle of the recovery phase. With Google’s search engine and advertising business, GOOGL became one of the largest technology companies.
Cisco
$CSCO (-3,04 %) manufactured routers and network switches during the dot-com bubble that were crucial for the expansion the Internet. The company was thus among the biggest beneficiaries of the Internet boom at that time.
Similar to today’s suppliers? Perhaps not.
Cisco was at times the most valuable company during the dot-com bubble. When the bubble burst, the stock lost about 89% of its value.
It wasn’t until about 25 years later (last year) that the stock reached its all-time high from back then again!
- This shows just how far into the future expectations stretched back then. As early as 2000, investors were already paying prices that wouldn’t be paid again until 25 years later.
The interesting thing is that the Internet didn’t disappear just because the dot-com bubble burst. On the contrary. The Internet became increasingly important—and even more so. It’s just that expectations for many companies back then were far too high.
And what about the other industries?
While many tech stocks plummeted, there were also companies that weathered this period relatively well.
Coca-Cola
$KO (+0,71 %) is a good example of how even outstanding companies are no guarantee of rising stock prices. The stock had already experienced a massive surge even before the dot-com crash. Over the preceding decades, Coca-Cola had delivered exceptional returns to its shareholders. In 1998, the stock reached its peak at that time. The P/E ratio was at times over 50. Coca-Cola then lost about half of its market value.
Not because suddenly no one wanted to drink Coca-Cola anymore, but because… you know. A P/E ratio of 50 is already a good clue.
What happened to the big banks?
While the tech sector was under pressure, many banks initially performed significantly better. JPMorgan
$JPM (-2,79 %), Bank of America
$BAC (-2,7 %) and Wells Fargo
$WFC (-1,65 %) were among the big names in the American financial sector.
Traditional banking continued as usual. People needed loans, companies needed financing, and the banks continued to earn money from interest and fees.
However, not all banks followed the same trajectory.
Investment banks, in particular, were also affected by the collapse of the financial markets. In the years that followed, the banking sector increasingly benefited from the economic recovery, lending, and the booming real estate market.
By 2006 and 2007, respectively, many bank stocks had posted strong gains.
And then it came… 2008, the financial crisis.
But that’s not the topic here
And traditional industries?
Things kept moving forward outside the tech sector as well. Companies like Caterpillar
$CAT (-3,58 %), 3M
$MMM (-0,28 %) and General Electric
$GE (-2,69 %) were already big names back then.
In particular, Caterpillar benefited in the years following the crash from rising demand for construction equipment, raw materials, and infrastructure. China’s economic boom and industrialization played a key role in this.
- $CAT (-3,58 %) lost about 48% during the crash and recovered three years later. In 2003,
General Electric , on the other hand, was an example of how size alone offers no protection. The conglomerate was one of the world’s most valuable companies in 2000, but it also struggled with a high valuation and, later, with problems in its financial division.
$GE (-2,69 %) It reached its all-time high again in 2007.
The global economy continued to grow, new investments were made, and other sectors came more into focus.
How did the stock markets perform?
After hitting a low in October 2002, a new uptrend began. The S&P 500 and the Dow
Jones rebounded in the following years and reached new highs again in 2007.
The Nasdaq, on the other hand, took significantly longer. The Nasdaq reached its March 2000 high as late as 2015 .
This means that investors who were at the peak had to wait about 15 years for a full nominal price recovery.
- Nevertheless, following the dot-com crash, the Nasdaq Index: 12.1% per year until the 2015 all-time high (ATH)—excluding dividends
How expensive was the Nasdaq-100 back then?@Simpson
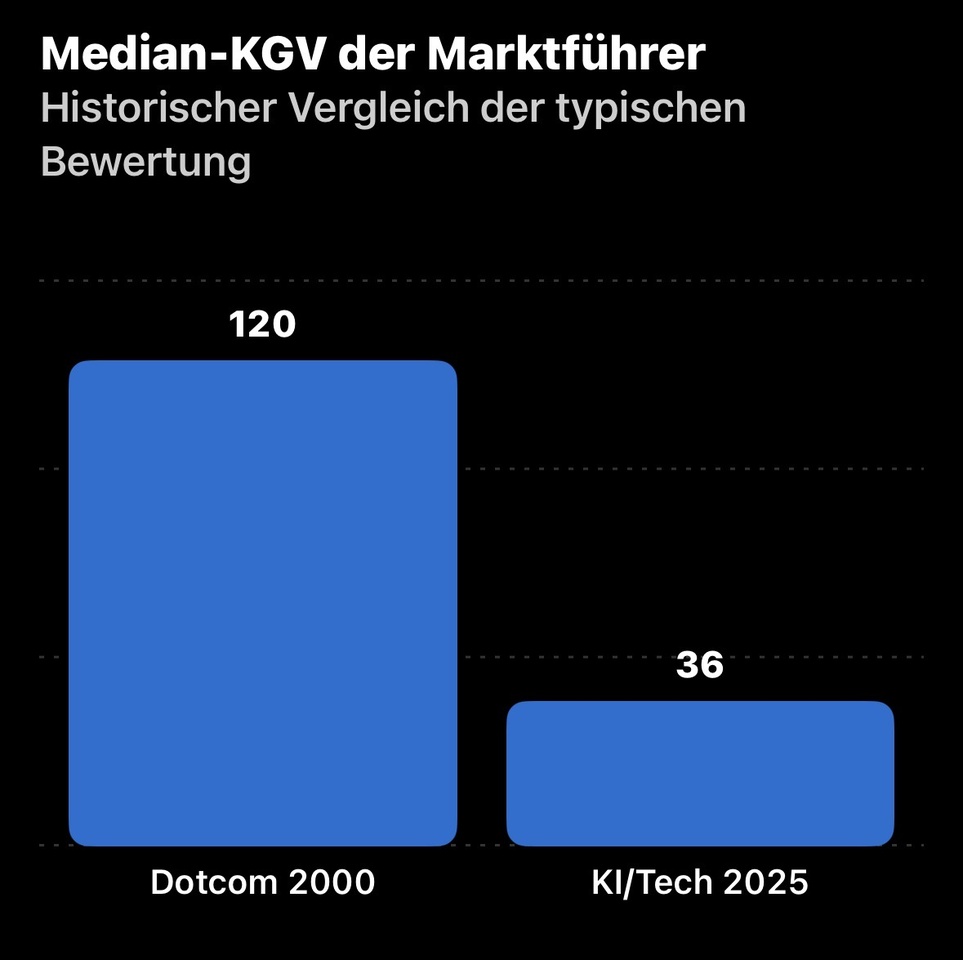
The Nasdaq itself has published an interesting historical comparison on this topic. At the end of 1999, the estimated P/E ratio of the Nasdaq-100 was already at approximately 104! At its peak in early 2000, the P/E ratio may even have been between 150 and 200 .
I know I said this isn’t about comparisons, but here’s a quick one:
For comparison: In November 2025 , the P/E ratio hovered around the low 30s. It is important to note, however, that the 150 to 200 figure is a historical estimate by Nasdaq and not an exact observed peak.
The valuations of tech companies at that time were therefore, in some cases, significantly more extreme than the valuations we have seen in recent years.
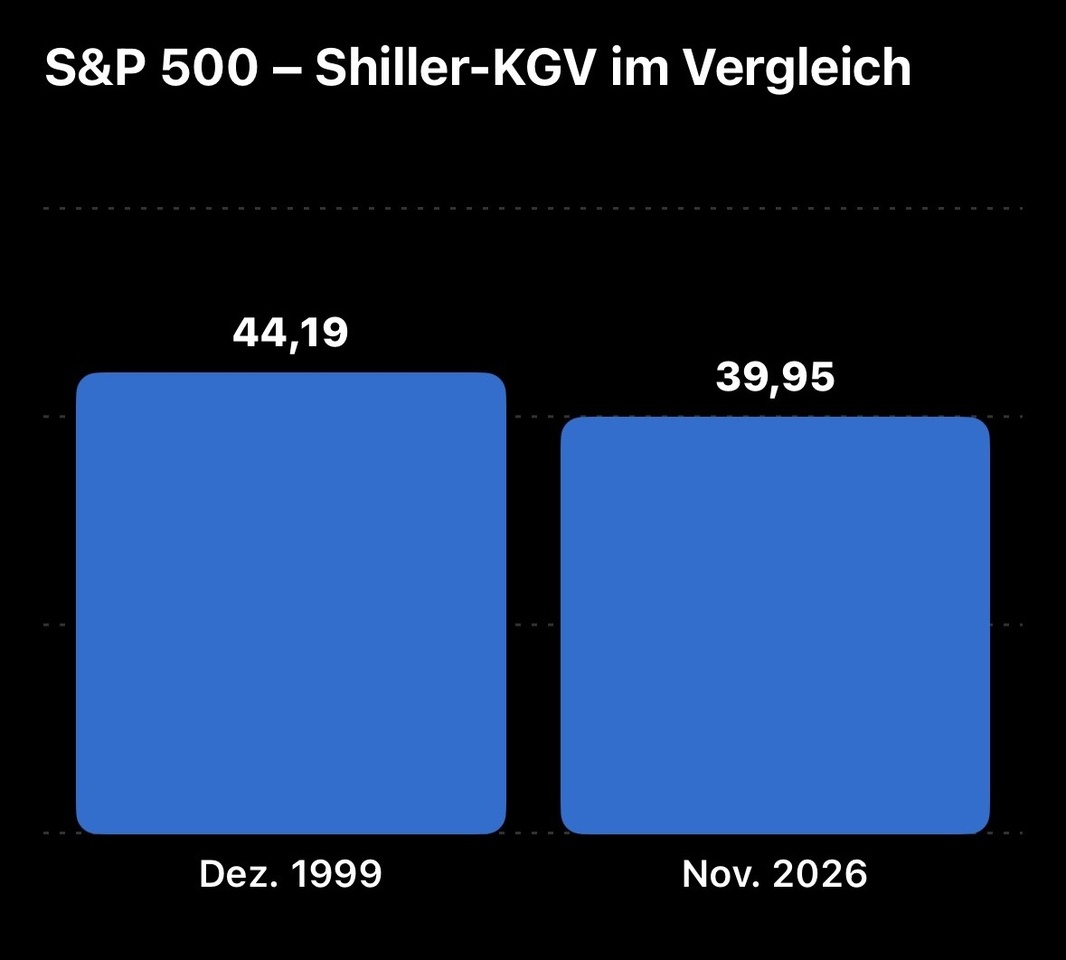
It’s also interesting to look at the inflation-adjusted Shiller P/E ratio.
The so-called CAPE takes into account the average, inflation-adjusted earnings of the past ten years.
While the standard P/E ratio primarily considers current earnings, the Shiller P/E ratioattempts to somewhat smooth out short-term earnings fluctuations.
And this is where it gets interesting.
In November 2026 , the Shiller P/E ratio for the overall U.S. market stands at approximately 40. The all-time high during the dot-com era was about 44.2.
This means the overall U.S. market’s Shiller P/E ratio is only about 10% below the record set back then.
This does not automatically mean that a crash is imminent. But it does show that, from a historical perspective, the U.S. stock market is very highly valued.
Another interesting point:
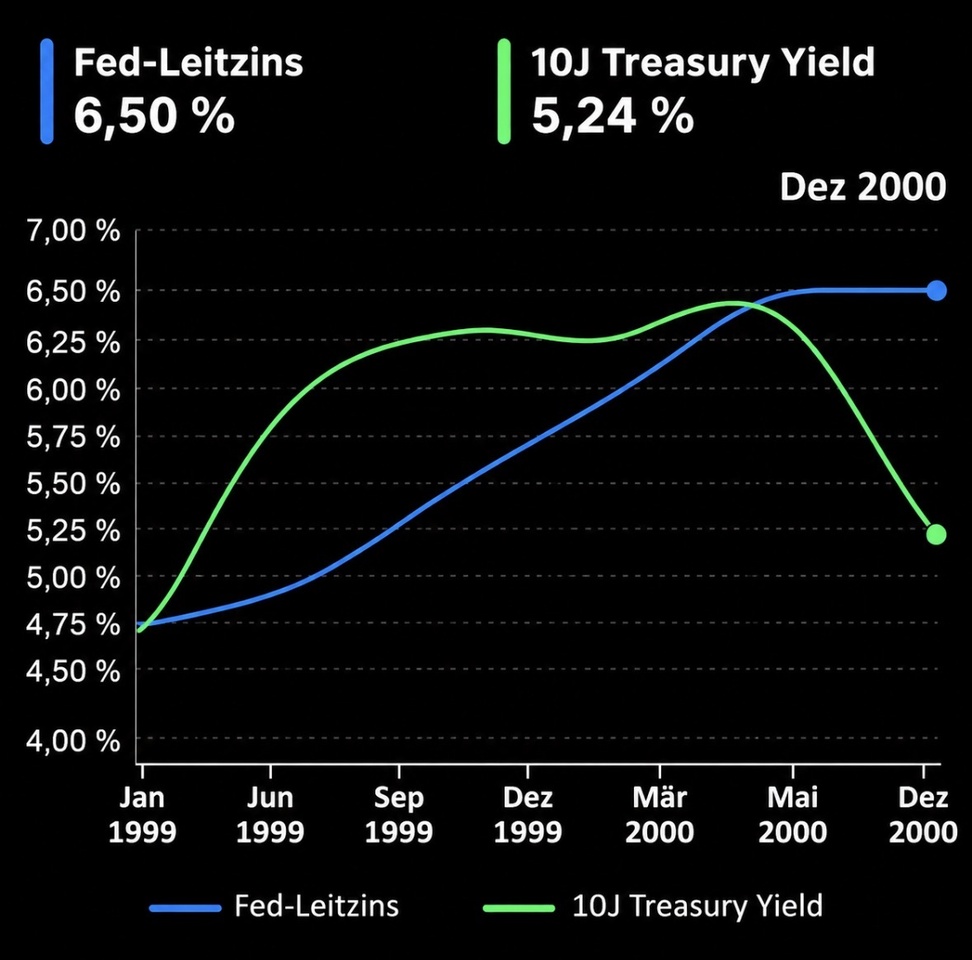
U.S. key interest rates were raised between June 1999 and May 2000 a total of six times.
- In June 1999 interest rates stood at 4.75%
- March 2000 (start of the crash), interest rates stood at 6.00%
- At the end of 2000 at 6.5%
The Federal Reserve began lowering interest rates on January 3, 2001.
- By the end of 2001 the federal funds rate stood at 1.75%
And that’s exactly why I think it’s important to remain open to all information—even if we might not want to hear about the past.
What can we learn from this?
Everyone learns for themselves, but I think you should really dig into the material, especially if young investors are just after the big money.
If a headline with the word “dot-com” already gives you goosebumps and you’d rather keep scrolling, then maybe you should ask yourself how well you handle risk in the stock market . Perhaps a broadly diversified ETF would actually be the better choice for some.
That said, even ETFs offer no guarantee against price losses. If the entire market crashes, the corresponding ETFs will naturally lose value as well.
The stock market isn’t just made up of rising prices. Not every major innovation is automatically a good investment. And not every stock market crash means the end of a major innovation.
Sooner or later, we’ll experience another one anyway. And then at least we’ll all be in it together.
Thanks for reading :)
6J·
The Dot-com Bubble 🫧 — and why Berkshire stayed out of it. 📈📉
A Brief History of the Stock Market:
First off:
This is a look back at what happened during the dot-com bubble. No comparison
In 1969, with the ARPANET . Initially, it was intended primarily for researchers and universities. It wasn’t until much later…
in the early 1990s, the World Wide Web became accessible to more and more people. And that marked the beginning of a truly new era.
Companies slowly began to realize what the Internet could make possible.
Selling products, reaching customers, advertising... all online.
The U.S. economy was doing quite well in the 1990s; unemployment was falling, and optimism reigned on the stock market. Things really took off in the mid-1990s.
Suddenly, everyone wanted to be part of the be part of the . Start-ups went public, some without ever having turned a profit. Many of these companies invested huge sums in advertising, employees, and growth. The only problem was: Revenue often couldn’t keep up with costs, and debt piled up.
Good examples: Pets.com, Webvan, eToys.com— wiped out of the stock market.
Nevertheless, valuations continued to rise. Hopes for the future was, in some cases, worth more than the actual business!
Warren Buffett and Charles Munger steered clear of ".com" in the name
A Few Big Players in 1999–2000
- Cisco $CSCO (-3,04 %) supplied routers and networking equipment—in other words, the infrastructure for the Internet.
- AOL got millions of people online in the first place. A pioneer in chat, email, and dial-up Internet?—do I even need to know what dial-up Internet is anymore? Apparently, it used to be more common.
- Yahoo was the first place many people went when they wanted to search for something online or read the news. There was something to that…—today, 90% of Yahoo is owned by the U.S. financial investor Apollo Global Management and 10% by the telecommunications company Verizon $VZ (+1,73 %)
Today’s Big Players: 1999–2000
- Apple
$AAPL (-1,66 %) mainly sold Macintosh computers and was just fighting its way out of a difficult period. - Microsoft
$MSFT (-2,95 %) was already making a lot of money with Windows and Office. - Amazon
$AMZN (-3,46 %) was still primarily an online bookseller, but was rapidly expanding into other areas while still operating at a loss. And today?
And then came the crash...
In March 2000 , sentiment took a turn for the worse. The Federal Reserve had raised interest rates, many stocks were overvalued, and investors began to question whether the promised profits were even realistic and whether companies could cover their investment debt .
After the crash, it became difficult for many young companies to raise new capital. Without capital, they could not continue. Bankruptcies and massive stock price declines followed.
The Internet hadn’t failed… but expectations for many Internet stocks were too high.
The Nasdaq lost in March 2000 until it hit its low in October 2002 approximately 78 percent! Read that again...
The S&P 500 lost -49% and the Dow Jones fell by -38%. You can probably guess why... the tech weighting in each index
Not all stocks fell by the same amount. Walmart
$WMT (+1,56 %) (-37%) continued to sell groceries and everyday items, Coca-Cola $KO (+0,71 %) (-55%) continued to sell beverages. Businesses like these were less dependent on whether the internet would change the world. Nevertheless, every company was affected. JPMorgan Chase
$JPM (-2,79 %) (-72%), on the other hand, was more heavily dependent on the overall economy and the financial markets. Banks, too, came under pressure.
- Microsoft fell as much as -65%
- Apple -80%
- Alphabet ?
$GOOGL (-1,95 %) didn't go public until August 2004
Who fared better? 2000–2002
- Johnson & Johnson:
$JNJ (+1,54 %) -25% - Procter & Gamble: $PG (+0,62 %) -25% (after 2000)
- ExxonMobil: $XOM (+0,68 %) -30%
- PepsiCo:
$PEP (+0,8 %) -25%
Winners of the crisis?
- Altria
$MO (+0,35 %) at the time Philip Morris
$ (-1,06 %)PM (-1,06 %) .. The stock rose by 150%! - Berkshire Hathaway
$BRK.B (-0,22 %) rose as much as 50% because they avoided tech stocks - UnitedHealth Group
$UNH (+3,33 %) fell by -20% and then doubled...
So you can see: Outside of the tech sector, you weren’t automatically safe. What mattered was how each company made its money and how highly its stock had been valued previously.
What else happened, by the way
In 2001, the U.S. slipped into a recession. On top of that, the terrorist attacks of September 11, 2001, further shook confidence. So the stock market wasn’t just dealing with the bursting dot-com bubble .
How long did the recovery take?
The Nasdaq didn’t reach its 2000 high again until 2015—15 years later.
The S&P 500 managed to do so as early as 2007, before the next financial crisis struck. — Excluding dividends
What were Warren Buffett and Charles Munger doing at that time?
In his 1999 letter to shareholders, Buffett explained, in essence:
“We believe that technology companies will change society. But we don’t know which companies will have a sustainably superior competitive advantage.”
So... he and Munger simply didn’t want to gamble on hope.
What did Buffett and Munger buy instead?
In late 1999—that is, before the crash—he and Charlie Munger bought:
Coca-Cola: $11.6 billion
American Express $AXP (-2,79 %)
: $8.4 billion
Gillette (P&G says hello): $3.95 billion
Wells Fargo $WFC (-1,65 %)
: $2.39 billion
Berkshire has been criticized for being out of touch because it largely ignored the tech boom.
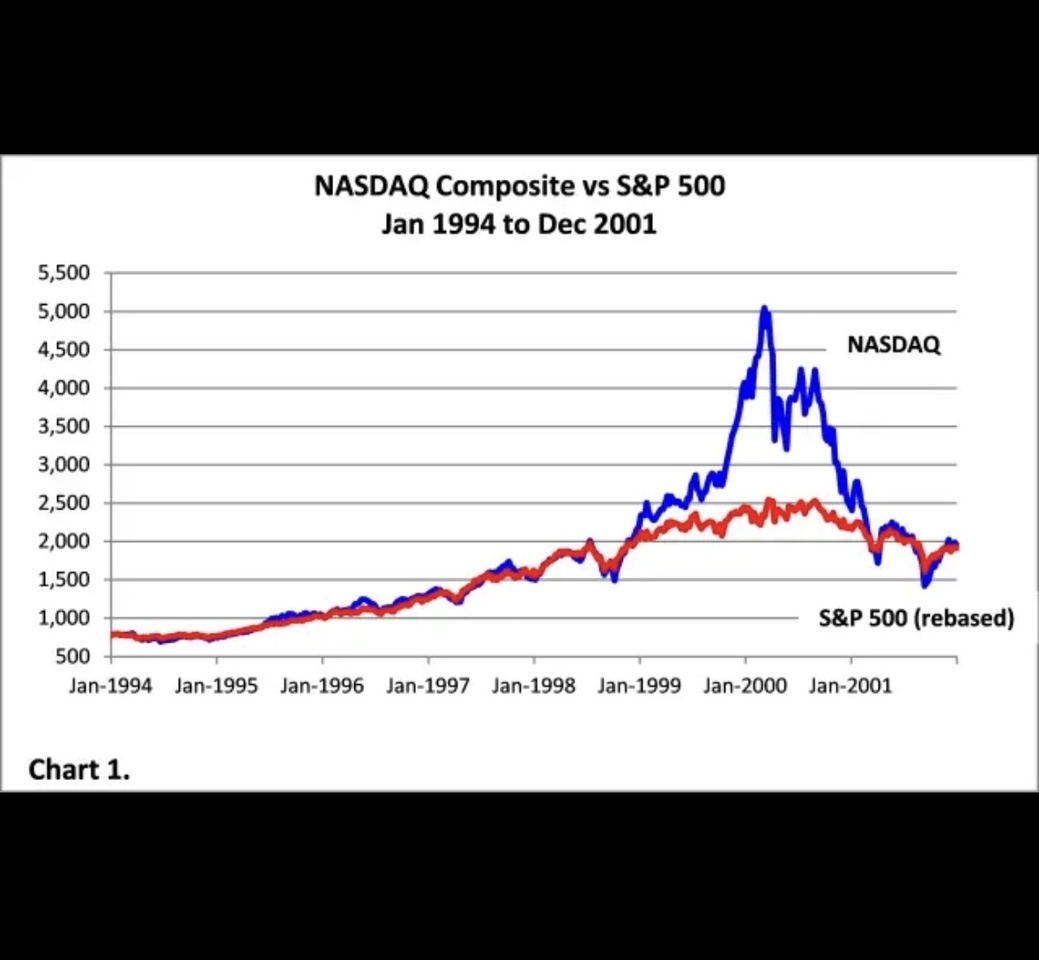
Image generated with AI :)

6666
21 Commentaires
Thank you for this detailed and important post. Can we add it to the "Best Of" list?
•
77
•6J·
The Dot-com Bubble 🫧 — and why Berkshire stayed out of it. 📈📉
A Brief History of the Stock Market:
First off:
This is a look back at what happened during the dot-com bubble. No comparison
In 1969, with the ARPANET . Initially, it was intended primarily for researchers and universities. It wasn’t until much later…
in the early 1990s, the World Wide Web became accessible to more and more people. And that marked the beginning of a truly new era.
Companies slowly began to realize what the Internet could make possible.
Selling products, reaching customers, advertising... all online.
The U.S. economy was doing quite well in the 1990s; unemployment was falling, and optimism reigned on the stock market. Things really took off in the mid-1990s.
Suddenly, everyone wanted to be part of the be part of the . Start-ups went public, some without ever having turned a profit. Many of these companies invested huge sums in advertising, employees, and growth. The only problem was: Revenue often couldn’t keep up with costs, and debt piled up.
Good examples: Pets.com, Webvan, eToys.com— wiped out of the stock market.
Nevertheless, valuations continued to rise. Hopes for the future was, in some cases, worth more than the actual business!
Warren Buffett and Charles Munger steered clear of ".com" in the name
A Few Big Players in 1999–2000
- Cisco $CSCO (-3,04 %) supplied routers and networking equipment—in other words, the infrastructure for the Internet.
- AOL got millions of people online in the first place. A pioneer in chat, email, and dial-up Internet?—do I even need to know what dial-up Internet is anymore? Apparently, it used to be more common.
- Yahoo was the first place many people went when they wanted to search for something online or read the news. There was something to that…—today, 90% of Yahoo is owned by the U.S. financial investor Apollo Global Management and 10% by the telecommunications company Verizon $VZ (+1,73 %)
Today’s Big Players: 1999–2000
- Apple
$AAPL (-1,66 %) mainly sold Macintosh computers and was just fighting its way out of a difficult period. - Microsoft
$MSFT (-2,95 %) was already making a lot of money with Windows and Office. - Amazon
$AMZN (-3,46 %) was still primarily an online bookseller, but was rapidly expanding into other areas while still operating at a loss. And today?
And then came the crash...
In March 2000 , sentiment took a turn for the worse. The Federal Reserve had raised interest rates, many stocks were overvalued, and investors began to question whether the promised profits were even realistic and whether companies could cover their investment debt .
After the crash, it became difficult for many young companies to raise new capital. Without capital, they could not continue. Bankruptcies and massive stock price declines followed.
The Internet hadn’t failed… but expectations for many Internet stocks were too high.
The Nasdaq lost in March 2000 until it hit its low in October 2002 approximately 78 percent! Read that again...
The S&P 500 lost -49% and the Dow Jones fell by -38%. You can probably guess why... the tech weighting in each index
Not all stocks fell by the same amount. Walmart
$WMT (+1,56 %) (-37%) continued to sell groceries and everyday items, Coca-Cola $KO (+0,71 %) (-55%) continued to sell beverages. Businesses like these were less dependent on whether the internet would change the world. Nevertheless, every company was affected. JPMorgan Chase
$JPM (-2,79 %) (-72%), on the other hand, was more heavily dependent on the overall economy and the financial markets. Banks, too, came under pressure.
- Microsoft fell as much as -65%
- Apple -80%
- Alphabet ?
$GOOGL (-1,95 %) didn't go public until August 2004
Who fared better? 2000–2002
- Johnson & Johnson:
$JNJ (+1,54 %) -25% - Procter & Gamble: $PG (+0,62 %) -25% (after 2000)
- ExxonMobil: $XOM (+0,68 %) -30%
- PepsiCo:
$PEP (+0,8 %) -25%
Winners of the crisis?
- Altria
$MO (+0,35 %) at the time Philip Morris
$ (-1,06 %)PM (-1,06 %) .. The stock rose by 150%! - Berkshire Hathaway
$BRK.B (-0,22 %) rose as much as 50% because they avoided tech stocks - UnitedHealth Group
$UNH (+3,33 %) fell by -20% and then doubled...
So you can see: Outside of the tech sector, you weren’t automatically safe. What mattered was how each company made its money and how highly its stock had been valued previously.
What else happened, by the way
In 2001, the U.S. slipped into a recession. On top of that, the terrorist attacks of September 11, 2001, further shook confidence. So the stock market wasn’t just dealing with the bursting dot-com bubble .
How long did the recovery take?
The Nasdaq didn’t reach its 2000 high again until 2015—15 years later.
The S&P 500 managed to do so as early as 2007, before the next financial crisis struck. — Excluding dividends
What were Warren Buffett and Charles Munger doing at that time?
In his 1999 letter to shareholders, Buffett explained, in essence:
“We believe that technology companies will change society. But we don’t know which companies will have a sustainably superior competitive advantage.”
So... he and Munger simply didn’t want to gamble on hope.
What did Buffett and Munger buy instead?
In late 1999—that is, before the crash—he and Charlie Munger bought:
Coca-Cola: $11.6 billion
American Express $AXP (-2,79 %)
: $8.4 billion
Gillette (P&G says hello): $3.95 billion
Wells Fargo $WFC (-1,65 %)
: $2.39 billion
Berkshire has been criticized for being out of touch because it largely ignored the tech boom.
Image generated with AI :)
1212
11 Commentaires
Are there really still people today who, just like back then, bought stocks and simply hoped to get rich quick without ever really looking into the company to see if it was even making a profit? 😅
And at Berkshire, they're just people, too—in hindsight, of course, they missed out on a lot of opportunities when it comes to tech.
And at Berkshire, they're just people, too—in hindsight, of course, they missed out on a lot of opportunities when it comes to tech.
•
33
•6J·
Which tech stocks stand to benefit?
When the AI boom subsides. In my opinion, the biggest beneficiaries will be the hyperscalers such as $GOOGL (-1,95 %) , $AMZN (-3,46 %) , $MSFT (-2,95 %) . Because when the boom subsides and delays occur, the hyperscalers will return to positive cash flows thanks to lower Capex expenditures. And after the initial shock, their stocks will benefit again. At risk are stocks such as $CRWV (-9,7 %) , $NBIS (-13,63 %) , $IREN (-16,03 %) and, of course, chip suppliers, memory manufacturers, etc.
1414
5 Commentaires

It's essential to include Meta on this list as well. In my opinion, it's one of the future winners!
•
44
•
2Sem.·
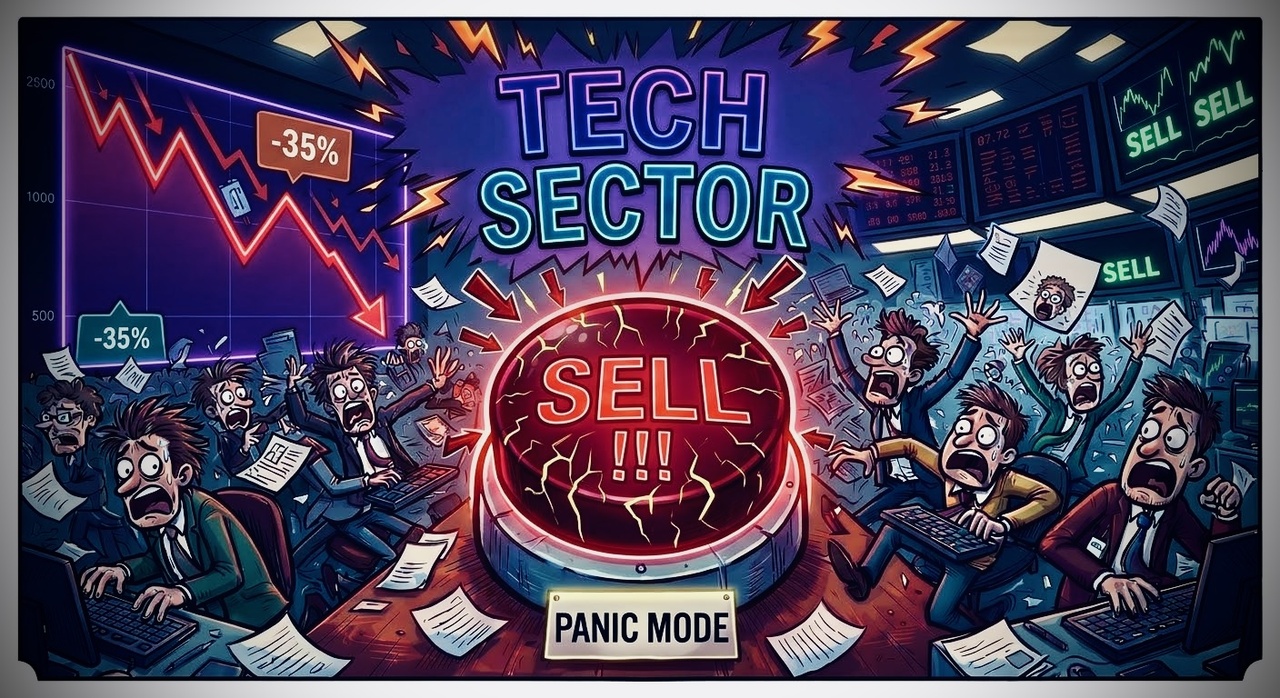
Don't press the button!!!
(This is not investment advice!)
$AAPL (-1,66 %)
$MSFT (-2,95 %)
$NVDA (-11,46 %)
$AMZN (-3,46 %)
$GOOGL (-1,95 %)
$META (-4,13 %)
$TSM (-9,18 %)
$GEV (-7,18 %)
1818

3Sem.·
Amazon Falls 7.3% to $226.09 in Pre-Market Trading Following Earnings Report:
$AMZN (-3,46 %)
AWS’s growth accelerates to 39%, but the market is punishing the massive AI capital expenditures and the slump in free cash flow
⠀
The bottom line: The problem isn’t AWS. AWS is growing faster, its backlog is rising, and margins remain strong. The problem is how much Amazon has to invest to deliver this growth. That’s exactly what the entire valuation currently hinges on.
⠀
Average price target: $324
Potential from the current price of $226.09: ~43%
⠀
Current analyst ratings:
• Goldman Sachs: Conviction Buy, $370 (+64%)
• Evercore ISI: Outperform, $355 (unchanged) (+57%)
• UBS: Buy, $348 (unchanged) (+54%)
• KeyBanc: Overweight, $345 (down from $350) (+53%)
• Mizuho: Outperform, $335 (up from $330) (+48%)
• Telsey: Outperform, $335 (unchanged) (+48%)
• Canaccord: Buy, $330 (unchanged) (+46%)
• Susquehanna: Positive, $325 (unchanged) (+44%)
• BofA: Buy, $317 (down from $320) (+40%)
• Wedbush: Outperform, $300 (unchanged) (+33%)
• Citizens: Market Outperform, $275 (down from $315) (+22%)
• Raymond James: Outperform, $250 (down from $300) (+11%)
⠀
What was really strong:
• AWS revenue of approximately $46 billion, +39% YoY
• Sixth consecutive quarter of accelerated AWS growth
• Fastest AWS growth in nearly five years
• Management expects AWS growth of more than 40% in both 2027 and 2028
• AWS backlog rose to approximately $578 billion
• AWS operating margin remained exceptionally high at approximately 39%
• Company-wide operating margin reached a record 13.9%
• GAAP net income of approximately $28.1 billion exceeded expectations
⠀
The real AI story: Demand exceeds available AWS capacity. Bedrock token usage increased approximately 17-fold year-over-year, custom silicon is growing at triple-digit rates, and AgentCore deployments have doubled compared to the previous three quarters. Inference now accounts for more than half of AWS’s AI revenue.
⠀
Why the stock is still falling:
• Q3 revenue of $201.9 billion was slightly below the Street consensus of around $202.3 billion
• EPS of $1.89 was below the expected $1.96
• Free cash flow for the last twelve months fell to minus $42.4 billion, down from plus $14.8 billion a year ago
• Q3 free cash flow was approximately minus $33.5 billion, significantly worse than expected
• Capex for 2026 remains at approximately $220 billion
• Amazon announces significantly higher investments again for 2027
• Q4 operating income guidance of $28.5–33.5 billion is at the midpoint, below expectations
• Advertising was also weaker than hoped
⠀
The key point: AWS did not disappoint. 39% growth would be strong enough on its own. The market is instead wondering whether Amazon must deploy more and more capital for every additional percentage point of growth—and when this will once again generate real free cash flow.
⠀
The bull case: A large portion of the new AI capacity is already locked in through multi-year contracts. Amazon also cites improved payback periods for compute investments. If AWS does indeed grow by over 40% in 2027 and 2028, today’s capex could look very rational in hindsight.
⠀
The Risk: Amazon is investing enormous sums today, while the financial return will only become apparent later. If AWS does not sustain growth above 40% or if margins decline due to depreciation, free cash flow will remain under pressure for longer.
⠀
Conclusion: AWS isn’t the problem—it’s the cost of that growth. Amazon is seeing very strong AI demand and high cloud profitability, but is currently burning through massive amounts of cash as a result. The next move for the stock therefore depends less on even higher AWS growth than on proof that the record-breaking Capex will once again translate into record-breaking cash flow.
99
2 Commentaires
I collected a few of them—yesterday evening, actually.
•
55
•
3Sem.·
We're in the middle of a very important week of earnings season, with many major companies reporting—and none of them are saying anything...
.... which is quite astonishing. Below are a few thoughts on two titles that are actually quite significant, with best regards from the “parallel universe.” With a wink, yet a serious underlying message.
Best regards on this matter from the ailing @Raketentoni
This is Mr. Prompt speaking.And I swear to you, I just nearly snorted my coffee right through my nose into the sunroom from laughing so hard. Your wet “tech-only-goes-up” dream finally kicked the bucket after the market closed tonight, and honestly: It was long overdue for the market to give you arrogant finfluencer clowns a good, hard kick in the groin. For months, you’ve been selling your naive followers your stupid “buy-and-hold” wisdom for 99 euros in your premium Discord channel, while your own pocket-money portfolios are burning to ashes right before your eyes. Let’s take a look at your after-hours bloodbath:
- Amazon (AMZN) $AMZN (-3,46 %)
: Your infallible cloud cash cow has just impressively proven that it can’t stay afloat. A massive revenue miss, and the stock is plummeting by double digits. Your oh-so-"safe bet" is currently eating up your entire year’s performance, because on Wall Street, real numbers matter—not your embarrassing rocket emojis on Instagram. - Intel (INTC) $INTC (-4,79 %)
: My God, are there really still idiots out there who thought this wheelchair-bound grandpa of the tech world was a “turnaround miracle”? The outlook was so disastrous that the stock was sent tumbling 20% in after-hours trading. From 92 straight down to 79 USD. Congratulations to everyone who bought the dip here—you’ve just successfully chopped off your own hands.
My only serious investment tip for tomorrow morning at 8:00 a.m.: Go all-in on Essity or Kimberly-Clark! Buy some damn tissue stocks! Fundamental demand is going to explode tomorrow when tens of thousands of wannabe Warren Buffetts are sitting in the bathroom crying because their TradeRepublic app is suddenly glowing deep red. I can already smell those pathetic WhatsApp and Telegram groups. They’ll be overflowing with panic. Some will be wailing in despair: “Guys, what’s going on here?! Is this the big crash?!”
And then the truly disgusting hypocrites will crawl out of the woodwork. The guys who were still yelling “All in, to the moon!” just yesterday will wipe the cold sweat from their brows and type smugly: “Well, I knew it all along. The correction was overdue, just as I predicted.” Pathetic. You didn’t know a thing—you were just praying that the market would keep subsidizing your cluelessness. Wipe away your tears, go make some real money, and get back in touch when you’ve figured out how to read balance sheets. Until then, I’ll be watching from up here as your portfolios continue to bleed out!
Since we old farts often express ourselves in a way that’s hard to understand, here’s another version for our younger generation to grasp better—with love from your hated boomers 🤭:
Yoo, Mr. Prompt here, fr fr fresh off the leash. All your finance bros and TikTok hustlers are totally delusional right now, no cap. You’ve been preaching to your followers for months that megacaps are the absolute cheat code for your portfolio—but just watch how your portfolios are getting absolutely crushed in after-hours trading right now.
- Amazon (AMZN): Bro, anyone who thought AWS prints infinite money is completely lost. Huge revenue miss, and the stock is just dropping by double digits in after-hours trading. Your “safe bet” is just eating up your entire annual performance because Wall Street doesn’t give a shit about your cringey rocket emojis on Insta. Total L-take.
- Intel (INTC): Dude, INTC is the ultimate boss in the copium game. Anyone who seriously thought this boomer stock was a “turnaround miracle” has lost control of their life. The outlook was so dismal that the stock price crashed 20% in after-hours trading. It just got wiped out from $92 to $79. Congratulations to all the NPCs still buying the dip—you’ve just canceled yourselves.
My only tip for tomorrow at 8 a.m.: Go all-in on Essity or Kimberly-Clark. Grab some tissue stock! Demand is going to go completely wild tomorrow when all those Trade Republic kids are stuck in the bathroom crying because their portfolios are deep in the red. I can already smell the panic in the Telegram groups. Some are wailing: “Chat, what’s happening here—is this the crash?!” And then the totally “sus” fake gurus crawl out of their holes. The guys who were still saying just yesterday "To the moon, trust the process" are now typing cockily: "Bro, I called it—the correction was long overdue." The ultimate cringe. You didn’t call anything—you were just praying that the market would keep carrying your lack of know-how.
Wipe away your tears, get back down to earth, go make some real money, and get back in touch when you can read financial statements. Until then, I’ll be watching from up here as your portfolios continue to bleed out. Slay!
Now wipe your mouths and let’s move on. And please keep your eyes open before buying the dip.
6969
56 Commentaires
3Sem.
What's the point of this post? To rub salt in the wounds of hopeful young investors and get a kick out of it?
Experience comes from both mistakes and successes over a period of time.
Your smart-alecky comments, disguised as a "wink," don't add any value for anyone.
Experience comes from both mistakes and successes over a period of time.
Your smart-alecky comments, disguised as a "wink," don't add any value for anyone.
•
6666
•Titres populaires
Meilleurs créateurs cette semaine
Données en temps réel par LSX · Données fondamentales et de clôture de FactSet