

$MNDY (+0,16%)
$PGY
$APO (-1,54%)
$ON (-0,19%)
$AMKR (+1,61%)
$MEDP (+2,54%)
$UPWK (+0,95%)
$ACGL (-0,87%)
$ACM (-0,92%)
$KO (-2,47%)
$SPOT (+0,38%)
$CVS (-0,7%)
$DDOG (+5,44%)
$FI (-0,72%)
$SPGI (-0,41%)
$RACE (-0,98%)
$AZN (-0,21%)
$MAR (-1,25%)
$OSCR (-6,29%)
$HOOD (-1,11%)
$ALAB (+0,44%)
$F (-2,73%)
$LYFT (-1,78%)
$UPST (+0%)
$NET (+7,94%)
$GILD (-0,61%)
$EW (-1,01%)
$SHOP (+0,45%)
$VRT (+0,02%)
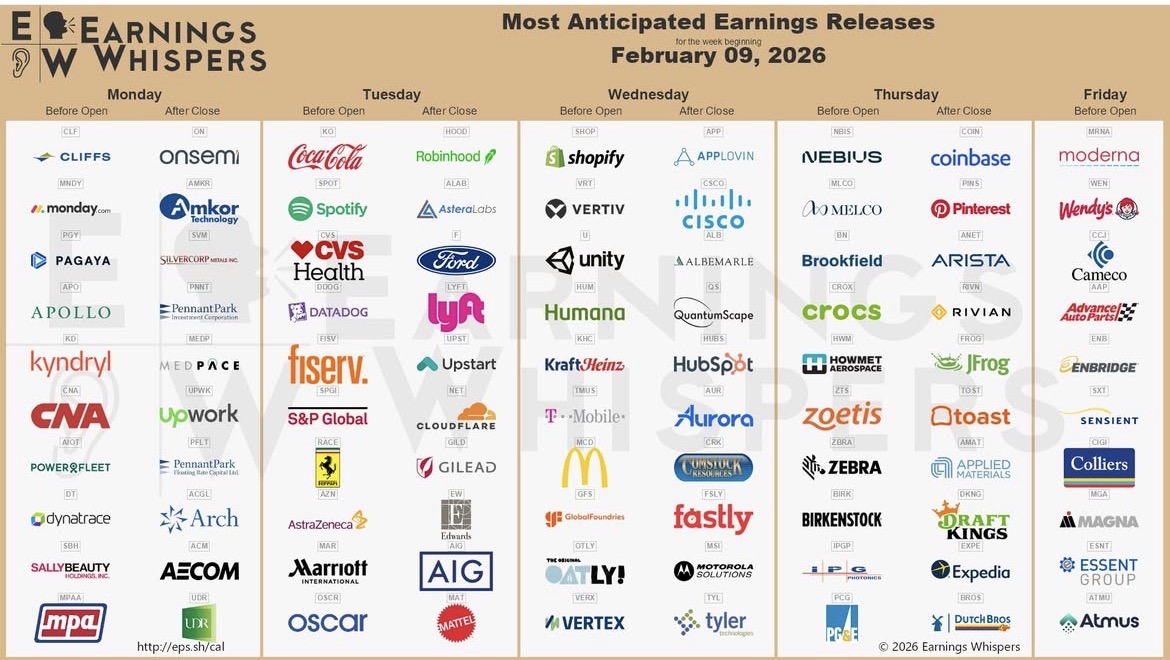
$HUM (+0,53%)
$KHC (-0,97%)
$MCD (-1,4%)
$9ZX1
$TMUS (-6,92%)
$APP (-0,8%)
$CSCO (+1,75%)
$ALB (+1,97%)
$HUBS (+1,47%)
$TYL (-0,63%)
$NBIS (+1,36%)
$BN (-0,06%)
$CROX (-1,39%)
$ZTS (-1,38%)
$BIRK (-2,51%)
$COIN (-2,34%)
$ANET (+1,14%)
$RIVN (-1,68%)
$TOST (-1,85%)
$AMAT (+0,68%)
$DKNG (+0,27%)
$WEN (-4,97%)
$CCO (+0,17%)
$ENB (+0,7%)

Humana DE
Ação
Ação
Ticker: HUM
HUM
Price
Discussão sobre HUM
Postos
158Mês·
Will the sell-off continue next week?
1313
12 ComentáriosGehebeltes-EFH@Gehebeltes-EFH
8Mês
•
1212
•
11Mês·
Humana Q3’25 Earnings Highlights
🔹 Revenue: $32.65B (Est. $32.00B) 🟢
🔹 EPS (Adj): $3.24 (Est. $2.83) 🟢
🔹 Insurance Segment Benefit Ratio: 91.1% (in line with “just above 91%” expectation)
Affirmed FY’25 Guidance
🔹 EPS (Adjusted): ~$17.00 (Est. $17.04) 🔴
🔹 Insurance Segment Benefit Ratio: 90.1%–90.5%;
🔹 Medicare Advantage Membership: ~(425,000) decline; Improved vs prior guide (up to 500,000 decline)
Segment:
🔹 CenterWell Primary Care: +56,600 patients (~+15% vs 12/31/24)
🔹 CenterWell Pharmacy: continued growth across payor-agnostic offerings; stronger Specialty volumes and DTC growth
🔹 Medicaid & Duals: prepping for Jan 1, 2026 launches (MI HIDE SNP, IL FIDE) and SC duals carve-in
Management Commentary
🔸 “Our strategy of putting the consumer at the heart of everything we do is working, with solid year-to-date performance and strong momentum heading into the Annual Election Period.” – CEO Jim Rechtin
11
1Ano·
Humana beats Q2, raises FY25 adj. EPS & revenue outlook despite GAAP cut
• Q2 GAAP EPS: $4.51 | Adj. EPS: $6.27
• YTD GAAP EPS: $14.81 | Adj. EPS: $17.85
• Insurance Benefit Ratio: 89.9% (in line)
• FY25 Adj. EPS Guide: ↑ to ~$17.00 (from ~$16.25)
• FY25 GAAP EPS Guide: ↓ to ~$13.77 (from ~$14.68)
• FY25 Revenue Guide: ↑ to ≥ $128B (from $126–128B)
• Medicare Advantage membership decline revised to ~500K (from ~550K)
• CenterWell patient growth outlook raised to 50K–70K (from 30K–50K)
22
1Ano·
Humana Q1'25 Earnings Highlights
🔹 Adj. EPS: $11.58 (est. $10.09) 🟢; +60% YoY
🔹 Revenue: $32.11B (est. $32.22B) 🟡; +8.4% YoY
🔹 Insurance Segment Benefit Ratio: 87.4%
FY25 Guidance (Re-affirmed):
🔹 Adj. EPS: ~$16.25 (est. $16.35) 🟡
🔹 GAAP EPS: ~$14.68 (prior ~$15.88, est. $16.04) 🔴
🔹 Insurance Segment Benefit Ratio: 90.1%–90.5% (affirmed)
🔹 Expected FY Medicare Advantage membership decline: ~550K (due to strategic exits)
Strategic / Business Updates:
🔸 CenterWell Pharmacy named fulfillment partner for NovoCare®’s weight-loss Rx
🔸 Illinois to award Humana a contract under new Medicaid dual-eligibles program
🔸 Progressing in value-based care and Medicaid; confidence in long-term Medicare Advantage outlook
CEO Commentary:
🔸 “Medicare Advantage is performing as expected… we are confident in the growth outlook for value-based care and Medicare Advantage.” — Jim Rechtin, CEO
33

1Ano·
Humana analysis
Dear investors,
Today I am back with a current analysis on $HUM (+0,53%) . However, this is a rough version of the analysis, which has not been revised or nicely formatted. Nevertheless, I believe that I can provide you with the most important information.
Humana Inc.
ISIN: US4448591028
Index: S&P500
Sector: Health Care
Chart analysis:
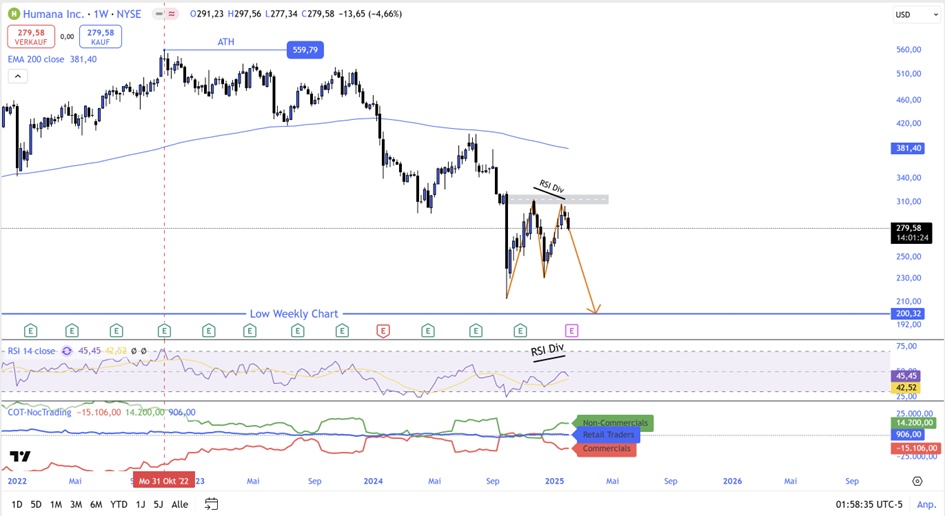
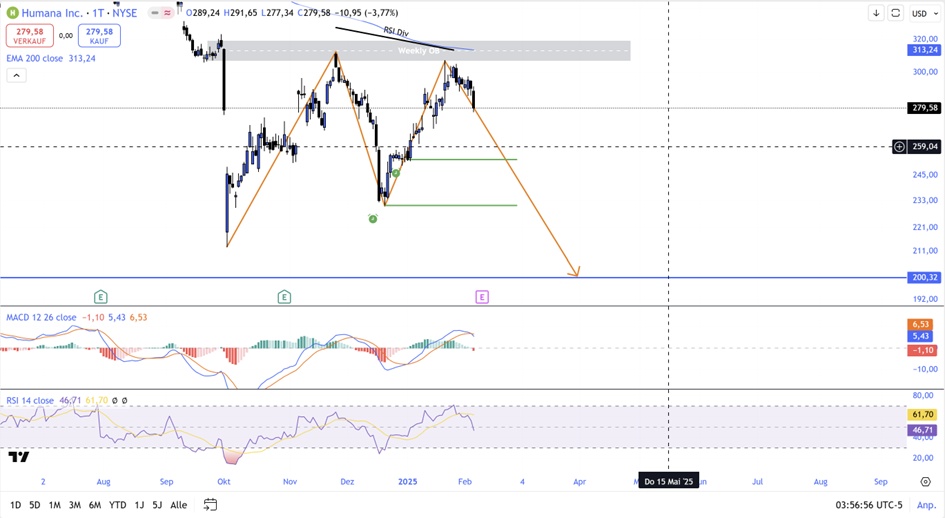
Since October 31, 2022, we have been in a long-term downtrend in which the price has already fallen by a good 50%. Commercials are more likely to go short but still with a lower volume, which is only moderately meaningful. Furthermore, we have been below the 200-week line below the 200-week linewhich suggests a strong, long-term downtrend. The current structure on the weekly chart is also giving a bearish signal. In addition, an M-pattern, which is further reinforced by an RSI divergence. This results in a clear bearish signal on the weekly chart. The next target could be the low at approx. 200$.
On the daily chart we are also below the 200 line. However, we had a short-term upward trend here, which caused the price to rise by 30% in around 40 days. There we then again into the weekly OBfrom which we rapidly plummeted downwards again. In the meantime, there has already been another break of structure to the downside. In the MACD, the blue line has now cut the orange line to the downside and as we are also below the 200 line, this is a bearish signal for me. The RSI is currently at a mediocre level. Profit-taking is possible at the green lines; the entire position should be sold at the latest at the blue line (weekly swing low at 200$).
Conclusion:
The chart gives a clear bearish signal. Both the present structure (Bearish Weekly OB + Retest) and the indicators (RSI Div; 200 line; MACD) signal a continuation of the downtrend.
Fundamental analysis:
Piotroski F-Score: 4 points
è Rather on the weak side -> indicates financial weakness/uncertainty
Weak bear market factor
è The price movements are almost independent of the SP500 à Not necessarily a good hedge for my portfolio
Strong bad news factor:
è Bad news can trigger stronger price movements
Sales and profit growth
- Good sales growth with an average of over 10% p.a. in the last 7 years
- Also good sales growth in the last few quarters
- Declining profit since 2021; profit fell by 50% in FY 2024
- Frequent losses in several of the last quarters
Sales growth remains in a mediocre range; however, profits are collapsing
CCA:
Humana has very high valuations compared to its peers, which cannot be explained by good margins and good growth. In terms of sales growth, Humana is in the lower midfield, and the same applies to margins. The implied share prices are largely below the current market price and therefore also give a bearish signal.
Addition: After the publication of the Q4 figures and an even lower than expected result in FY 2024, the valuation for Humana rises even further and the profit margin falls even lower. This further strengthens the bearish signal.
Historical multiple valuation:
All multiples have been on a downward trend for years.
No very strong correlations between certain multiple levels and the share price trend.
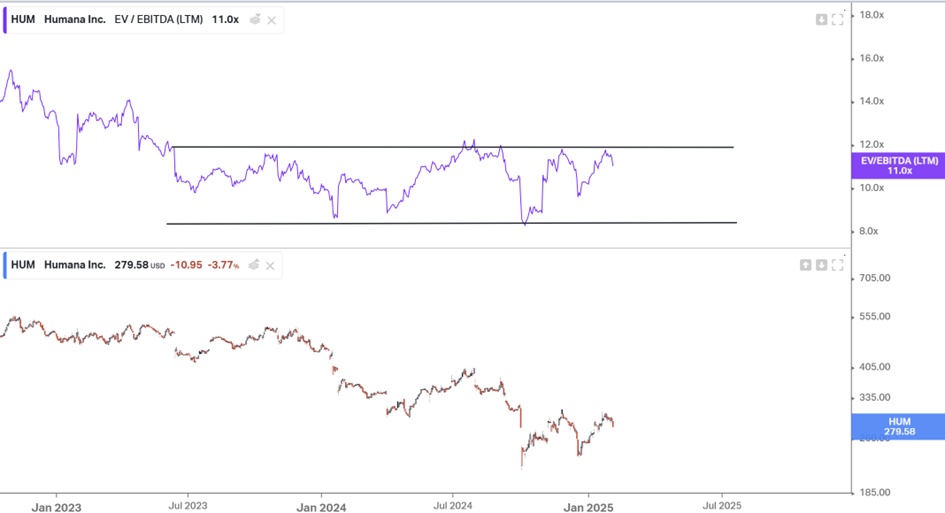
Only short-term correlation for EV/EBITDA:
Here we only recently came close to the upper barrier again and then fell again. This suggests a falling share price, at least in the short term, but is not particularly meaningful.
Conclusion:
All valuation multiples have been falling continuously for years; no long-term correlations between multiples levels and price performance can be identified, with the exception of a short-term time window à here a bearish signal is given.
Seasonal tendency
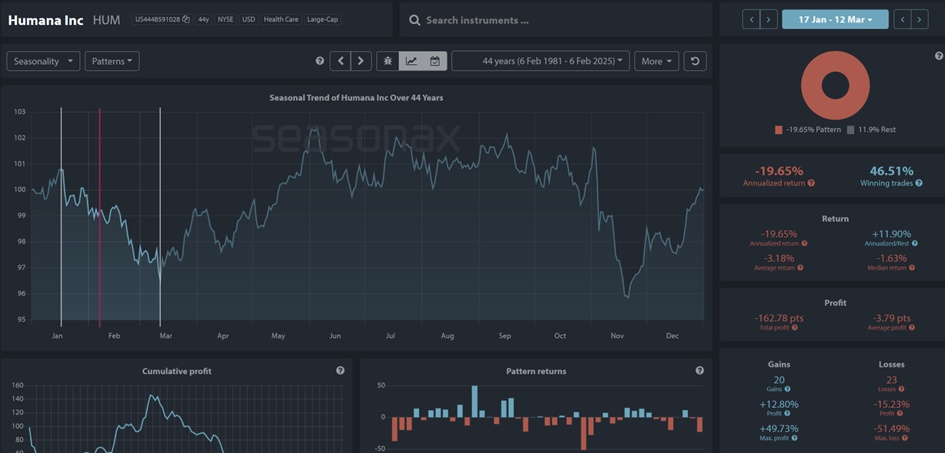
No conspicuous time windows with high returns or win rates in the first quarter. In principle, however, we are in a time window in which the annualized return is negative over the long term (15,25,44 years). This means that the negative years usually lose more than the positive years gain.
Conclusion:
No particular anomalies; no decisive information to be recognized.
Conclusion:
The chart signals a steady downward trend and gives no indication of possible longer-term trend reversals. This is confirmed by the company's current financial situation. Profits have been falling for years and in the last FY 2024 profits even fell by 50% - with sales rising slightly. Valuation multiples are also falling steadily, but are still far too high compared to the industry as a whole. The higher valuations are in stark contrast to the poor margins and low or negative growth figures.
Overall, the downward trend is expected to continue, which is why we are planning to short the share.
The $200 mark can be taken as a medium-term price target. In the short term, profits can also be taken at the green levels of the chart analysis.
My previous position has already been liquidated with a 100% return. Nevertheless, I will keep my eyes open and short the stock again if the setup is good.
Due to its almost independent price movements compared to the index, this share is not suitable for a hedge for my portfolio.
22
1Ano·
Humana Q4'24 Earnings Highlights:
🔹 Adj EPS: ($2.16) (Est. -$2.13) 🔴
🔹 Revenue: $29.21B (Est. $28.72B) 🟢; UP +10% YoY
🔹 Adjusted Insurance Benefit Ratio: 91.9%
FY25 Guidance:
🔹 Adjusted EPS: $16.25 (Est. $16.91) 🔴
🔹 GAAP EPS: ~$15.88
Q4 Segment Performance:
Insurance Segment:
🔹 Adjusted Revenue: $28.16B; UP +14% YoY
🔹 Adjusted Benefit Ratio: 91.9% (UP +50 bps YoY)
Key Drivers:
🔸 Decline in individual Medicare Advantage membership due to exiting unprofitable plans and counties
🔸 Continued Medicaid and CenterWell strategy advancements
Other Key Metrics:
🔹 Operating Cost Ratio (Consolidated): 13.2% (UP +30 bps YoY)
🔹 Net Loss (GAAP): ($5.76) per share
Strategic Updates:
🔸 Humana plans a Medicare Advantage membership decline of ~10% in 2025 due to portfolio optimization and unprofitable plan exits.
🔸 Focused on advancing Medicaid and CenterWell strategies for long-term growth.
Management Commentary:
🔸 CEO Jim Rechtin:
"We are confident in our long-term strategy and anticipate 2025 to be a critical step in returning to compelling, normalized margins. Despite near-term challenges, our focus on operational excellence remains strong."
22

1Ano·
$UNH (-1,51%) UnitedHealth is at the center of a real tragedy right now: the United Healthcare CEO has been murdered and the news has caused quite an uproar - not only within the company, but also on the stock market. The shock is real, but for young investors like us, the question is: what do you do in moments like these? And this is where the legendary quote comes into play: "Invest when the blood is flowing in the streets." Yes, it sounds brutal, but it describes the idea of investing counter-cyclically - especially when the market is reacting irrationally.
What's going on right now?
UnitedHealth is a healthcare titan, with revenue streams from insurance (UnitedHealthcare) and services (Optum). In the last quarter, revenues increased by more than 9%, to over $100 billion. The numbers are strong, demand for healthcare services remains stable, but the short-term uncertainty - caused by this tragic incident - has put the stock on the defensive. Emotional market reactions could create the timing for entry opportunities.
Why could this be an opportunity?
UnitedHealth is more than just a health insurance company. Optum, the healthcare solutions subsidiary, is a growing powerhouse in telemedicine, chronic care and health data. These trends are long-term game changers. Despite the current crisis, the demand for these services remains consistently high - simply due to the ageing population in the USA.
Politics and the long-term outlook
There are challenges: The U.S. government is targeting reforms that could affect everything from drug prices to Medicare access. That means political pressure in the short term. But companies like UnitedHealth know how to adapt - they have the networks, technology and capital to stay ahead. Sure, it won't be a walk in the park, but in the long term, the healthcare sector is a growth market.
What is the competition doing?
Eli Lilly $LLY (-2,35%) , Huma$HUM (+0,53%) and CVS Health $CVS (-0,7%) are not small players, and they are also expanding their market shares. But UnitedHealth has a particular strength: diversification. With insurance AND services, they protect themselves against fluctuations in one of the two segments. The focus on Optum gives them an innovative edge.
What can you take away as a young investor?
Many people are put off by shocks like these, but this could be exactly the moment for you to get involved. Of course there are risks, especially from regulatory uncertainty. But if a company's fundamentals are strong - and UnitedHealth's are - then it's worth taking a closer look.
In the long term, this crisis could turn out to be an opportunity. The only question is: do you have the courage when others shy away?

www.manager-magazin.deBrian Thompson: US-Konzerne rüsten nach Attentat auf Versicherungsmanager auf
66
7 Comentários
Take profits and then re-enter at a favorable price when the opportunity arises
50% profit is a good thing to take
50% profit is a good thing to take
••
1Ano·
$HUM (+0,53%) | Humana Q3'24 Earnings Highlights:
🔹 Adjusted EPS: $4.16 (Est. $3.38) 🟢
🔹 Revenue: $29.4B (Est. $28.67B) 🟢; UP 11% YoY
FY24 Guidance:
🔹 Adj EPS: At least $16.00 (Est. $16.17) 🟡
🔹 GAAP EPS: At least $12.89
🔹 Insurance Segment Benefit Ratio: Approximately 90%
🔹 Capital Expenditures: ~$2.0B
🔹 Restructuring Costs: ~$400M
2025 Outlook:
🔹 Adjusted EPS: Expected to be at least in line with FY24 results (~$16.00) 🟡, lower than previous consensus of $19.69.
🔸 Individual Medicare Advantage (MA) membership is expected to decline by a few hundred thousand due to plan and county exits, though management reaffirms its competitive positioning.
Key Financial Metrics:
Insurance Segment:
🔹 Revenue: $28.37B (UP 11% YoY)
🔹 Benefit Expense Ratio: 90.6% (UP from 87.6% YoY)
🔹 Operating Cost Ratio: 9.2% (DOWN from 10.4% YoY)
🔹 Operating Income: $329M (DOWN 59% YoY)
CenterWell Segment:
🔹 Revenue: $5.04B (UP 8% YoY)
🔹 Operating Income: $439M (DOWN 3% YoY)
🔹 Operating Cost Ratio: 91.3% (UP from 90.3% YoY)
Operational Metrics:
🔹 Operating Cash Flows YTD: $3.5B
🔹 Debt-to-Total Capitalization: 42.3%
🔹 Days in Claims Payable (DCP): 40.7 (DOWN from 43.1)
Membership & Strategic Developments:
🔹 Individual Medicare Advantage Membership: Raised 2024 membership growth forecast by 40,000 to 265,000 (UP ~5%).
🔸 Plan exits and county changes expected to impact 2025 individual MA membership by a few hundred thousand.
CEO Commentary:
🔸 "We delivered strong results in Q3, exceeding EPS and revenue estimates. While we anticipate membership reductions in 2025 due to strategic exits, we remain confident in our competitive positioning."
Strategic Highlights:
🔸 Individual Medicare Advantage plan adjustments, including exits from select markets, align with long-term strategic goals.
🔸 Management affirms that competitive positioning remains solid, despite near-term membership adjustments.
33

2Ano·
$HUM (+0,53%) for this week.👍💫 target on 250. Now can't share pict from signal indicators. Why can be? I dont know why? This is my portfolio for and to be good with getquin. Thank you
22
Títulos em alta
Principais criadores desta semana
Dados tempo real da LSX · Dados financeiros e EOD da FactSet