
Caterpillar
Price
Discussione su CAT
Messaggi
133




𝐂𝐚𝐭𝐞𝐫𝐩𝐢𝐥𝐥𝐚𝐫: 𝐐𝟑 𝐄𝐚𝐫𝐧𝐢𝐧𝐠𝐬 𝐚𝐧𝐝 𝐑𝐞𝐯𝐞𝐧𝐮𝐞 𝐁𝐞𝐚𝐭 𝐄𝐬𝐭𝐢𝐦𝐚𝐭𝐞𝐬, 𝐏𝐨𝐰𝐞𝐫 𝐆𝐞𝐧𝐞𝐫𝐚𝐭𝐢𝐨𝐧 𝐒𝐮𝐫𝐠𝐞
⠀
📊 𝐑𝐞𝐬𝐮𝐥𝐭𝐬
• Adj. EPS: $7.20 (Est. $7.03) ✅, +45% YoY.
• Revenue: $20.68B (Est. $20.69B) ❌, +17% YoY.
• GAAP EPS: $7.13 (vs. $4.88 YoY).
• Operating Profit: $4.21B, +38% YoY.
• Operating Margin: 20.4%, +310 bps YoY.
• Adj. Operating Margin: 20.6%, +310 bps YoY.
• Operating Cash Flow: $4.4B.
• Cash Balance: $7.9B.
⠀
📌 𝐊𝐞𝐲 𝐓𝐚𝐤𝐞𝐚𝐰𝐚𝐲𝐬
• Q3 adjusted EPS beat consensus by ~2.4%, while revenue was essentially in line.
• Power & Energy revenue increased 18% to $8.78B, with segment profit up 31% to $2.14B.
• Power Generation sales surged 30% to $3.42B, driven by turbines and large engines, primarily for data center applications.
• Construction Industries revenue rose 18% to $7.98B, with profit increasing 33%.
• Resource Industries revenue increased 15% to $4.62B, with profit up 14%.
• North American revenue grew 24%, while Asia/Pacific declined 2%.
• Higher sales volumes and favorable pricing drove operating margin expansion.
• Returned $1.9B to shareholders through $1.2B in buybacks and $0.7B in dividends.
• Q3 operating profit included $128M in tariff recoveries.
⠀
💬 𝐌𝐚𝐧𝐚𝐠𝐞𝐦𝐞𝐧𝐭 𝐂𝐨𝐦𝐦𝐞𝐧𝐭𝐚𝐫𝐲
“Our third-quarter results reflect the durability of our end markets, with strong order rates and a record backlog.”

Make it make sense👍
Info
So, the next purchases have been made—here’s a brief overview of the structure.
95% goes into securities, just under 2.5% into gold, and 2.5% into fixed-income securities.
Of that, just under 78% is in ETPs and the remaining 22% in stocks.
As for sector weighting, currently just under 28% is in financials, 22% in information technology, 9% in semiconductors, 8% in real estate stocks, and ~6% in major banks; the rest is further diversified.
What is the goal? Well, part of the goal is to preserve and grow capital—as we all know.
To that end, my father and I decided to use a ready-made ETF ($GERD (-0,4%) ) that has a weighting of just under 75%. About 5% is in gold and an overnight swap. The remaining 20% consists of individual stocks, such as $MP (-0,55%) ,$PG (+0,95%) ,$JNJ (+1,3%) , $CAT (-9,89%) or even $KHC (+0,01%) .
How do we determine which stocks to include in the portfolio—specifically, the background stocks required for Ki, such as $MP (-0,55%)
$CMS (+1,67%)
$CRWD (+2,24%)
$RKLB (-1,64%)
$SYM (-1,04%) and $AVGO (-3,21%) . The key factors for these companies are, first and foremost, energy consumption, security, raw materials, robotics, and systems.
However, we’ll also include a few standard holdings in the portfolio, such as $SHEL (+2,23%)
$MCD (+2,55%)
$TSLA (-1,32%)
$CVX (+1%) or $BAC (+0,55%) . Since, in our opinion, these are strong and important fundamentals.
As I said, in a few days there will most likely be a portfolio post where you can critique it however you like.
This is currently our decision and strategy, and thanks to it, we’re already up nearly 20k in profit since our first purchases this week.
Best regards. ✌🏻

What do you want from us?
You're just doing your own thing anyway.

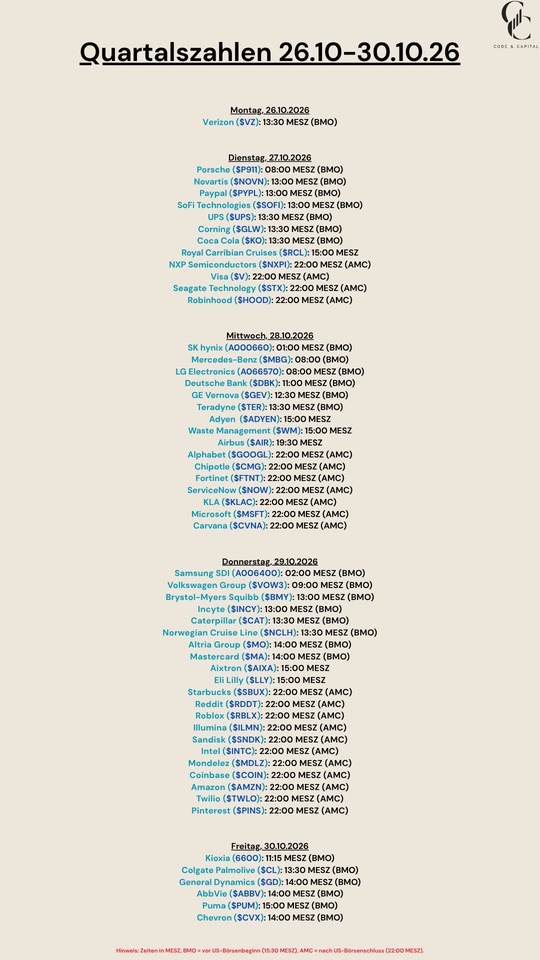
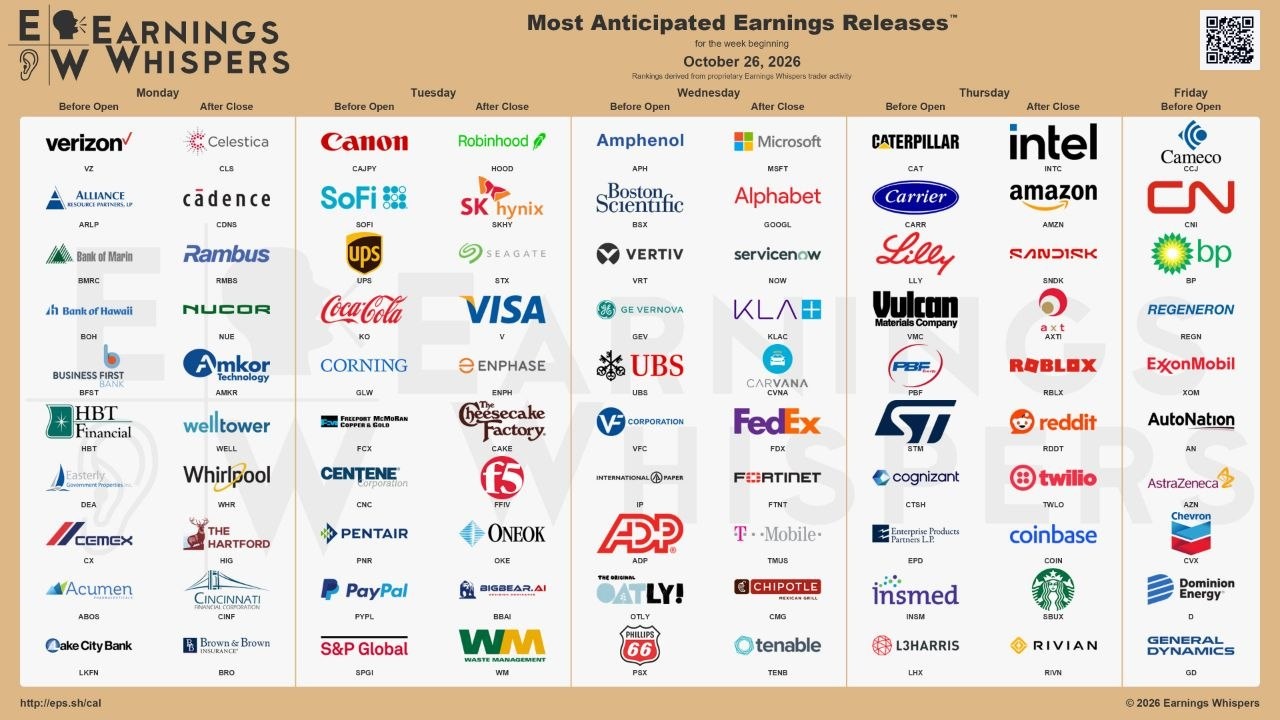
Quarterly Results: Oct. 26–30, 2016
$VZ (+1,03%)
$P911 (+2,89%)
$NOVN (+3,46%)
$PYPL (+1,74%)
$SOFI (+0,79%)
$UPS (+1,32%)
$GLW (-5,64%)
$KO (+0,99%)
$RCL (+3,52%)
$NXPI (+2,94%)
$V (+2,27%)
$STX (-1,3%)
$HOOD (-2,89%)
$SKHY (-3,14%)
$MBG (+1,66%)
$DBK (+3,22%)
$GEV (-0,5%)
$TER (-7,39%)
$ADYEN (-0,36%)
$WM (+3,02%)
$AIR (+1,19%)
$GOOGL (-3,28%)
$CMG (+0,54%)
$FTNT (+6,84%)
$NOW (-12,78%)
$KLAC (-1,03%)
$MSFT (-6,52%)
$CVNA (+6,93%)
$006400
$VOW3 (+1,14%)
$BMY (+0,86%)
$INCY (-0,29%)
$CAT (-9,89%)
$N1CL34
$MO (+4,91%)
$MA (+4,49%)
$AIXA (+8,38%)
$LLY (+5,92%)
$SBUX (-1,03%)
$RDDT (-20,29%)
$RBLX (-18,62%)
$ILMN (-12,81%)
$SNDK (-6,48%)
$INTC (-23,14%)
$MDLZ (+4,96%)
$COIN (-3,57%)
$AMZN (-10,47%)
$TWLO (-18,59%)
$PINS (-14,56%)
$285A (-2,97%)
$CL (+1,84%)
$GD (+4,05%)
$ABBV (+1,88%)
$PUM (+0,48%)
$CVX (+1%)


The Week Ahead
Monday, Oct. 26
🇩🇪 10:30 a.m. – Germany: ifo Business Climate Index (Oct.)
🇺🇸 1:30 p.m. – U.S.: Chicago Fed National Activity Index (Sept.)
🇺🇸 3:30 p.m. – U.S.: Dallas Fed Business Index (Oct.)
Tuesday, Oct. 27
🇪🇺 10:00 a.m. – Eurozone: M3 Money Supply & Lending (Sept.)
✈️ 12:30 p.m. – U.S.: Boeing (Q3 Earnings)
🇺🇸 1:30 PM – U.S.: Durable Goods Orders (Sep.)
🇺🇸 2:00 PM – U.S.: FHFA House Price Index (Aug.)
🇺🇸 3:00 PM – U.S.: Conference Board Consumer Confidence (Oct.)
🇺🇸 3:00 PM – U.S.: New Home Sales (Sep.)
🪶 10:00 PM – Robinhood (Q3 earnings)
Wednesday, Oct. 28
🇩🇪 8:00 AM – Germany: GfK Consumer Climate (Nov.)
🇨🇦 2:45 PM – Canada: Bank of Canada Interest Rate Decision
🇺🇸 7:00 PM – US: Fed Interest Rate Decision (FOMC) 🌶
🇺🇸 7:30 PM – U.S.: Fed press conference (Kevin Warsh)
🤑 9:00 PM – U.S.: Alphabet & Microsoft (Q3 earnings)
Thursday, Oct. 29
🇪🇺 11:00 a.m. – Eurozone: Economic and Industrial Confidence (Oct.)
🇺🇸 1:30 p.m. – U.S.: Q3 2026 GDP (1st estimate) & Personal Consumption
🇺🇸 1:30 PM – U.S.: Initial Jobless Claims
🇪🇺 2:15 PM – Eurozone: ECB Interest Rate Decision 🌶
🇪🇺 2:45 PM – Eurozone: ECB press conference (Christine Lagarde)
💵 9:00 PM – U.S.: Amazon & Intel (Q3 earnings)
Friday, Oct. 30
🇯🇵 12:30 a.m. – Japan: Tokyo CPI & Unemployment Rate
🇩🇪 10:00 a.m. – Germany: Q3 2026 GDP (1st estimate)
🇪🇺 11:00 a.m. – Eurozone: Q3 2026 GDP (1st estimate) & Unemployment Rate
🇩🇪 2:00 p.m. – Germany: CPI Inflation (Oct., preliminary)
🇺🇸 2:45 PM – U.S.: Chicago Purchasing Managers’ Index (Oct.)
🇺🇸 8:30 PM – U.S.: CFTC Commitments of Traders (COT Report)
$HOOD (-2,89%)
$BA (+2,61%)
$MSFT (-6,52%)
$INTC (-23,14%)
$SKHY (-3,14%)
$V (+2,27%)
$CCO (-0,15%)
$GOOG (-3,13%)
$GOOGL (-3,28%)
$SNDK (-6,48%)
$XOM (+0,88%)
$CVX (+1%)
$SNDK (-6,48%)
$VZ (+1,03%)
$COIN (-3,57%)
$SBUX (-1,03%)
$7751 (+0,21%)
$BP. (+1,4%)
$CAT (-9,89%)

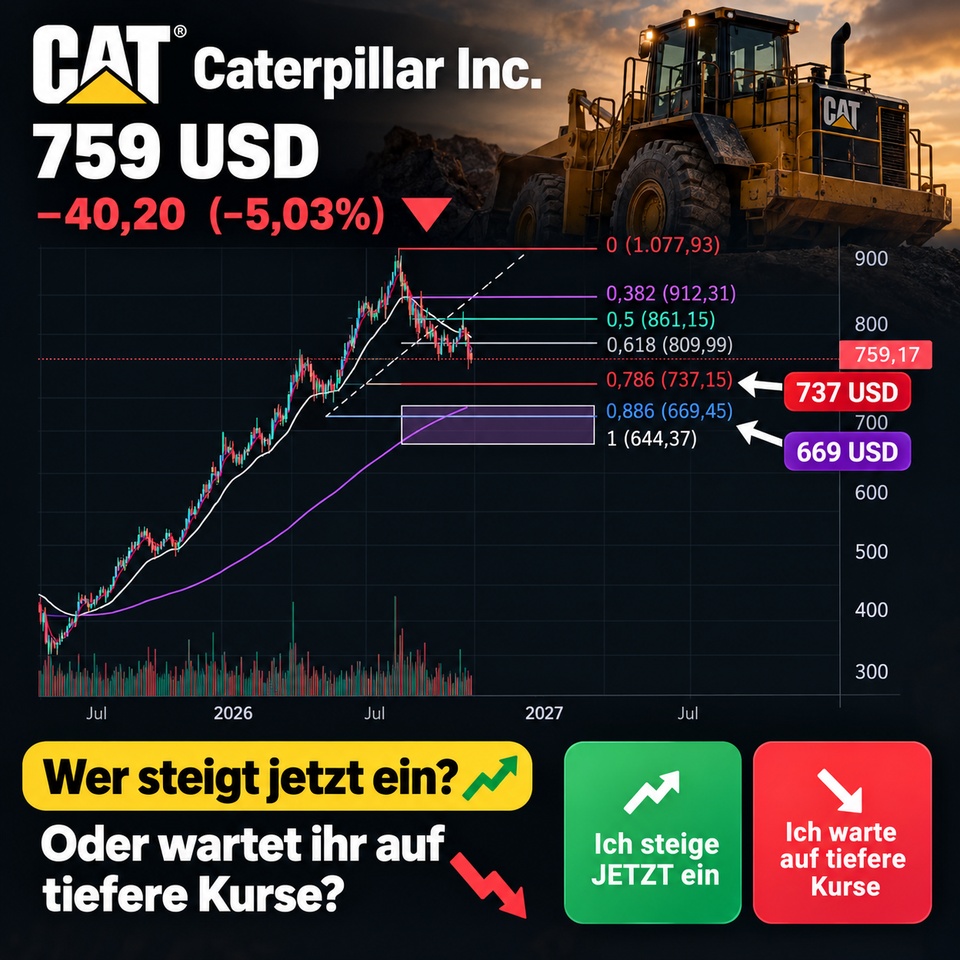
📉 Caterpillar (CAT): Should you buy now or wait for lower prices?
📉 Caterpillar $CAT (-9,89%)
–5% | $759
📊 Next support levels at $737 and $669.
👀 Who among you is buying now, and who is waiting for lower prices?


Inspired by the Steel Buddies from Morlock Motors
Hello, everyone,
Inspired by Morlock Motors’ Steel Buddies, today we’re featuring a company spotlight for the tough guys and girls.
But Caterpillar, too, $CAT (-9,89%) investors should be thrilled, too.
(@Simpson )
Updated Luftfrisch Copy (without NEW) in German
My friends, how excited are you?
Oshkosh Corp. stock rises on strong quarterly results
(August 29, 2026)
Oshkosh Corp. stock is benefiting from a jump in earnings in the most recent quarter and a solid analyst consensus, while institutional investors continue to build out their positions.
According to a recent report by MarketBeat Oshkosh reported earnings per share (EPS) of $2.87 in the most recent quarter, compared to the market’s expectation of $2.63, meaning the company beat the consensus by $0.24 (quarter ending June 30, 2026).
During the same period, Oshkosh generated quarterly revenue of $2.92 billion, representing a 6.7 percent increase compared to the same quarter a year ago and underscoring operational strength in its core segments.
The data from the report also shows that the dividend policy has been maintained: For the current year, an annualized dividend of $2.28 will be paid based on a quarterly dividend of $0.57 per share, which corresponds to a yield of approximately 1.5 percent on the current share price.
Institutional investors are increasing their positions
The same market overview highlights that Kingsview Wealth Management established a new position of 38,507 Oshkosh shares worth approximately $5.91 million in the second quarter of 2026, while a total of approximately 92.36 percent of the outstanding shares are held by institutional investors and hedge funds.
For investors, the combination of a rising institutional ownership share and earnings expectations that have been exceeded is particularly relevant, as it signals confidence in the business model and lays the foundation for further upside potential.
Die Oshkosh-Corp.-Aktie legt nach starken Quartalszahlen zu
How Innovation and Defense Contracts Are Driving Growth
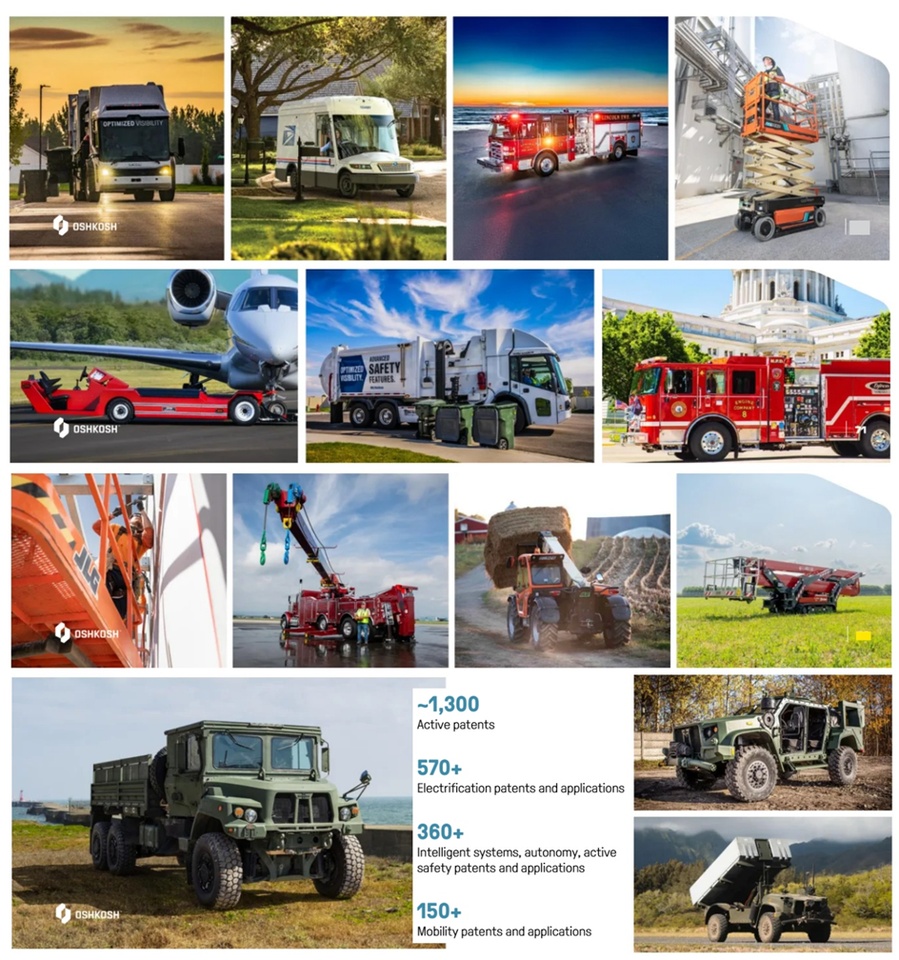
Oshkosh is the leading manufacturer of access equipment, specialty vehicles, and military trucks. The company is strategically focusing on forward-looking technologies such as the electrification of its vehicle fleet and autonomous driving capabilities. The ongoing demand for military vehicles ensures growth.
Oshkosh Corporation is an industrial and technology company focused on the design, development, and manufacture of specialty vehicles and equipment. The company operates in three business segments: Access, Vocational, and Transport. The “Access” segment designs and manufactures access and material-handling equipment for use in various sectors—including construction, industry, agriculture, landscaping, and maintenance—to position workers and materials at heights, under brands such as JLG and SkyTrak. The segment’s customer base includes equipment rental companies, construction companies, manufacturing companies, and home improvement stores. The “Vocational” segment includes the brands Pierce, Maxi-Metal, Oshkosh AeroTech, Oshkosh Airport Products, McNeilus, IMT, Oshkosh S-Series, and others. The “Transport” segment designs, manufactures, and maintains world-class specialty vehicles and mobility systems for the U.S. Department of Defense (DoD) as well as for authorized foreign customers.
Number of employees: 18,400
Q2_2026_Earnings_Slides_FINAL.pdf
Secretary of War Pete Hegseth Visits Oshkosh Corporation and Highlights the Strength of American Manufacturing and the Arsenal of Freedom
08/24/26
Oshkosh Defense demonstriert On-Demand-Fertigung von Ersatzteilen in Japan
- Investing.com
- Aug. 12, 2026
Oshkosh investiert in KI-Spezialisten Nextera Robotics für Baustellenautomatisierung
- Investing.com
- Aug. 6, 2026
Oshkosh Corporation berichtet Ergebnisse des zweiten Quartals 2026
March 30, 2026
Die Oshkosh Corporation wurde zum achten Mal in Folge mit dem CIO 100 Award 2026 ausgezeichnet
Revenue Breakdown by Business Segment:
2025 (USD)
Access 4.49 billion
Vocational 3.73 billion
Transport 2.1 billion
Corporate and Other 104 million
Geographic Revenue Breakdown:
2025 (USD)
United States 8.56 billion
Europe, Africa, and the Middle East 1.12 billion
Rest of the World 376 million
Other North America 366 million
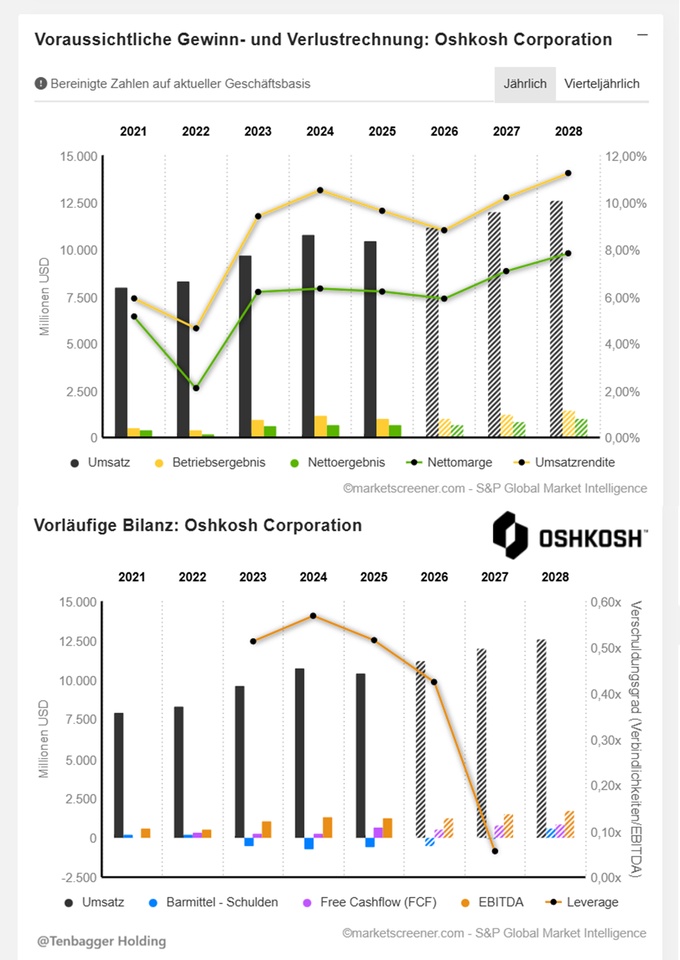
📈 Performance at a Glance
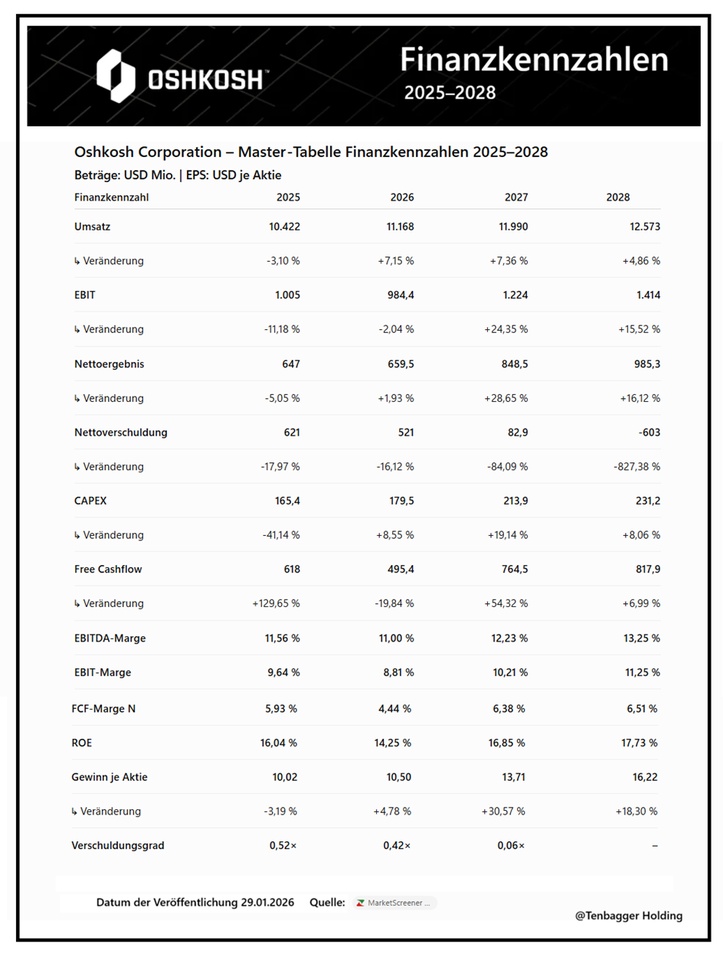
Revenue:
10,422 → 11,168 → 11,990 → 12,573 million USD
EBIT:
1,005 → 984 → 1,224 → 1,414 million USD
Net income:
647 → 660 → 849 → 985 million USD
FCF:
618 → 495 → 765 → 818 million USD
EPS:
10.02 → 10.50 → 13.71 → 16.22 USD
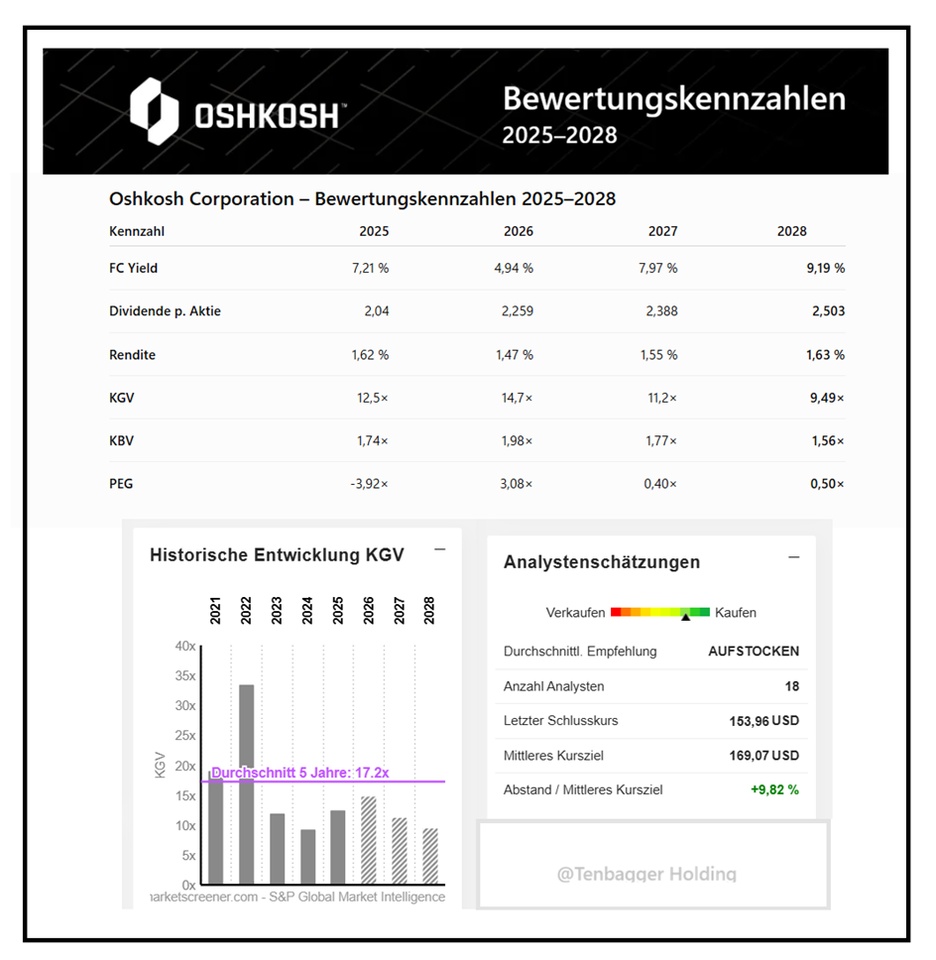
Particularly striking is the significant improvement starting in 2027: EBIT, net income, and EPS are accelerating sharply, while at the same time net debt is falling from 621 million USD in 2025 to -603 million USD in 2028 . A negative value here means that, based on this metric, Oshkosh is expected to have a net cash position .
📊 Performance at a Glance
- FC Yield: 7.21% → 4.94% → 7.97% → 9.19% ↗
- Dividend: 2.04 → 2.259 → 2.388 → 2.503 ↗
- Yield: 1.62% → 1.47% → 1.55% → 1.63%
P/E ratio: 12.5× → 14.7× → 11.2× → 9.49× ↘- P/B ratio: 1.74× → 1.98× → 1.77× → 1.56× ↘
- PEG: −3.92× → 3.08× → 0.40× → 0.50×
🟢 Brief Assessment
According to current MarketScreener forecasts, Oshkosh’s valuation become significantly more attractive starting in 2027:
- P/E ratio for 2028 at just 9.49×
2028 P/B ratio of just 1.56×
PEG for 2027/28 at 0.40× and 0.50×, respectively- At the same time, the FC yield rises to 9.19%
- The dividend rises steadily from $2.04 to $2.503
From a valuation perspective, this is an interesting combination of earnings growth and declining multiples.
August 31, 2026, 4:51:31 PM •
Lang & Schwarz (EUR)
132.90 EUR
+12.25 EUR +10.15%
+ 3




Caterpillar with a Monster Beat!
Here's the hot stuff from Caterpillar Inc.
$CAT (-9,89%) (NYSE: CAT) Q2 2026 Earnings Release, delivered fresh on August 4, 2026, before the U.S. markets opened:
🚀 Top-Line Performance & All-Time Record
Caterpillar, the world’s largest construction equipment and industrial giant, broke every record in the company’s history in the second quarter of 2026 and blew Wall Street estimates out of the water:
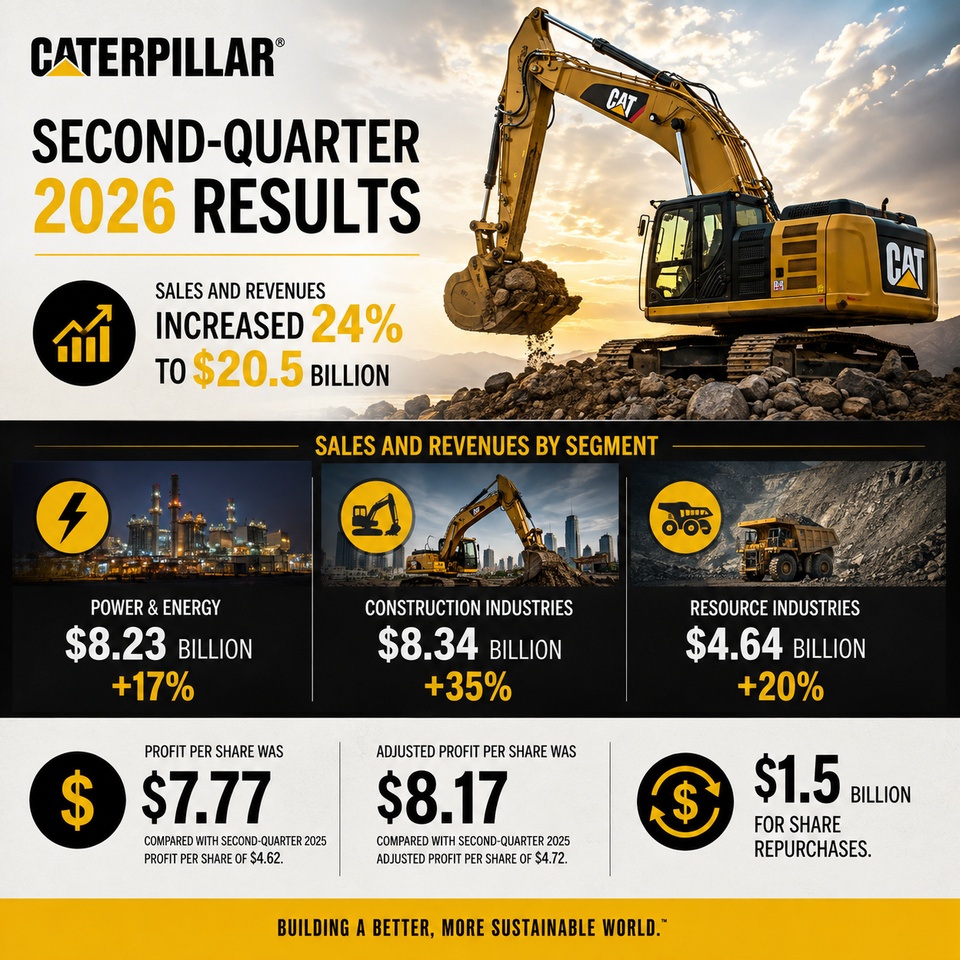
Total Revenue (Sales & Revenues): Soared by +24% YoY to $20.5 billion (up from $16.6 billion in the prior year).
A historic milestone: For the first time in its more than 100-year history, Caterpillar has surpassed the $20 billion in revenue in a single quarter!
Growth drivers: Higher sales volume (+$3.1 billion) and strong pricing (+$595 million). Strong new order intake leads to a further increase in the order backlog across all three primary segments (Construction, Resource Industries, Energy & Transportation).
🔮 Explosive Profitability & Record Margins
In terms of earnings, the industrial giant demonstrates an almost uncanny level of operating leverage:
Adjusted Diluted EPS: Soared by +73% YoY to $8.17 (up from $4.72 in the prior year)—an absolutely massive beat compared to market expectations!
GAAP EPS: Came in at $7.77 (compared to $4.62).
Operating Profit: Climbed by +50% YoY to $4.3 billion.
Adjusted Operating Margin: Expanded significantly by 430 basis points to 21.9% (compared to 17.6% in the same quarter last year).
🤖 Generous cash returns to shareholders
Caterpillar is consistently leveraging its robust cash flows to create value for shareholders:
Capital returns: In the second quarter of 2026 alone, $2.2 billion was distributed to shareholders through share buybacks and dividends.
Balance Sheet Strength: Strong cash generation ensures the continuation of long-standing shareholder returns.
⚡ 💡 Jack’s Take
An absolutely monster earnings report in a class of its own! Caterpillar is making a huge statement with over 20 billion USD in quarterly revenue and a +73% jump in EPS to $8.17. Anyone who thought the global cycle in heavy equipment manufacturing was weakening is being proven wrong by the construction boom, mining demand, and the enormous energy requirements for data centers and infrastructure. Caterpillar is and remains the undisputed bulldozer of the global economy!

𝐂𝐚𝐭𝐞𝐫𝐩𝐢𝐥𝐥𝐚𝐫: 𝐅𝐢𝐫𝐬𝐭 𝐄𝐯𝐞𝐫 $𝟐𝟎𝐁+ 𝐐𝐮𝐚𝐫𝐭𝐞𝐫 𝐚𝐬 𝐃𝐚𝐭𝐚 𝐂𝐞𝐧𝐭𝐞𝐫 𝐚𝐧𝐝 𝐏𝐨𝐰𝐞𝐫 𝐃𝐞𝐦𝐚𝐧𝐝 𝐅𝐮𝐞𝐥 𝐆𝐫
⠀
📊 𝐑𝐞𝐬𝐮𝐥𝐭𝐬
• EPS: $7.77 vs. $6.20 est. ✅
• Adjusted EPS: $8.17
• Revenue: $20.54B vs. $19.20B est. ✅
• Operating margin: 20.9% (vs. 17.3% Y/Y)
• Operating cash flow: $4.4B
• Returned $2.2B to shareholders ($1.5B buybacks + $0.7B dividends)
• First quarter in company history with more than $20B in sales and revenue
⠀
🎯 𝐆𝐮𝐢𝐝𝐚𝐧𝐜𝐞
• No formal revenue or EPS guidance provided.
• Management highlighted strong order rates, a growing backlog, and broad momentum across all three core business segments.
⠀
📌 𝐊𝐞𝐲 𝐓𝐚𝐤𝐞𝐚𝐰𝐚𝐲𝐬
• Sales rose 24% Y/Y to $20.54B, driven by $3.1B of higher volume and $595M of favorable pricing.
• Construction Industries revenue jumped 35%, Power & Energy grew 17%, and Resource Industries increased 20%.
• Power Generation demand remained strong, supported by data center applications.
• Operating profit climbed 50% to $4.30B, benefiting from higher sales volumes.