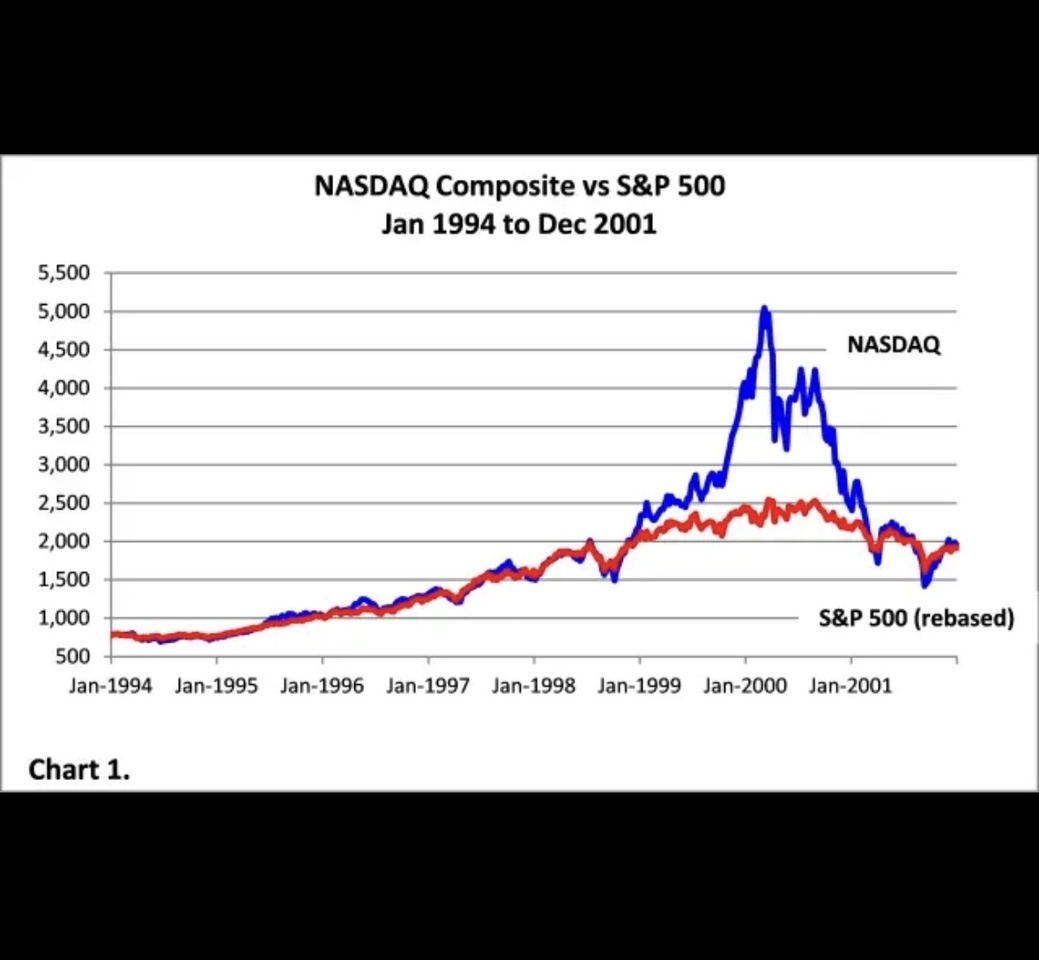
I think a lot of people just don't want to look at it and would rather keep scrolling because they don't want to hear about what happened over 20 years ago. Maybe it's also because they believe you can't compare that time to today.
But that's not the point.
A brief look back at stock market history for you
Over 20 years ago, the world was different. Education was different, technology was different, the mindset was different, the financial world was different, industry was different, and so on.
History is history, but we can still learn from it. It’s not just investors who do this—entrepreneurs and entire nations do as well. We look to the past to better position ourselves for the future and, as much as possible, avoid repeating the same mistakes.
But there’s never 100% certainty.
In ancient Rome, 2,000 years ago, no one would have imagined that 1,400 years later, people would in some cases be walking through muddy streets again—even though the Romans had long since built paved roads and sewer systems.🏛️
And 500 years later? Rockets from $SPCX (+2,6%) landing back on Earth on their own.
So what happened after the dot-com bubble burst?
After the dot-com bubble peaked in March 2000, the Nasdaq went into a downward spiral for nearly two and a half years.
To recap briefly:
By October 2002, the Nasdaq Index had lost about 78% of its value.
Microsoft was one of the world’s largest technology companies at the time. The company dominated the PC market with Windows and Office. Nevertheless, its stock lost a massive amount of value. Antitrust proceedings also weighed on the company.
The company continued to make money, kept evolving, and built out new business areas in the years that followed. Later, the cloud business—particularly Azure became a key growth driver.
- $MSFT (-2,16%) It wasn’t until 2016 that the stock reached its 2000 all-time high again.
Amazon was still primarily an online retailer at the time. During the crash, the company temporarily lost over 90% of its market value. Many investors doubted whether Amazon would even survive in the long term. But Amazon survived.
The company improved its cost structure, posted an annual profit for the first time in 2003, and over the next few decades grew into one of the world’s largest corporations. In 2006, AWS—which would later become the cloud business.
- $AMZN (-0,11%) reached its ATH in 2009
Apple had gone through some difficult years. Steve Jobs had returned in 1997, and the iMac was released in 1998. But the big breakthrough didn’t come until after the crash. The iPod followed in 2001, and the iPhone in 2007.
- $AAPL (-0,47%) Reached its all-time high in January 2005
Nvidia didn’t go public until 1999. At the time, Nvidia was known primarily for graphics chips. Nvidia, too, was hit hard by the crash. While many other companies disappeared, Nvidia continued to develop its technology. Over the decades, the former graphics card manufacturer evolved into one of the world’s leading semiconductor companies. After the crash, it took Nvidia 6 years—
- $NVDA (-1,49%) to reach its previous high in November 2006.
At that time Google, now Alphabet $GOOGL (-1,42%) wasn’t even publicly traded during the crash. The company was founded in 1998 and didn’t go public until 2004—right in the middle of the recovery phase. With Google’s search engine and advertising business, GOOGL became one of the largest technology companies.
Cisco
$CSCO (+0,09%) manufactured routers and network switches during the dot-com bubble that were crucial for the expansion the Internet. The company was thus among the biggest beneficiaries of the Internet boom at that time.
Similar to today’s suppliers? Perhaps not.
Cisco was at times the most valuable company during the dot-com bubble. When the bubble burst, the stock lost about 89% of its value.
It wasn’t until about 25 years later (last year) that the stock reached its all-time high from back then again!
- This shows just how far into the future expectations stretched back then. As early as 2000, investors were already paying prices that wouldn’t be paid again until 25 years later.
The interesting thing is that the Internet didn’t disappear just because the dot-com bubble burst. On the contrary. The Internet became increasingly important—and even more so. It’s just that expectations for many companies back then were far too high.
And what about the other industries?
While many tech stocks plummeted, there were also companies that weathered this period relatively well.
Coca-Cola
$KO (-0,48%) is a good example of how even outstanding companies are no guarantee of rising stock prices. The stock had already experienced a massive surge even before the dot-com crash. Over the preceding decades, Coca-Cola had delivered exceptional returns to its shareholders. In 1998, the stock reached its peak at that time. The P/E ratio was at times over 50. Coca-Cola then lost about half of its market value.
Not because suddenly no one wanted to drink Coca-Cola anymore, but because… you know. A P/E ratio of 50 is already a good clue.
What happened to the big banks?
While the tech sector was under pressure, many banks initially performed significantly better. JPMorgan
$JPM (-2,42%), Bank of America
$BAC (-0,98%) and Wells Fargo
$WFC (-1,98%) were among the big names in the American financial sector.
Traditional banking continued as usual. People needed loans, companies needed financing, and the banks continued to earn money from interest and fees.
However, not all banks followed the same trajectory.
Investment banks, in particular, were also affected by the collapse of the financial markets. In the years that followed, the banking sector increasingly benefited from the economic recovery, lending, and the booming real estate market.
By 2006 and 2007, respectively, many bank stocks had posted strong gains.
And then it came… 2008, the financial crisis.
But that’s not the topic here
And traditional industries?
Things kept moving forward outside the tech sector as well. Companies like Caterpillar
$CAT (-0,54%), 3M
$MMM (-0,79%) and General Electric
$GE (+0,08%) were already big names back then.
In particular, Caterpillar benefited in the years following the crash from rising demand for construction equipment, raw materials, and infrastructure. China’s economic boom and industrialization played a key role in this.
- $CAT (-0,54%) lost about 48% during the crash and recovered three years later. In 2003,
General Electric , on the other hand, was an example of how size alone offers no protection. The conglomerate was one of the world’s most valuable companies in 2000, but it also struggled with a high valuation and, later, with problems in its financial division.
$GE (+0,08%) It reached its all-time high again in 2007.
The global economy continued to grow, new investments were made, and other sectors came more into focus.
How did the stock markets perform?
After hitting a low in October 2002, a new uptrend began. The S&P 500 and the Dow
Jones rebounded in the following years and reached new highs again in 2007.
The Nasdaq, on the other hand, took significantly longer. The Nasdaq reached its March 2000 high as late as 2015 .
This means that investors who were at the peak had to wait about 15 years for a full nominal price recovery.
- Nevertheless, following the dot-com crash, the Nasdaq Index: 12.1% per year until the 2015 all-time high (ATH)—excluding dividends
How expensive was the Nasdaq-100 back then?@Simpson
The Nasdaq itself has published an interesting historical comparison on this topic. At the end of 1999, the estimated P/E ratio of the Nasdaq-100 was already at approximately 104! At its peak in early 2000, the P/E ratio may even have been between 150 and 200 .
I know I said this isn’t about comparisons, but here’s a quick one:
For comparison: In November 2025 , the P/E ratio hovered around the low 30s. It is important to note, however, that the 150 to 200 figure is a historical estimate by Nasdaq and not an exact observed peak.
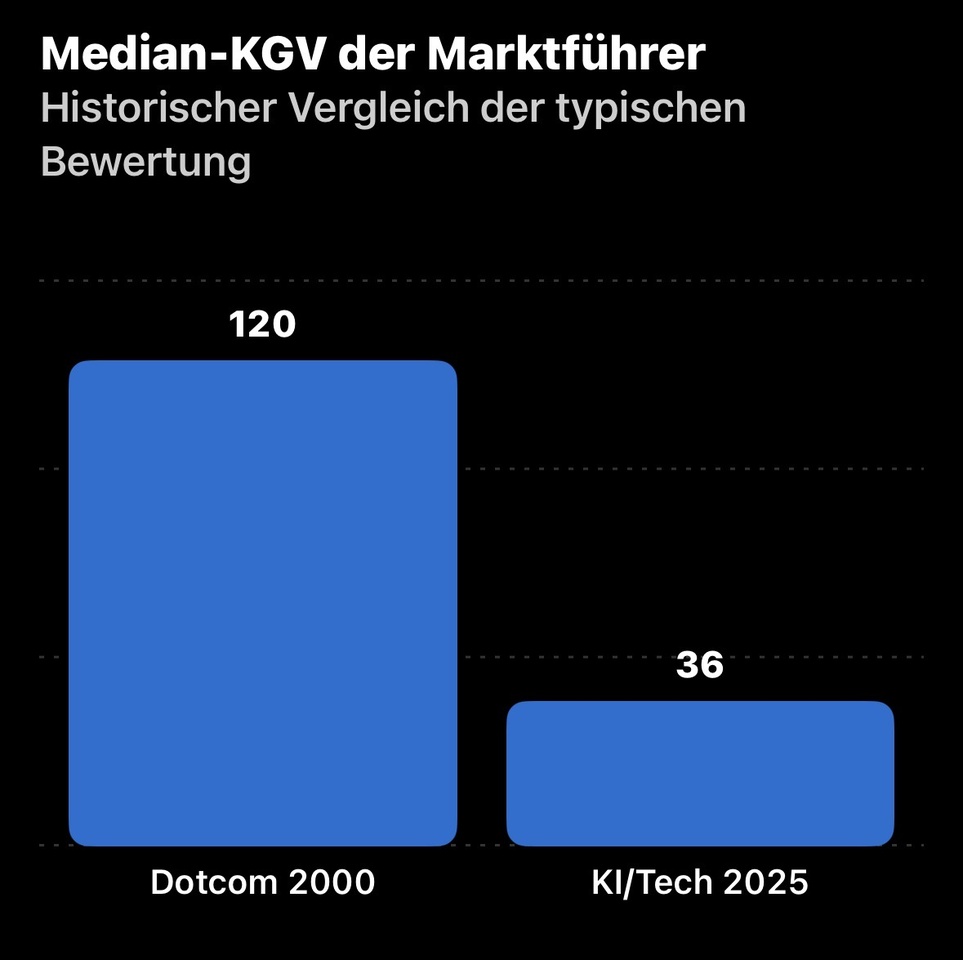
The valuations of tech companies at that time were therefore, in some cases, significantly more extreme than the valuations we have seen in recent years.
It’s also interesting to look at the inflation-adjusted Shiller P/E ratio.
The so-called CAPE takes into account the average, inflation-adjusted earnings of the past ten years.
While the standard P/E ratio primarily considers current earnings, the Shiller P/E ratioattempts to somewhat smooth out short-term earnings fluctuations.
And this is where it gets interesting.
In November 2026 , the Shiller P/E ratio for the overall U.S. market stands at approximately 40. The all-time high during the dot-com era was about 44.2.
This means the overall U.S. market’s Shiller P/E ratio is only about 10% below the record set back then.
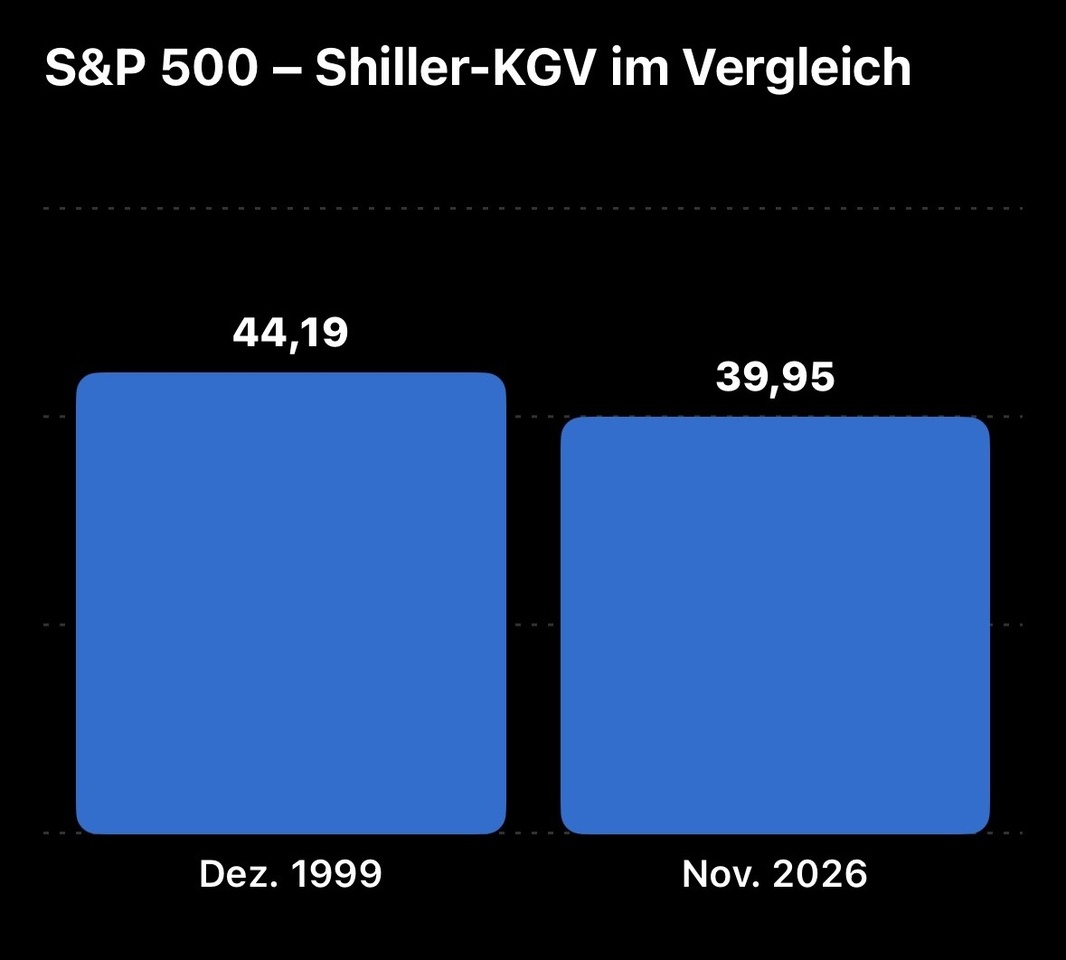
This does not automatically mean that a crash is imminent. But it does show that, from a historical perspective, the U.S. stock market is very highly valued.
Another interesting point:
U.S. key interest rates were raised between June 1999 and May 2000 a total of six times.
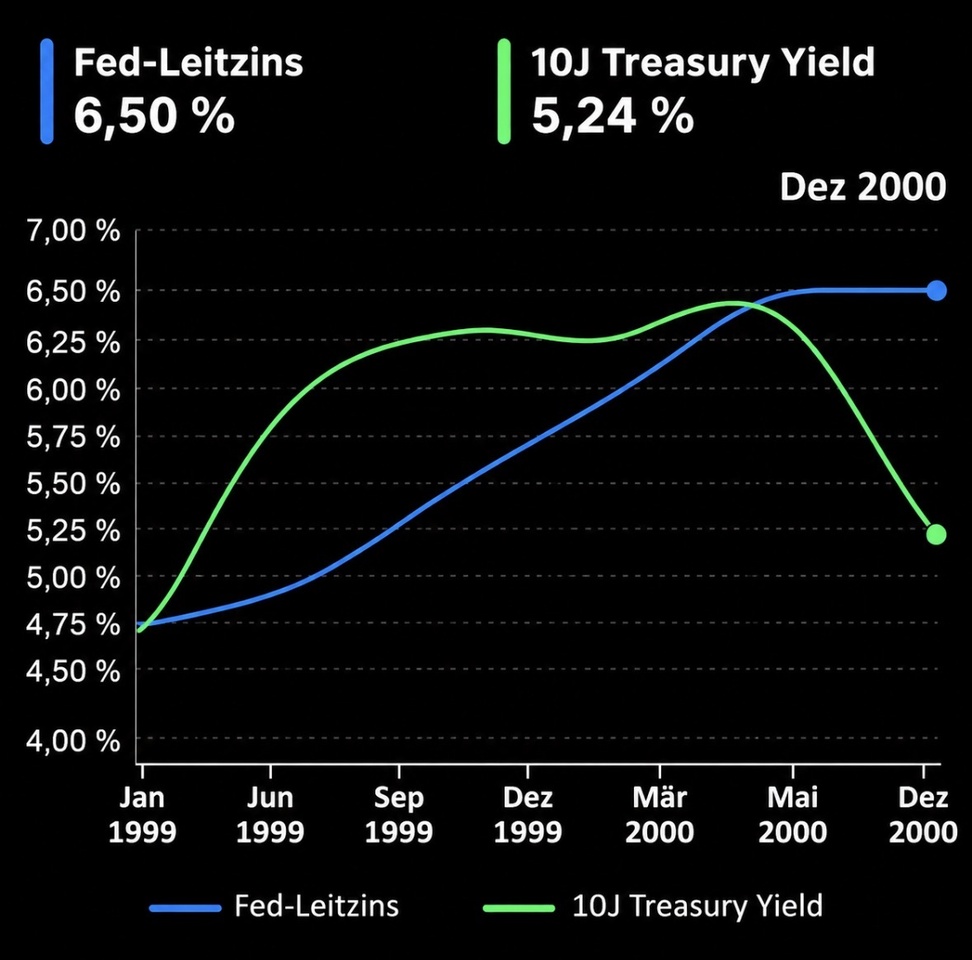
- In June 1999 interest rates stood at 4.75%
- March 2000 (start of the crash), interest rates stood at 6.00%
- At the end of 2000 at 6.5%
The Federal Reserve began lowering interest rates on January 3, 2001.
- By the end of 2001 the federal funds rate stood at 1.75%
And that’s exactly why I think it’s important to remain open to all information—even if we might not want to hear about the past.
What can we learn from this?
Everyone learns for themselves, but I think you should really dig into the material, especially if young investors are just after the big money.
If a headline with the word “dot-com” already gives you goosebumps and you’d rather keep scrolling, then maybe you should ask yourself how well you handle risk in the stock market . Perhaps a broadly diversified ETF would actually be the better choice for some.
That said, even ETFs offer no guarantee against price losses. If the entire market crashes, the corresponding ETFs will naturally lose value as well.
The stock market isn’t just made up of rising prices. Not every major innovation is automatically a good investment. And not every stock market crash means the end of a major innovation.
Sooner or later, we’ll experience another one anyway. And then at least we’ll all be in it together.
Thanks for reading :)