Reading time: approx. 9 minutes
The last few articles in this series of key figures - from the P/E ratio to the PEG ratio to EV/EBITDA and the free cash flow yield - have always dealt with the same initial question: What does a figure really mean? What is the reality behind it? And where are the blind spots of a key figure when viewed in isolation?
Debt/EBITDA fits seamlessly into this series because it makes visible a dimension that is often underestimated in traditional valuation models: Debt capital and its effect on risk, room for maneuver and enterprise value.
While EV/EBITDA shows how expensive a company is including debt, debt/EBITDA answers the other side of the same coin: Is the debt operationally sustainable?
The formula is simple:
Debt/EBITDA = net financial debt / EBITDA.
However, its significance is high - not only in absolute terms, but also depending on the context. It describes how many years a company would theoretically need to pay off its debts from operating profit before depreciation and amortization alone. And it shows how susceptible the business model is to interest rates, recessions and external shocks.
Debt/EBITDA thus forms the natural counterweight to our last article on free cash flow yield. While FCF shows what a company has left over, debt/EBITDA shows how much of it is already tied up in old liabilities.
However, this key figure can only be properly understood if two structural factors are properly taken into account:
Firstly, sector dependency.
Debt is not the same risk in all sectors. A telecommunications group or an energy supplier works with stable cash flows, long-term contracts and capital-intensive assets. Here, values of 3-4x are normal, sometimes even necessary. Capital is part of the business model, not just a by-product.
This is very different in consumer or tech, where cash flows are more flexible, margins more volatile and competition more intense. Companies like $META deliberately operate with zero net debt in order to retain maximum strategic freedom. Anything over 2x in such sectors would be a warning signal and an expression of a stress situation.
Debt/EBITDA is therefore never a universal benchmark, but a sector-specific measure of risk: stability allows higher leverage, volatility does not.
Secondly, the interest rate environment.
Debt is almost a cost-free resource in times of low interest rates (2015-2021). Many companies leveraged their balance sheet, bought back shares, financed mergers or accelerated their growth. The market tolerated leverage levels of 4-5x as long as cash flows appeared predictable.
In an environment of rising interest rates, however, the risk increases exponentially - not linearly. Refinancing becomes more expensive, covenants tighter, ratings more critical. Leverage of 4x, which was considered relaxed in 2019, can destroy operational flexibility in 2025. Debt/EBITDA must therefore always be read through the lens of the current capital market environment.
Debt is not a static risk, but a macroeconomically driven one.
Four completely different real-life examples show the extent to which the combination of sector logic and the interest rate environment has an impact.
Let's start with $KO (+1.36%) (Coca-Cola). The group operates in a defensive consumer segment with high pricing power. The business model is cash flow-strong, predictable and not very capital-intensive. It is no wonder that Coca-Cola has been operating at around 2x debt/EBITDA for years - a figure that perfectly matches the stability of the company. Here, debt is more of an instrument for optimizing the capital structure than a risk. The fact that $KO has been increasing dividends and buying back shares for decades would hardly be possible without this controlled level of debt. The decisive factor is predictability: the combination of stable demand, global brand strength and a reliable margin structure allows for moderate leverage - and at the same time keeps it sustainable in the long term.
The situation at $WBD (-0.88%) (Warner Bros. Discovery). The company operates in an industry that is simultaneously under structural pressure and requires high fixed costs. Linear TV is shrinking, streaming is scaling slowly, content is becoming more expensive and interest costs are rising. In this environment, a debt/EBITDA ratio of around 4.5-5x is more than just a balance sheet figure - it is the core of the investment case. Every rise in interest rates immediately affects the result, every operational disappointment restricts the ability to act. The sector and interest rates not only interact here, they reinforce each other. Debt/EBITDA thus becomes the decisive valuation parameter: it is not the story that decides, but the balance sheet discipline.
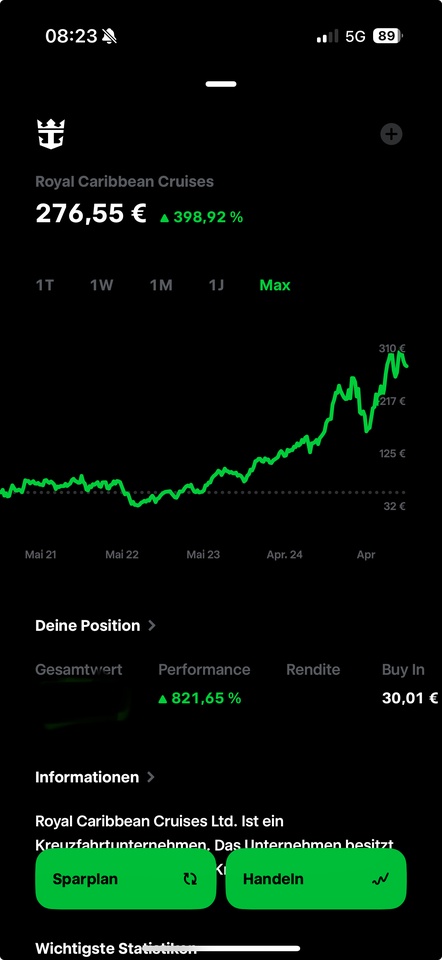
$RCL (+3.51%) (Royal Caribbean) shows a third pattern that is difficult to understand without debt/EBITDA: cyclical, capital-intensive, highly indebted - and yet capable of long-term survival. Historically, cruise companies have always been highly leveraged because they have to finance ships, maintain infrastructure and plan for years. In crises, leverage explodes in the short term (even to double-digit levels during the pandemic), but normalizes rapidly in recovery phases. Here, values of 4-6x are not necessarily threatening, but inherent to the system. The risk only arises when a crisis lasts longer than liquidity. And this is precisely why debt/EBITDA is the most important early warning system in such business models: it does not show whether a company is doing "well or badly", but whether it can survive the next crisis.
$META (-1.77%) (Meta), on the other hand, represents the opposite position: a net debt-free tech group with enormous cash flows, high growth leverage and maximum flexibility. The fact that Meta does not use debt, even though it could easily do so from a balance sheet perspective, is a strategic decision - and not just a conservative one. The company wants to be able to invest at any time without needing the credit markets. The advantage is particularly evident in an environment of rising interest rates: while other companies have to earn refinancing costs, Meta can use its operating cash flow to invest billions in data centers, AI and buybacks without harming its balance sheet. Here, debt/EBITDA does not show the risk of the past, but the potential of the future.
What can be deduced from this? Firstly, debt is not a problem per se, but only in the wrong sector, at the wrong time or with the wrong business model. Secondly, the figure must always be read in relative terms - relative to the cash flow profile, capital intensity and interest rate environment. Thirdly, an attractive P/E ratio or PEG can become irrelevant if the balance sheet leaves no room for maneuver.
Debt/EBITDA is therefore not a ratio that you "let run along", but one that often explains the difference between a value trap and a stable compounder. It combines risk and valuation into an overall logic: how much of the future is already pledged to the past?
Many companies are entering a quiet but decisive phase in these years: refinancing expires, interest rates remain higher and capital becomes more expensive again. Debt/EBITDA is thus becoming the toughest test criterion for over a decade - tougher than growth, tougher than margins and tougher than any narrative story.
This closes the bracket of our previous series of key figures. While the P/E ratio, PEG and EV/EBITDA lead into the valuation and the free cash flow yield makes liquidity visible, debt/EBITDA shows how resilient a company really is - or whether it only looks like it.
For the community, one central question remains, which continues this article:
Which industries do you tolerate with high debt/EBITDA levels - and where do you personally draw the line?