
$XDEM (+0.04%)
$XDEV (+0.17%)
$WSML (-0.37%)
$CSPX (-0.27%)
$IWDA (-0.33%)
- Markets
- ETFs
- iShares Core S&P 500 ETF
- Forum Discussion

iShares Core S&P 500 ETF
ETP
ETP
ISIN: IE00B5BMR087
Ticker: CSPX
IE00B5BMR087
CSPX
Price
Discussion about CSPX
Posts
322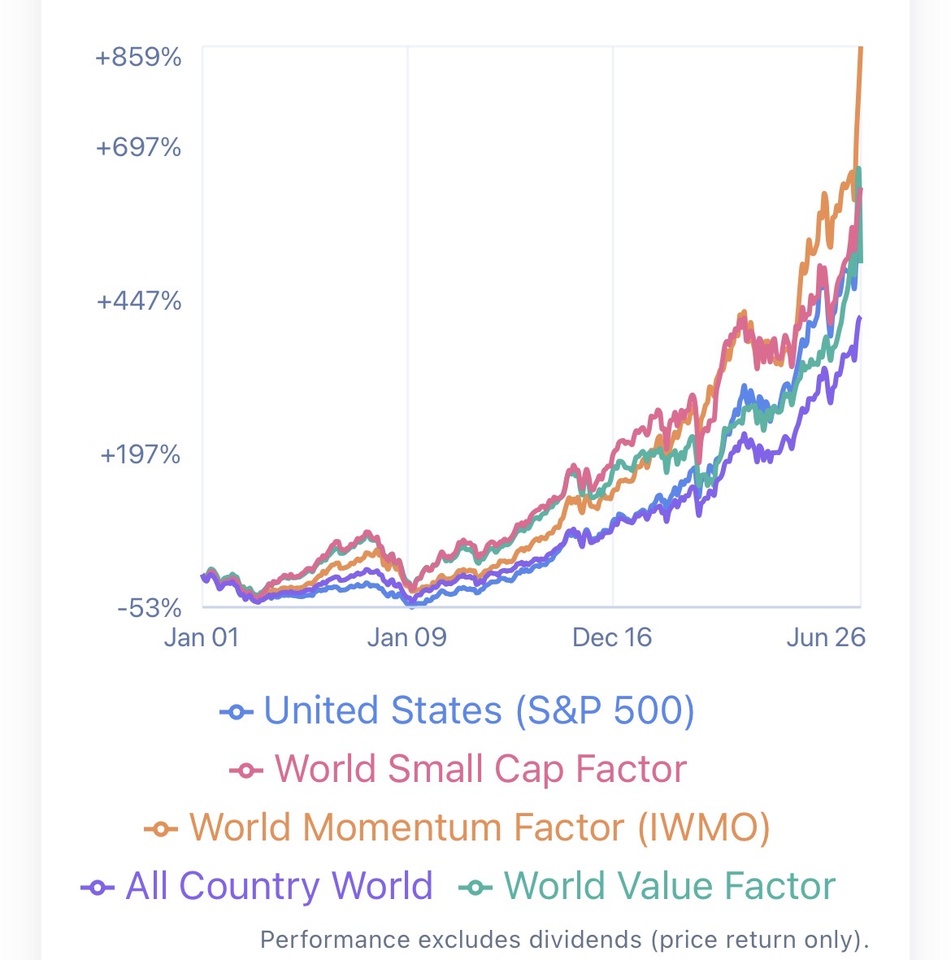


2Mon·
Strategy for buying a house
Dear Community,
I am currently in the process of buying a property and now need €70,000 from the deposit.
I'm now wondering what I should sell. I have some losers in my portfolio that I should actually sell, but it feels strange to realize all the losses.
I'm also thinking about the subsequent weighting of stocks that are performing well (such as $GOOGL (-1.31%) for example), which would increase considerably if I withdrew the €70,000.
My first thoughts would be stocks like $MC (-2.43%)
$UNH (-0.24%)
$WSIL (-1.92%)
$NVDA (-1.05%)
$COPX (+0.92%)
$CSPX (-0.27%) and parts of the $IWDA (-0.33%) to sell.
I am looking forward to your opinions!
23Positions
€224,016.30
16.23%
88
25 Comments
Sell everything in the red and halve Alphabet, Iris, Allianz and ASML. You should get 70k out of it pretty much without taxes.
•
99
•
2Mon·
Is the tech sector and therefore a large part of the US markets in a bubble? 💥 I have concerns but not fears:
At first glance, the market seems contradictory. Profits are rising, margins are reaching new highs - and yet warning signals are piling up.
So: Where do we really stand?
The fundamental basis is more solid than many people think.
Earnings expectations in the $CSPX (-0.27%) S&P 500 are rising continuously, most recently by double digits over the course of the year. Companies are earning more, working more efficiently and benefiting from structural trends such as automation and AI.
The forward P/E ratio is above the historical average - but not at a classic bubble level. Crucial:
Rising profits have underpinned a significant part of the share price increases fundamentally.
Beneath the surface, things look different.
The number of stocks with extremely high price-to-sales ratios and simultaneous price gains of over 100% has risen sharply - and now accounts for an unusually large proportion of the Russell 3000.
Historically, such concentrations have mainly occurred in late market phases: Dotcom 2000, Meme-Stocks 2021. In both cases, significant corrections followed.
The decisive difference to the dotcom era:
Back then, profits were an expectation.
Today they are reality.
The major indices are dominated by highly profitable companies with real cash flows. This reduces the risk of a complete collapse - but does not protect against significant corrections in the speculative segments.
What this means for investors:
The biggest risk lies not in a general overvaluation of the market as a whole, but in the high dependence on individual narratives - especially AI and tech. A lack of market breadth is a classic feature of late bull phases. If expectations in these segments are not met, the very areas that have recently risen the most could drag the market as a whole down with them.
Conclusion:
Solid fundamental basis + speculative exaggerations in sub-segments = a market phase that is simultaneously underpinned and vulnerable. Those who understand this can take a more differentiated position - instead of being blindly bullish or unnecessarily defensive.
And now to you: do you see the market as healthy or as a ticking time bomb? Or just like me - both at the same time? 👇
55
10 Comments
You have to be very vigilant. If signals like today's from Open AI pile up, it will very quickly go down not 2% but 30%. The bubble is different. It lies more in the circular transactions between the big players. The moment (that it comes is out of the question for me, when? no idea) when the broad market comes to the realization that the huge investments in AI are not worthwhile for the companies, it goes down very quickly. So always work with hedges. It won't be a crash, but rather a prolonged major correction of 30-40% in the tech sector.
•
55
•
2Mon·
Best investment fund?
$ADX I guys, what do you think about this fund, that has performed better, in terms of total return, than $CSPX (-0.27%)
$SPY (-0.4%) in its life?


3Mon·
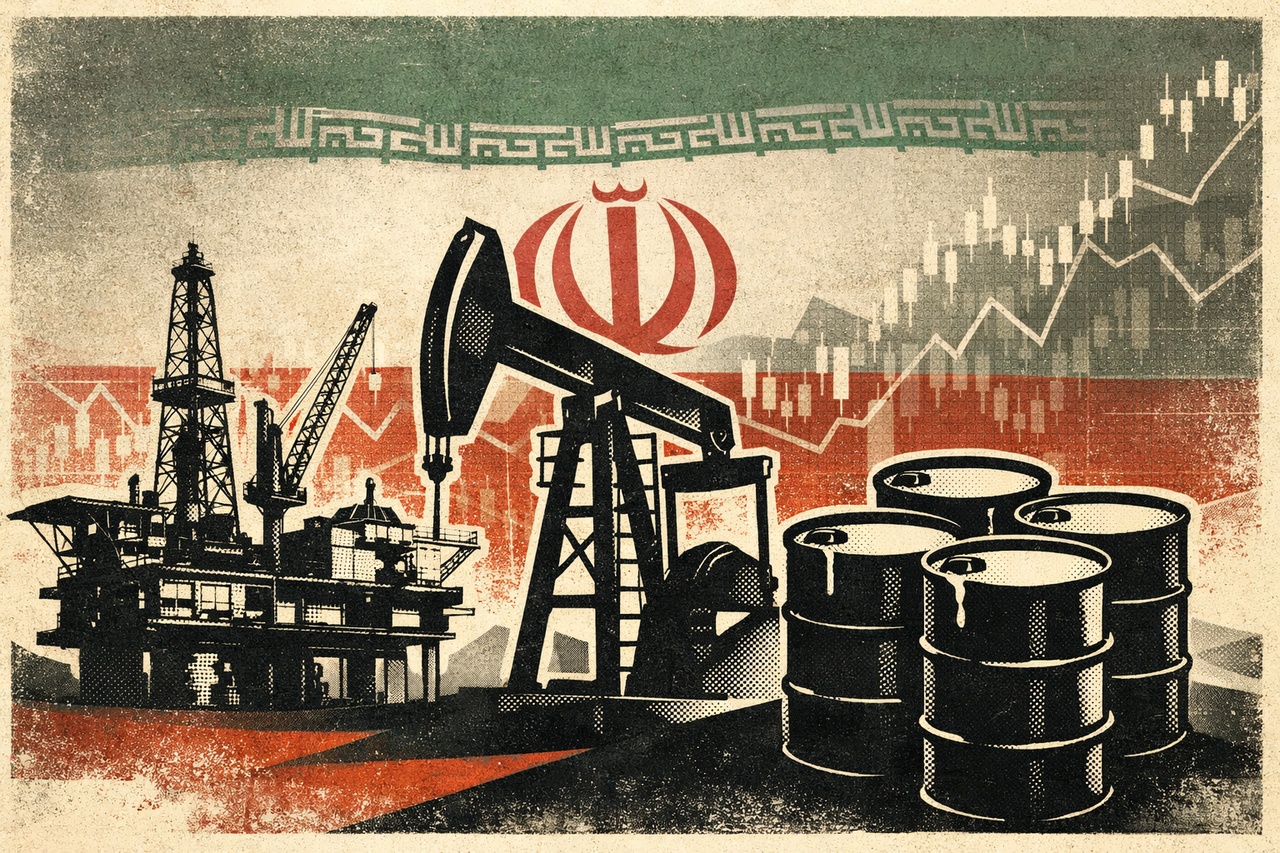
Mar 19 / Iran War — Part 2
Here’s the part many people get wrong.
Iran doesn’t need full control over the Strait of Hormuz. Their military wouldn’t even have the capabilities for that. You’d need hundreds of sea mines or thousands of drones, plus people operating them. They just need to create enough fear so that companies won’t risk a billion-dollar tanker being sunk by a $20,000 drone.
Some carriers turn off their transponders and just go through. High risk, high reward. But most operators won’t take that chance. That, and strikes on Gulf energy facilities like oil fields and refineries, led to the declaration of “Force Majeure” of some major players in the region, among them Bapco and QatarEnergy. Other countries like Iraq had to drastically reduce exploration, because they can’t store any more reserves.
And it’s not just maritime trade that’s heavily disrupted by this conflict.
Air freight is largely down as well. While Riyadh continues to operate and Dubai tries to move stranded tourists when the emirate isn’t dealing with drone strikes, many airports across the region are simply shut.
And it’s not just infrastructure either.
Residential buildings and hotels are being hit, and even data centres of companies like Amazon have reportedly taken damage.
Now add the political layer in the U.S. Trump wanted a quick victory. He needed a quick victory.
The president is running out of time. Many Americans are already critical of foreign intervention, something he promised to stop. If this now starts hitting the average consumer through higher fuel prices, midterms could get very ugly for Republicans.
“TACO” might be his only hope. But that also gives Iran significant leverage. A war doesn’t work like tariffs. You can’t just change things depending on your mood. He had to find that out the hard way. Don’t get me wrong, the U.S. and Israel are tremendously successful in their military campaign, but as history tells us, you won’t crush an authoritarian regime just by a 2-week air campaign.
At the same time, even for Iran there’s no real benefit in dragging this out while anyone remotely connected to the regime gets systematically blown up.
Probably because of all of this, markets remain oddly calm.
Given the severity of the situation for global energy markets, you’d expect indices to be down far more. But they aren’t. The S&P and Dow aren’t even down 10%. That’s normal correction territory, especially considering the run we’ve had since “Liberation Day.” International markets have taken a bigger hit, but still nowhere near what you’d expect given the risk.
Why?
Because the market believes in TACO. And because, deep down, it knows the same thing: This situation can’t last forever. Every side has a vested interest in ending this conflict.
But, still, I want to point out the most “hilarious” part of the situation: the irony.
The religious regime overthrew a monarchy in Iran because it supposedly oppressed the people. Now, after decades of actual oppression, mass killings and torture, the successor to the Ayatollah is… his own son.
Same system. Worse economy. More oppression. More isolation.
What a win for the Iranian people that revolution was (and yes, that’s sarcasm).
$SPY (-0.4%)
$CSPX (-0.27%)
$DAX
$MEUD (-0.59%)
$UNG
$USO
$QQQ (-0.48%)
$AMZN (-1.9%)

3Mon·
Mar 18 / Iran War — Part 1
The Strait of Hormuz can’t stay closed for long, and the market knows it.
Since the start of the new war in the Middle East, it has become clear where Iran’s leverage lies. It’s not missile attacks on neighbours, and also not the destruction of infrastructure, since that would lead to the total obliteration of its own facilities.
No, what Iran can control, with very little effort as well, is the Strait of Hormuz.
A global choke point of trade, especially important for oil and gas, fertiliser, and Gulf economies.
Let’s forget the last point for now, because pretty much all major players in the region can afford this conflict, given it doesn’t extend for months, which still seems quite unlikely at the moment. What’s the bigger problem is that approximately a quarter of global oil and LNG consumption passes through the strait. And most countries have no way to divert their exports and use different routes.
The exception here is Saudi Arabia, which uses pipelines to move a large portion of its crude to the west coast and ship from there. Not perfect, but it makes Saudi Arabia arguably the least affected country in the region, both in terms of Iranian strikes and economic consequences.
Other countries that could have been affected massively, because they import a majority of their oil and gas from the region, are China and India. But their ships have now been given permission to pass through the strait.
Less lucky are other highly dependent countries and regions like Europe, Japan or South Korea.
The United States is largely energy independent, however global crude price surges still show up at domestic gas stations, very much to the distaste of Donald Trump.
But what’s the real problem? Why are ships not passing through the strait?
The problem isn’t necessarily strikes. It’s insurance.
Most major insurers have cancelled war coverage for carriers in the region, or at the very least pushed premiums to absurd levels. The U.S. tried to offset this by offering cheaper rates through the government or even escort ships by the Navy, but there has been no real follow-through.
What has happened, however, is what looks like market manipulation.
Specifically, when the Energy Secretary proudly announced that the U.S. Navy had successfully escorted a tanker through the strait. Oil prices plunged following the statement.
But surprise, surprise. That never actually happened.
The post was deleted minutes later and the White House had to step in to clarify.
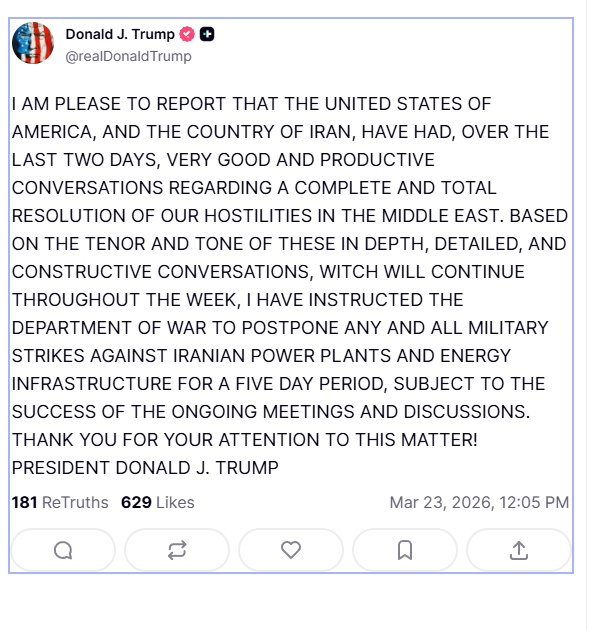
And that’s not the only attempt to cool down prices. Crude, which is up more than 80% since December, still trades down on every new “TACO” statement made by the president regarding negotiations.
The truth is, nobody knows what’s really going on.
Trump says a deal is close. The Iranian leadership, or whoever is left of them, denies any talks. Still, his rhetoric since the beginning of the war has changed noticeably. No more talk of regime change.
Or maybe replacing one hardliner with an even more radical one is the new definition of “overthrowing the system.”
$CSPX (-0.27%)
$SPY (-0.4%)
$EXI2 (-0.76%)
$QQQ (-0.48%)
$CSNDX (-0.45%)
$USO
$UNG
$DAX
88


4Mon·
March 2026 Monthly Portfolio Update - – Navigating Volatility
March has started off as one of the most challenging periods in global markets in recent memory.
The ongoing escalation between the United States, Israel, and Iran has driven widespread risk-off sentiment across equity markets, with oil and energy prices surging and stock indexes under pressure.
As a result, my portfolio is currently down around -2.5% for the month. This reflects the broader market reaction, where indices like the S&P 500 and Nasdaq have shown volatility and downside pressure as geopolitical tensions impact investor sentiment and inflation expectations.
Strategic Adjustments
In response to this environment, I’ve made several tactical adjustments:
Reduced exposure in some positions and closed others to secure partial liquidity
Currently holding approximately 10% in cash, which provides flexibility and optionality
Diversified further across new positions — (e.g., $TCL (-0.84%)
$LOV (-0.75%)
$APA (-0.41%) , and from Swiss market $UBSG (-0.9%) )
These recent additions reflect my focus on quality names with strong fundamentals, diversified geographies and sectors rather than simply chasing index performance.
What this means for Copiers
We’re in a risk-off market regime, not a bear market per se — volatility is a natural response to major geopolitical uncertainty.
Panic selling is rarely the best course of action — losses can be locked in permanently, whereas disciplined investors can find opportunities in dislocations.
The current cash buffer gives us dry powder to scale into positions at more attractive prices if the market continues to sell off.
Broader Market Backdrop
The current sell-off is driven by the escalation of conflict involving the US, Israel and Iran, which has:
Pressured global equity markets and raised inflation and risk aversion concerns
Pushed oil prices sharply higher amid fears of supply disruptions
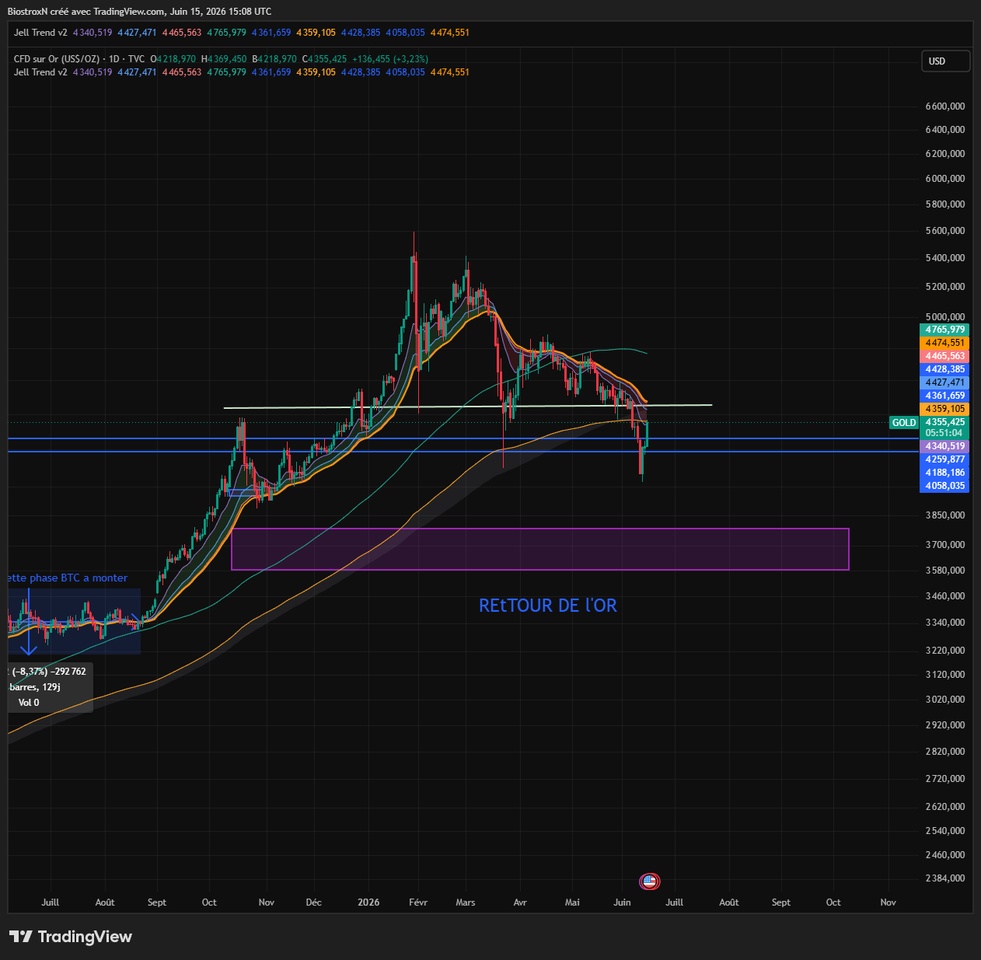
Increased demand for safe-haven assets such as gold and the US dollar
Led to broad risk-off behaviour across major benchmarks in Asia, Europe and the US
Moneycontrol
No one can predict with certainty how this geopolitical situation will unfold, or how markets will react in the short term. But history shows that volatility tends to be temporary, and well-selected exposures often recover and outperform when clarity returns.
Final Thought
This isn’t a time to exit the market, but rather a time to reassess where capital can be deployed most effectively, balancing risk with long-term opportunity. I’ll continue adjusting positions as conditions evolve and will keep transparency front and centre.
Let’s stay calm, focused, and strategic.
😎 𝗗𝗶𝘀𝗰𝗹𝗮𝗶𝗺𝗲𝗿: This is my personal opinion and is for informational purposes only. You should not interpret this information as financial or investment advice
$NVDA (-1.05%)
$CSPX (-0.27%) $$GOLD
$TSLA (-3.34%)
$AAPL (-0.53%)
$PLTR (+0.02%)
22
Trending Securities
Top creators this week
Real-time data from LSX · Fundamentals & EOD data from FactSet