
$UNH (+3,79 %)
$DHI (-1,02 %)
$RTX (-0,69 %)
$HAL (-5,48 %)
$MMM (+7,02 %)
$NOC (-2,38 %)
$MSCI (-10,04 %)
$IBKR (+2,51 %)
$ISRG (-0,65 %)
$COF (+1,56 %)
$BN (-1,77 %)
$EQT (+3,12 %)
$ABBN (+1,94 %)
$GEV (+0,67 %)
$T (+1,55 %)
$CME (-2,93 %)
$PM (-1,97 %)
$MCO (-3,16 %)
$BA (-1,97 %)
$UAL (+0,49 %)
$OR (+0,01 %)
$TXN (+2,8 %)
$LRCX (+5,23 %)
$NOW (-2,68 %)
$IBM (-0,83 %)
$TSLA (+2,58 %)
$000660
$018260
$NESN (-1,56 %)
$SAAB B (+0,87 %)
$DSY (-0,5 %)
$NOKIA (+5,81 %)
$ASC (+2,71 %)
$ROG
$NDAQ (-1,31 %)
$DOW (+0 %)
$KDP (-0,82 %)
$AAL (+3,73 %)
$LMT (-0,72 %)
$AXP (+0,23 %)
$BX (+0,39 %)
$FCX (+6,55 %)
$SAP (-2,22 %)
$INTC (+8,61 %)
$NEM (+3,76 %)
$FIX (+3,8 %)
Anglo American PLC
Stock
Stock
ISIN: GB00BTK05J60
Ticker: AAL
GB00BTK05J60
AAL
Price
Debate sobre AAL
Puestos
153Lun·
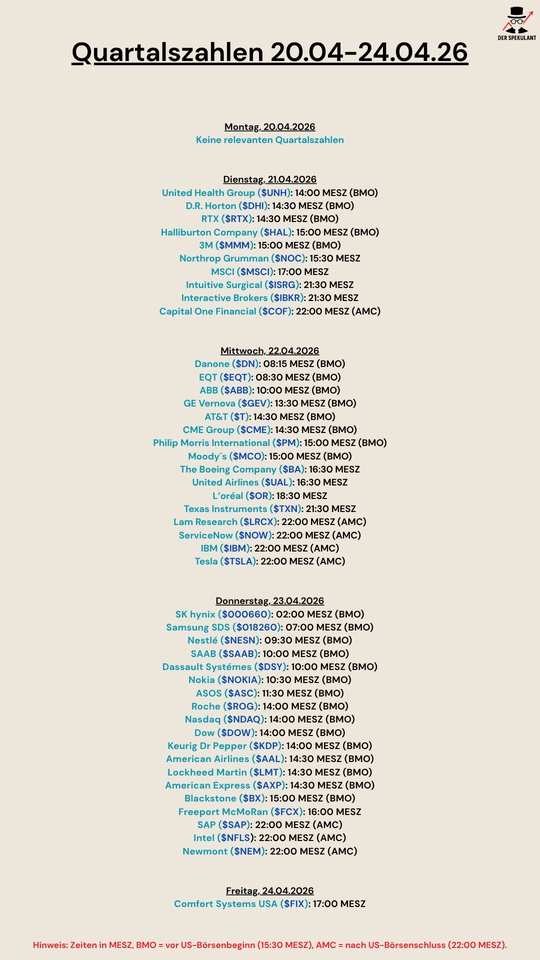
Quarterly figures 20.04-24.04.26
1212

4Lun·
Raw materials special Rhodium, palladium and platinum
Hello my dears,
In recent months, the focus has been on gold and silver as commodities. However, there are also other commodities whose producers have also been able to deliver a better performance in some cases.
THE Best in one year + 300% .
However, I would like to expressly point out that these are cyclical stocks. And the margins are also thinner than for gold.
Therefore perhaps less interesting for long-term investors.
But for short-term investors and traders, I see good yield opportunities here.
But it might also be worthwhile for our dividend investors to take a look at the shares.
THE Best dividend yield 10%
🔥 Brief overview: How the three metals relate to each other
- Rhodium is the rarest, most expensive and most volatile PGM metal.
- Palladium was long the most expensive industrial metal due to gasoline catalytic converters, but has been falling sharply since 2022.
- Platinum is the most stable and broadest metal - industrial, chemical, jewelry, investment.
Metal Typical price range Character
Rhodium 5,000-30,000 USD/oz Extremely rare
Extremely volatile
Palladium 800-2,500 USD/oz Automotive industry
Driven
Platinum 800-1,300 USD/oz Stable,
wide use
Rhodium is therefore several times more expensive than palladium and platinum, but also the most volatile.
🚗 Demand profiles in comparison
Palladium
- Main metal for petrol catalytic converters
- Strong dependence on the automotive industry
- Decline due to e-mobility and substitution by platinum
Platinum
- Diesel catalytic convertersbut increasingly also gasoline catalysts (substitution)
- Chemical industry, hydrogen electrolysis, jewelry
- More stable demand base
Rhodium
- Almost exclusively for NOx reduction in catalytic converters
- No real substitution possible
- Smallest market → extremely price-sensitive
🧭 How prices influence each other
- When palladium becomes expensivemanufacturers substitute → more platinum more platinum in catalytic converters.
- When rhodium becomes expensivemanufacturers try to → more palladium/platinumbut only possible to a limited extent.
- When platinum is cheapits attractiveness as a substitute for palladium increases.
This substitution mechanism is a key driver of PGM prices.
🏭 Which producers have which focus
A rough classification of the major PGM groups:
For rhodium levers. Implats, Amplats and Zimplats are the strongest.
🔍 What does this mean for your analysis?
- If you are looking for Rhodium price leverage bets → implats / amplats.
- If you bet on platinum rebound bet → Northam / Sibanye.
- If you bet on palladium rebound → Sibanye / Stillwater mines.
The choice depends on which metal you think will be strongest over the next few years.
Platinum and palladium are dual metals: They have both industrial demand (especially the automotive industry) and precious metal character (jewelry, investment). This makes them cyclical, but at the same time more stable in value than purely industrial metals.
🏭 The most important listed rhodium producers
Rhodium is produced almost entirely in South Africa and Zimbabwe are mined. Accordingly, a few large mining groups dominate the market.
🌍 Leading global producers (listed on the stock exchange)
- Anglo American / Anglo American Platinum (Amplats) One of the largest PGM producers worldwide; rhodium is an important part of its product range.
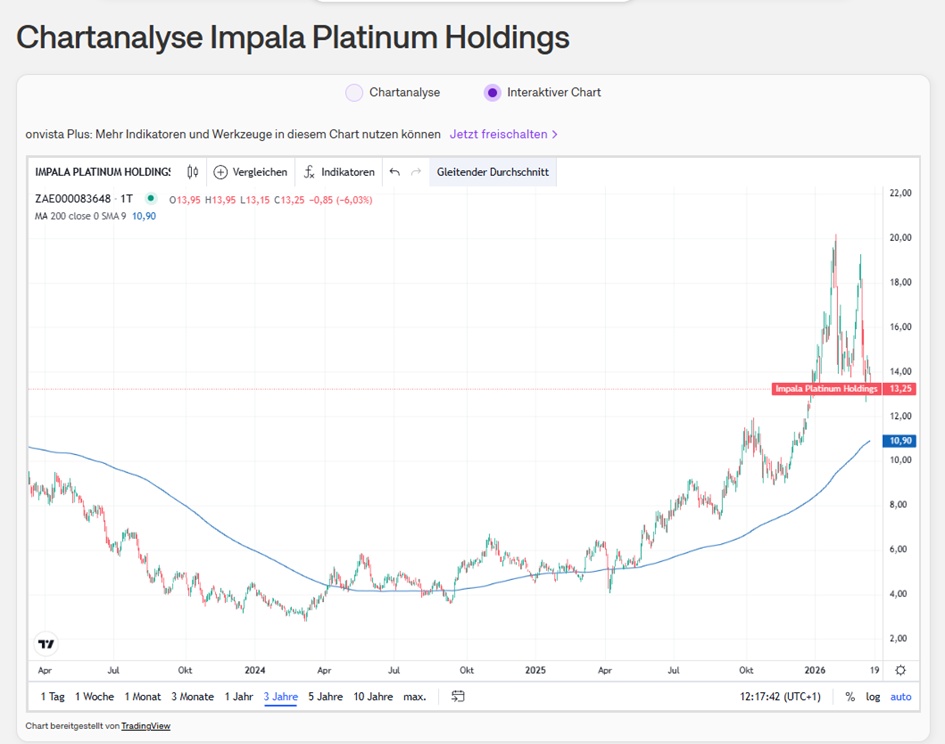
- Impala Platinum Holdings (Implats) Second largest PGM group in South Africa, mines with a strong focus on rhodium.
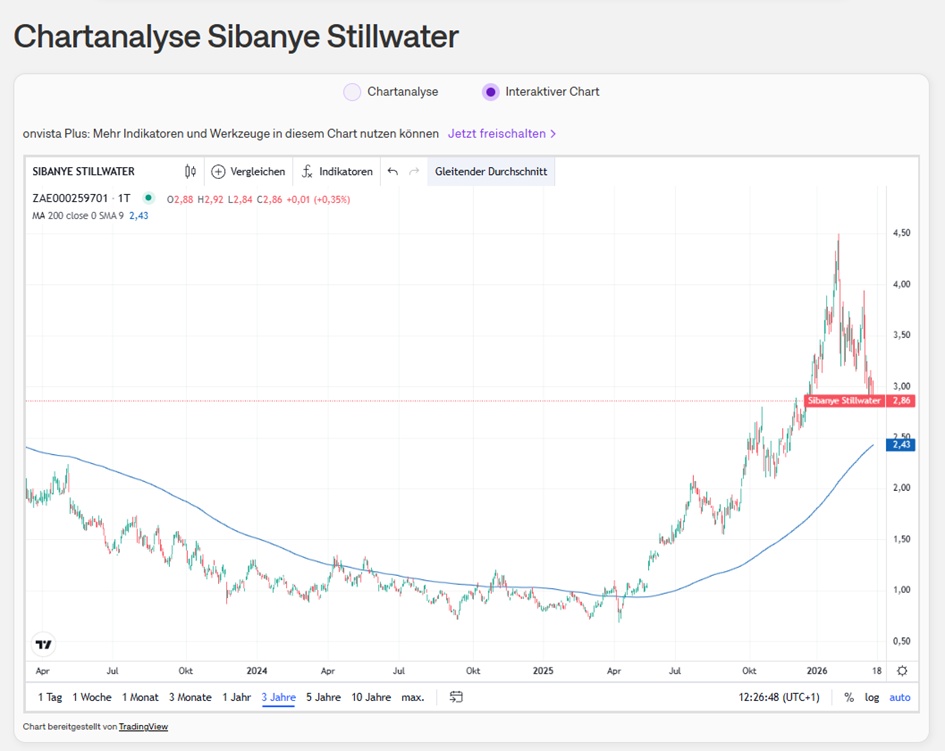
- Sibanye-Stillwater Major PGM producer with mines in South Africa and the USA; rhodium is an important by-product.
- Zimplats (subsidiary of Implats) Largest PGM producer in Zimbabwe, ores with a high rhodium content.
- Eastern Platinum (Eastplats) Smaller but listed PGM producer with rhodium exposure.
- (Focus on platinum)
Northam Platinium Holdings South Africa
📌 Why there are so few pure rhodium producers
- Rhodium is extremely rare and almost never in economically degradable concentrations on its own.
- It is therefore always obtained as a by-product of platinum and palladium mines.
- Pure rhodium mines practically do not exist.
Anglo American (Ticker AAL) $AAL (+3,73 %)
Key figures 2026 2027 2028
Earnings per share 1.60 2.24 2.49
Earnings growth +42.87% +10.95%
KGV 23.90 17.14 15.44
PEG +0.61 +1.55 -3.83
Dividend yield 1.59% 2.06% 2.34%
Performance
1 week -3.73 %
1 month -9.24 %
6 months +27.32 %
1 year +47.03 %
3 years +17.93 %
5 years +9.90 %
7 years +66.04 %
10 years +543.17 %
Impala Platinum Holdings (Ticker IMP) $IMP (+2,14 %)
Key figures 2026 2027 2028
Earnings per share 1.60 2.05 1.80
KGV 8.53 6.67 7.60
Earnings growth +3,458% 23.59% -1.08%
PEG +0.31 -0.55
Dividend yield 6.01% 10.03% 9.08%
Performance
1 week -0.70
1 month 3.42 %
6 months +55.97 %
1 year +150.00 %
3 year +59.50 %
5 years -10.53 %
7 year +282.11 %
Sibanye-Stillwater (ticker SSW) $SSW (+6,3 %)
Key figures 2026 2027 2028
Earnings per share 0.77 0.69
P/E RATIO 3.66 4.06
PEG -0.37 -0.04
Dividend yield 4.46 % 8.61 % 8.17 %
Performance
1 week -5.63 %
1 month -14.93 %
6 months +53.64 %
1 year +228.34 %
3 years +45.78 %
5 years -26.56 %
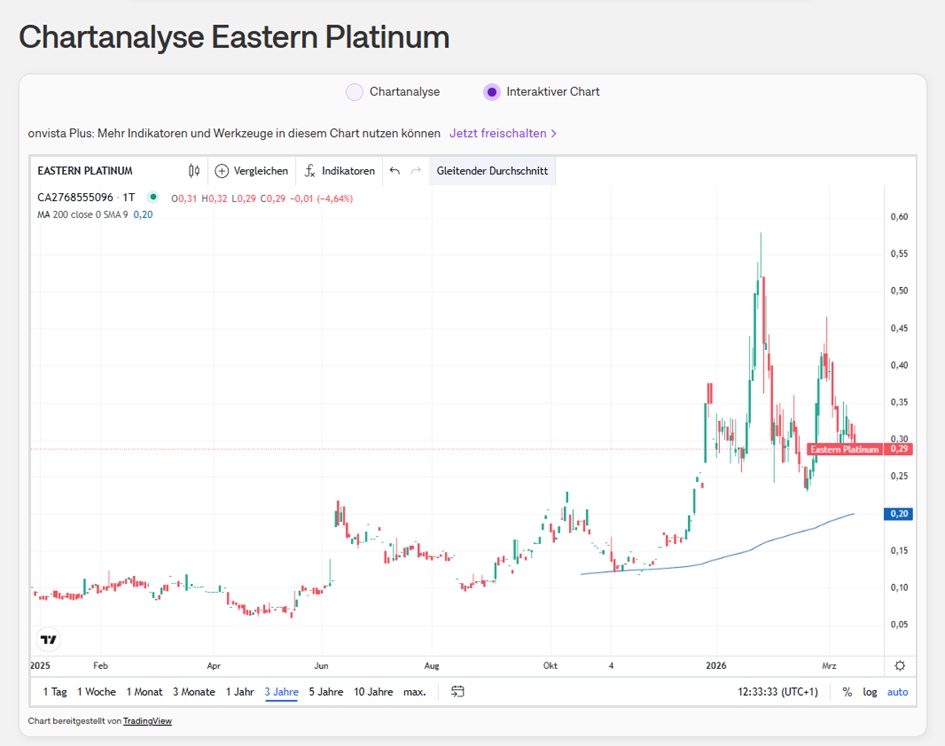
Eastern Platinum (Ticker ELR) $ELR (+7,33 %)
Performance
1 week -3.21 %
1 month +7.09 %
6 months +83.03 %
1 year +184.91 %
3 years +300.00 %
5 years +25.83 %
7 years +161.20
10 years -34.58 %
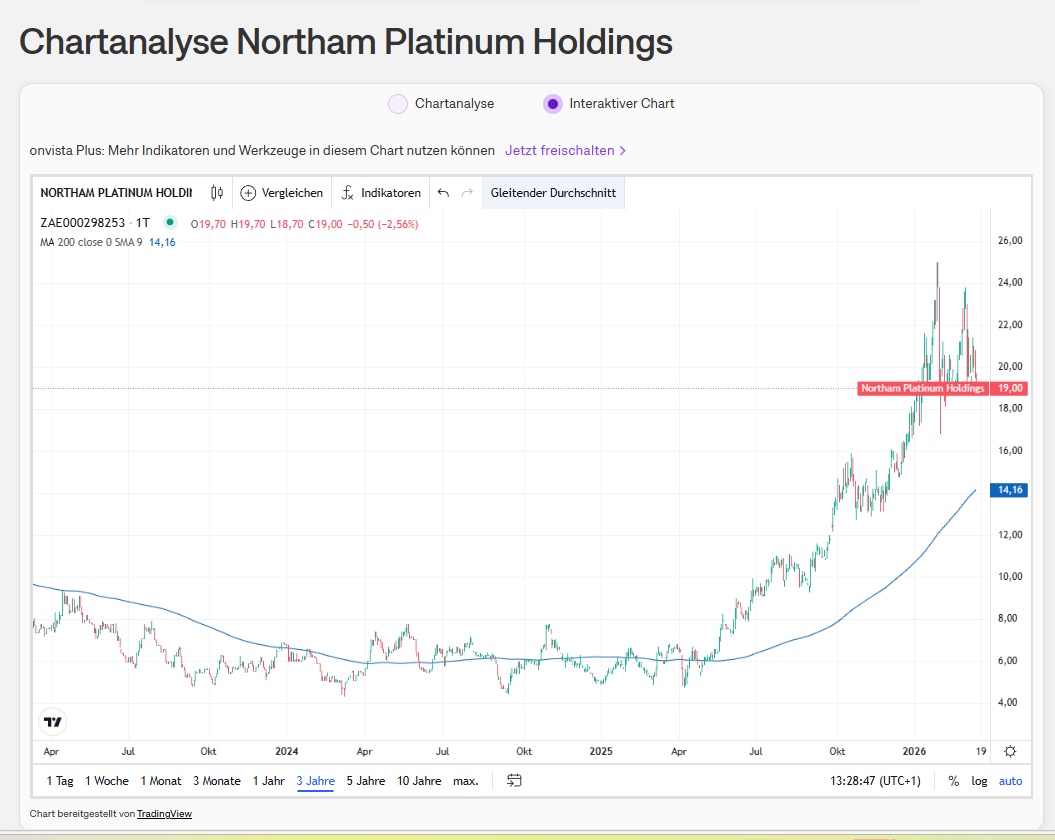
Northam Platinium (NPH) $NPH (+2,09 %)
Key figures 2026 2027 2028
Earnings per share 2.14 2.85 2.99
KGV 9.03 6.80 6.48
Earnings growth +982.29 % +29.09 % -0.11 %
PEG +0.27 +1.41 -0.06
Dividend yield 4.25 % 5.79 % 6.53 %
Performance
1 week -0.51 %
1 month -2.01 %
6 months +74.11 %
1 year +217.07 %
3 years + 156.58 %
+ 4
2222
12 Comentariosinvestment_wizard_2286@investment_wizard_2286
4Lun
•
33
•Ver todas las 3 respuestas adicionales

8Lun·
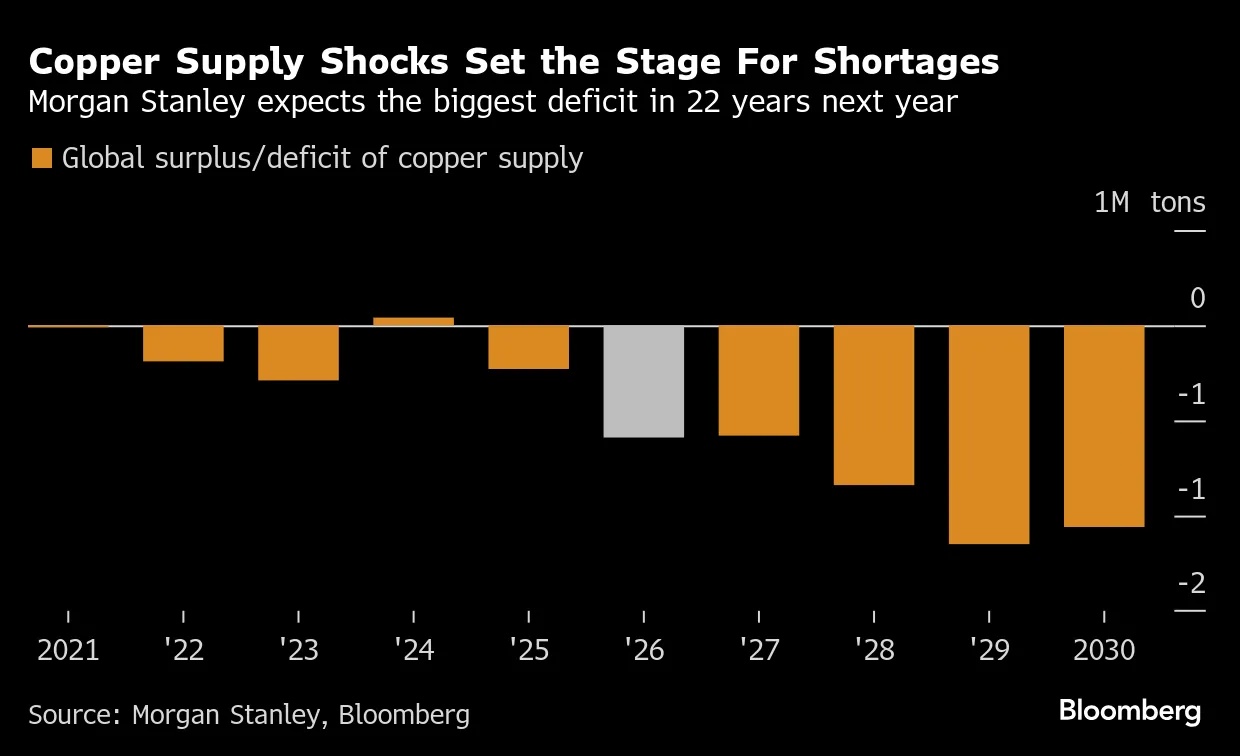
Trade | Commodities
Copper prices in London have reached a new record high. The rally is being driven primarily by supply disruptions at fairly large mines in Chile and Indonesia as well as lowered production guidance from the likes of $GLEN (+3,68 %) & $AAL (+3,73 %) . In parallel, demand drivers such as transportation, EV, AI and renewables continue to drive consumption. The International Copper Study Group has drastically adjusted its forecast for the coming year and now expects a deficit of 150k tons. Prices are receiving additional support from hopes of a rate cut by the FED and positive signals from the trade talks between the USA and China.

44

1Año·
Review of the year 2024
The year 2024 is over in stock market terms and I would also like to review the year.
I started with a portfolio value of just over €53,000.
I knew that a reallocation of around €20,000 was still pending and had therefore set my sights on the target of €100,000.
This was very ambitious, as I naturally didn't know what the year would bring. After all, there were already enough economic and political uncertainties at the start of 2024.
As I only really started investing in 2021 and 2022 was therefore my first full year on the stock market, I made a lot of mistakes at the beginning, had fluctuations in my strategy (once one was in place) and of course also made a few losses.
That's why it was important for me to stay true to my strategy in 2024 and not throw everything overboard again. Because, as I always say, going back and forth empties your pockets.
Some of you may also remember my early days, when I had a lot of savings plans in place, but they weren't particularly high and were constantly being changed. At the beginning of 2024, my portfolio contained a total of 47 individual share positions and 3 ETFs.
My goals for 2024 were therefore
- Stay true to the strategy
- No new stocks in the portfolio, rather clear out
- 100,000€ portfolio value
- 2000€ net dividend
- Investment of €17,000 (without reallocation)
2024 went as follows for me:
January: +4.0%
February: +1.3%
March: +3.0%
April: -0.4%
May: +0.5%
June: +1.7%
July: +1.7%
August: +0.9%
September: +1.0%
October: -0.4%
November: +3.4%
December: -1.7%
TTWROR 2024: +15.8%
Dividend (already in the performance): € 1956.56
Invested: €24,900
Reallocation: €21,700
Thanks to a special payment from my old employer, to which I was still entitled, I was surprisingly able to invest around €5,000 more than I had originally thought.
Did I achieve my goals?
Not all of them.
With the dividends, I'm ~€43 below my target. That's a shame, but it motivates me to step on the gas even more and crack the €2400 net dividend in 2025. That would be €200 net per month, which corresponds to an increase of 22.66%. Again, very ambitious, but you should set yourself ambitious goals.
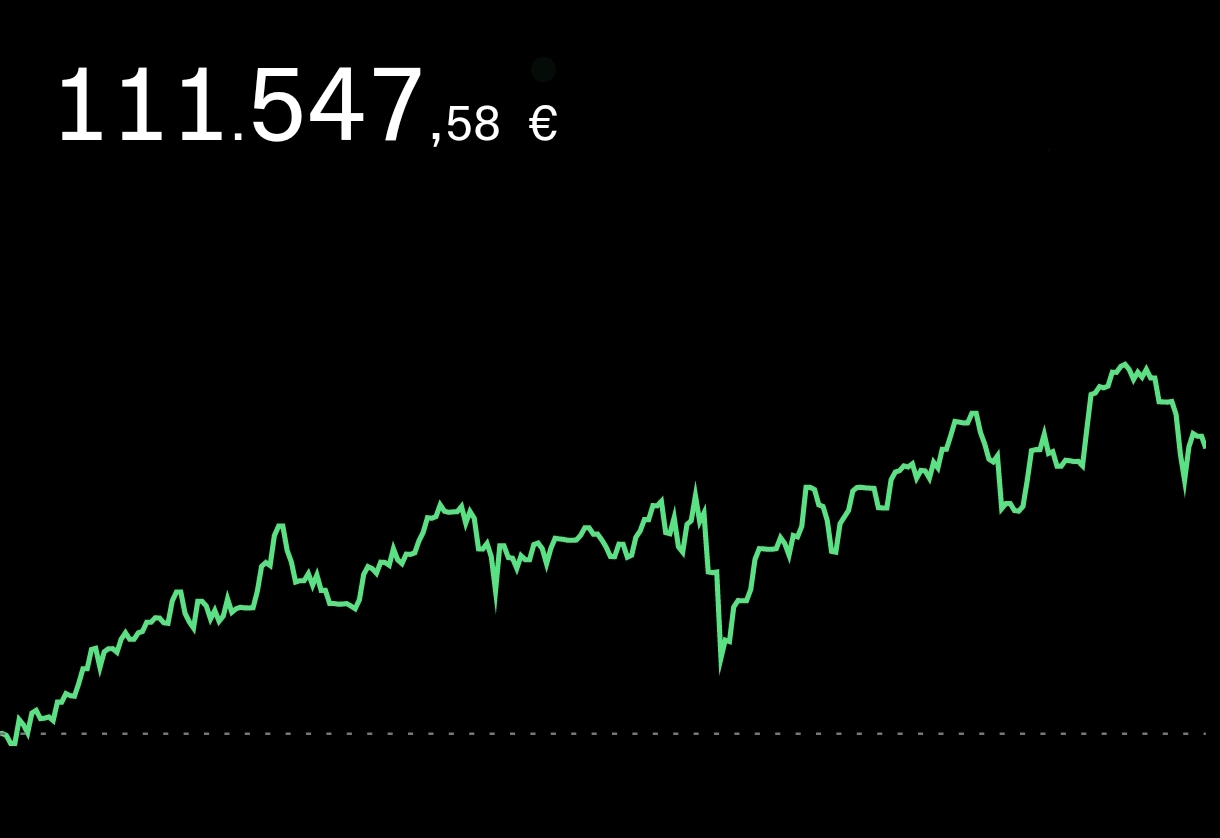
However, I was already able to break the €100,000 barrier in September. This was of course due to the strong market. I ended the year with just over €111,500. I have remained true to my strategy, but a few new stocks have slipped into the portfolio (and a few out).
The cheering contribution to the €100,000 was here:
https://app.getquin.com/de/activity/XGtdQzCdYF
New in the depot:
$NESN (-1,56 %) Nestle
$CTAS (-0,51 %) Cintas (savings plan)
$RACE (-0,27 %) Ferrari
$D05 (+0,15 %) DBS
$UNH (+3,79 %) United Health
$V (-1,02 %) visas
$CSNDX (+1,96 %) Nasdaq 100 (savings plan)
$XEON (+0,01 %) As an overnight money substitute for fixed planned money for loan repayment in 6 years or special repayment if the interest rate on the balance falls below the loan interest rate of 0.75%. Is topped up with special payments from the employer during this period.
Left my securities account:
$AAL (+3,73 %) Anglo American PLC (+37%)
$IBM (-0,83 %) (+26%)
$BAC (+1,42 %) Bank of America (+45%)
$UKW (+1,63 %) Greencoat UK Wind (0 to 0 due to dividends)
$SBUX (-0,23 %) Starbucks (+10%)
$BIGG (-4,82 %) Bigg Digital Group (-95%)
Unfortunately, I sold IBM and Bank of America too early, but I am still satisfied.
What else has happened?
- I bought Bitcoin from TR to estimate the costs. Conclusion: savings plan is always around 3-4% higher. Not worth it, if at all then individual purchases
- Weingut Dürnberg: First dividend received and prospects look reasonable. Depending on how the grape harvest turns out next year, a dividend will be paid again and investments can still be made.
- The conservatory and paving the courtyard are done. The house construction is more or less finished, everything else will take time and are small things, but now I have to start saving again as I only have a small nest egg and my deposit. All other funds have been used up as the costs were twice as high as originally planned.
- Podcast with @Koenigmidas is running rather slowly this year due to personal time constraints. You can find the latest episode here: Link zur Folge (also available on Amazon)
Outlook for 2025
So what are my plans for 2025 in terms of finances?
- Investment of €15,000
- Net dividend of €2,400
- One slightly greater focus on high dividend stocks (e.g. to increase $HTGC (+0,57 %) to increase the cash flow a little faster)
What are your targets for 2025? Did you reach your 2024 targets and to what extent did you change your targets after reaching (or not reaching) your 2024 targets?
Feel free to let me know in the comments, as I always find it very exciting to see how ambitiously others set/change their goals.
I wish you a good start to 2025 and every success with all your plans and goals.
As with everything, of course, if you're not interested, feel free to keep scrolling and/or use the block function. 😊

7171
34 Comentarios
Built a house, had double the costs and still have a 100k deposit. Finally you have earned my respect, which I express to you with this Respectcoin.
•
1515
•
1Año·
Earnings summary this morning 👇🏼
$ULVR (-1,83 %) | Unilever Q3 2024 Earnings
Rev €15.25B (est €15.398B)
DIV/SHR €O.4396
Underlying Volume 3.6% (est 3.1%)
Underlying Sales 4.5%, (est 4.25%)
Still Sees FY Underlying Sales To 5% (est 4.2%)
Still Sees FY Underlying Oper. Margin At Least 18%
2024 FY Outlook Unchanged
$BARC (+2,41 %) | Barclays Q3 2024 Earnings
Pretax Profit £2.23B (est £1.96B)
Net Interest Income £3.31B (est £3.11B)
Investment Banking £594M (est £552.3M)
FICC Rev. £1.18B (est £1.13B)
Sees FY Cost To Income Ratio About
Sees FY UK Net Interest Income About £6.5B
$AAL (+3,73 %) | Anglo American Q3 2024 Earnings
Diamond Prod 5.6M Carats (est 5.6M)
Copper Output 181,000 tons (est 181,334)
American Sees Fy Diamond Prod 23M to 26M Carats
De Beers To Continue To Assess Options To Lower Output
PGMS Demerger Is On Track To Complete By Mid 2025
$RMS (+0,39 %) | Hermes International Q3 2024 Earnings
Rev €3.70B (est €3.68B)
Sales At Constant FX 11.3% (est 10.5%)
Leather Goods Sales At Constant FX 14% (est 12.8%)
CFO: Sees No Change In Global Trends Early Q4
CFO: China Higher Basket Spend Made Up For Lower Traffic
$005380 | Hyundai reports a 6.5% drop in profits in the third quarter despite an increase in sales, leading to a fall in the Seoul share price of almost 5%. Operating profit falls to 3.6 trillion won, while the operating margin drops to 8.3%.
$BN (-1,77 %) | Danone increases its turnover in the third quarter by 4.2% to 6.9 billion euros, exceeding analysts' expectations. Demand is particularly high in North America and Asia.
$RNO (-0,31 %) | Renault increases sales by 1.8% to 10.7 billion euros in the third quarter, but falls short of analysts' expectations. Exchange rate effects have a dampening effect on the result, without which a 5% increase in sales would have been possible.
$SY1 (-0,51 %) | Symrise raises its forecast for organic growth in 2024 to around 7 % after strong sales growth in the first nine months. Sales rose by 6 % to 3.8 billion euros, driven by petcare and fragrance products.
$WAF (+3,44 %) | Siltronic raises 2024 EBITDA margin guidance to 24-26% as acceptance of new Singapore factory is delayed. Third-quarter sales rise 2.3% to EUR 357m, exceeding expectations, while profit falls to EUR 19m.
$BEI (-0,15 %) | Beiersdorf records organic sales growth of 6.5% to 7.5 billion euros, but falls short of analysts' expectations. Sales of the luxury brand La Prairie fall by over 7% in China, while the annual targets for 2024 are confirmed.


2Año·
No news about $GLEN (+3,68 %)
While it is exciting at $ABHPG and $AAL (+3,73 %) who is taking over what here now.
So I'm quietly on my way to filling my position.
99
7 Comentarios
My trailing SL recently kicked me out - with a nice +28% - but Glencore is still on my watchlist. I'm always ready for commodities 😁
•
22
•

2Año·
Different courses at $AAUKF and $AAL (+3,73 %)
I decided to invest in Anglo American at the time and simply bought the "normal" $AAUKF bought. Now I see here that the PLC version has a different price trend and was also extremely fueled by the takeover fantasies of BHP, while my normal $AAUKF shares are even in the red today😅
Can someone shed some light on what this is all about?
1 Comentario

2Año
What is the ISIN of your security? The one given on the Getquin page is not found anywhere on other sites and GQ itself does not show any prices.
••
2Año·
Heading south again. So I took the profit for the time being. Nobody has become poor yet!
2Año·
Light at the end of the tunnel! After $AAL (+3,73 %) has already performed well since the beginning of the year, today there was a further substantial boost following the confirmation of takeover interest by $BHP (+3,83 %) the takeover interest.

77
2Año·
Light at the end of the tunnel! After $AAL (+3,73 %) has already performed well since the beginning of the year, today there was a further substantial boost following the confirmation of takeover interest by $BHP (+3,83 %) the takeover interest.
22
4 Comentarios
It would have been more interesting if you had posted on 05.02.
•
44
•