Hello my dears,
In recent months, the focus has been on gold and silver as commodities. However, there are also other commodities whose producers have also been able to deliver a better performance in some cases.
THE Best in one year + 300% .
However, I would like to expressly point out that these are cyclical stocks. And the margins are also thinner than for gold.
Therefore perhaps less interesting for long-term investors.
But for short-term investors and traders, I see good yield opportunities here.
But it might also be worthwhile for our dividend investors to take a look at the shares.
THE Best dividend yield 10%
🔥 Brief overview: How the three metals relate to each other
- Rhodium is the rarest, most expensive and most volatile PGM metal.
- Palladium was long the most expensive industrial metal due to gasoline catalytic converters, but has been falling sharply since 2022.
- Platinum is the most stable and broadest metal - industrial, chemical, jewelry, investment.
Metal Typical price range Character
Rhodium 5,000-30,000 USD/oz Extremely rare
Extremely volatile
Palladium 800-2,500 USD/oz Automotive industry
Driven
Platinum 800-1,300 USD/oz Stable,
wide use
Rhodium is therefore several times more expensive than palladium and platinum, but also the most volatile.
🚗 Demand profiles in comparison
Palladium
- Main metal for petrol catalytic converters
- Strong dependence on the automotive industry
- Decline due to e-mobility and substitution by platinum
Platinum
- Diesel catalytic convertersbut increasingly also gasoline catalysts (substitution)
- Chemical industry, hydrogen electrolysis, jewelry
- More stable demand base
Rhodium
- Almost exclusively for NOx reduction in catalytic converters
- No real substitution possible
- Smallest market → extremely price-sensitive
🧭 How prices influence each other
- When palladium becomes expensivemanufacturers substitute → more platinum more platinum in catalytic converters.
- When rhodium becomes expensivemanufacturers try to → more palladium/platinumbut only possible to a limited extent.
- When platinum is cheapits attractiveness as a substitute for palladium increases.
This substitution mechanism is a key driver of PGM prices.
🏭 Which producers have which focus
A rough classification of the major PGM groups:
For rhodium levers. Implats, Amplats and Zimplats are the strongest.
🔍 What does this mean for your analysis?
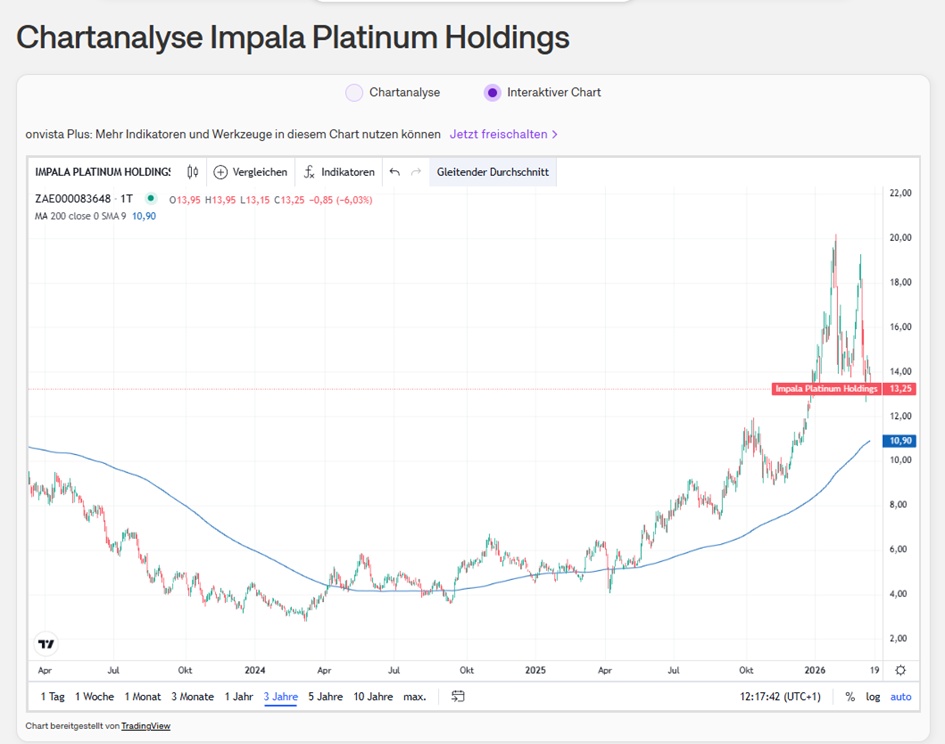
- If you are looking for Rhodium price leverage bets → implats / amplats.
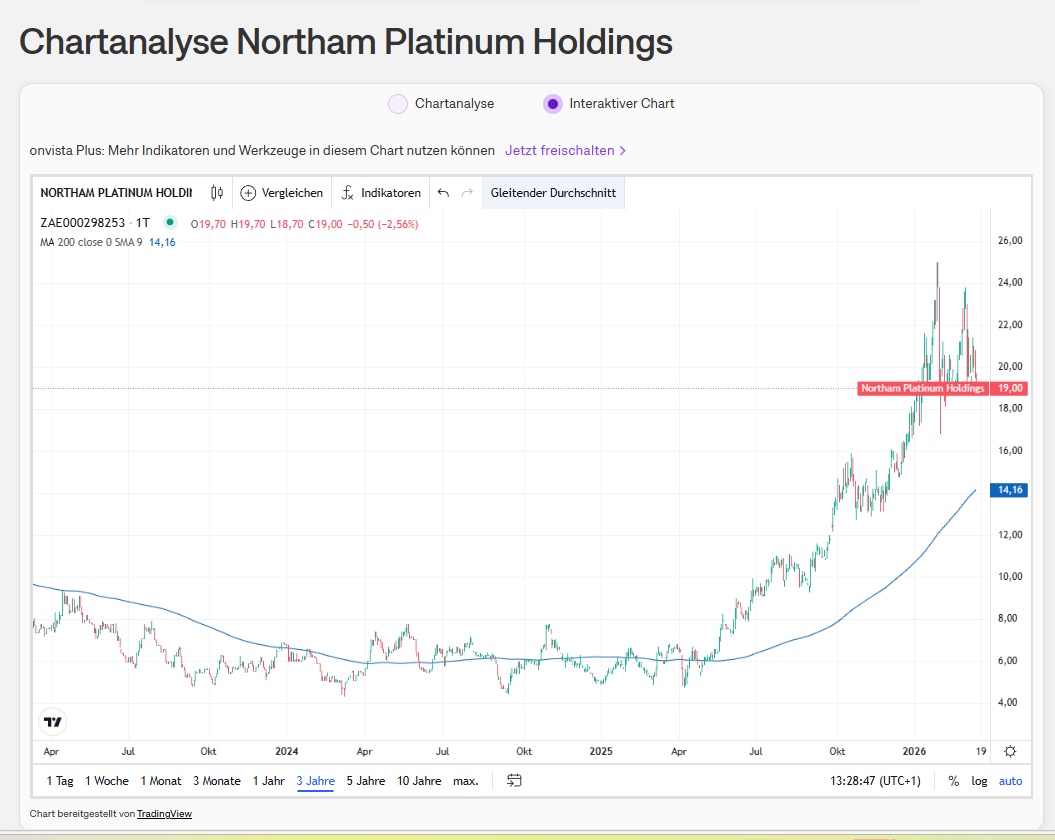
- If you bet on platinum rebound bet → Northam / Sibanye.
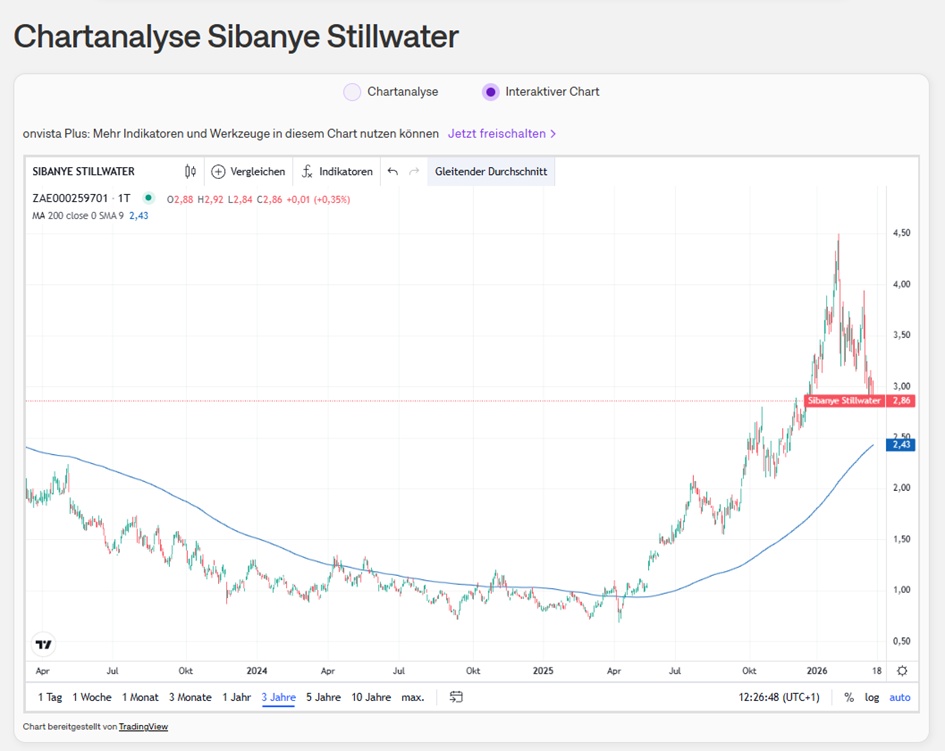
- If you bet on palladium rebound → Sibanye / Stillwater mines.
The choice depends on which metal you think will be strongest over the next few years.
Platinum and palladium are dual metals: They have both industrial demand (especially the automotive industry) and precious metal character (jewelry, investment). This makes them cyclical, but at the same time more stable in value than purely industrial metals.
🏭 The most important listed rhodium producers
Rhodium is produced almost entirely in South Africa and Zimbabwe are mined. Accordingly, a few large mining groups dominate the market.
🌍 Leading global producers (listed on the stock exchange)
- Anglo American / Anglo American Platinum (Amplats) One of the largest PGM producers worldwide; rhodium is an important part of its product range.
- Impala Platinum Holdings (Implats) Second largest PGM group in South Africa, mines with a strong focus on rhodium.
- Sibanye-Stillwater Major PGM producer with mines in South Africa and the USA; rhodium is an important by-product.
- Zimplats (subsidiary of Implats) Largest PGM producer in Zimbabwe, ores with a high rhodium content.
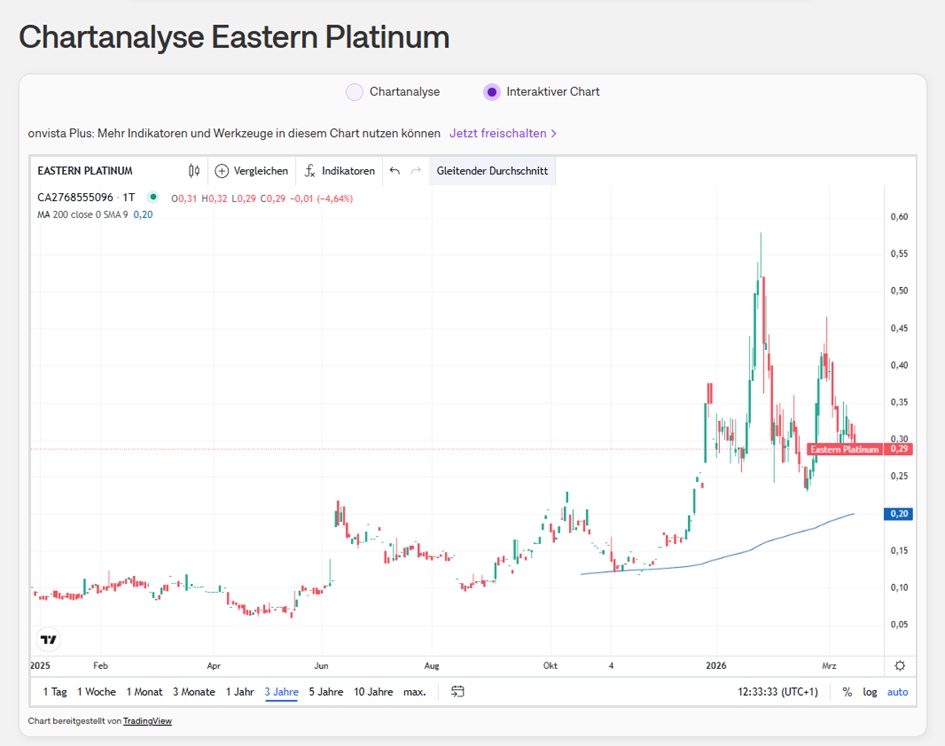
- Eastern Platinum (Eastplats) Smaller but listed PGM producer with rhodium exposure.
- (Focus on platinum)
Northam Platinium Holdings South Africa
📌 Why there are so few pure rhodium producers
- Rhodium is extremely rare and almost never in economically degradable concentrations on its own.
- It is therefore always obtained as a by-product of platinum and palladium mines.
- Pure rhodium mines practically do not exist.
Anglo American (Ticker AAL) $AAL (-0,09 %)
Key figures 2026 2027 2028
Earnings per share 1.60 2.24 2.49
Earnings growth +42.87% +10.95%
KGV 23.90 17.14 15.44
PEG +0.61 +1.55 -3.83
Dividend yield 1.59% 2.06% 2.34%
Performance
1 week -3.73 %
1 month -9.24 %
6 months +27.32 %
1 year +47.03 %
3 years +17.93 %
5 years +9.90 %
7 years +66.04 %
10 years +543.17 %
Impala Platinum Holdings (Ticker IMP) $IMP (+1,62 %)
Key figures 2026 2027 2028
Earnings per share 1.60 2.05 1.80
KGV 8.53 6.67 7.60
Earnings growth +3,458% 23.59% -1.08%
PEG +0.31 -0.55
Dividend yield 6.01% 10.03% 9.08%
Performance
1 week -0.70
1 month 3.42 %
6 months +55.97 %
1 year +150.00 %
3 year +59.50 %
5 years -10.53 %
7 year +282.11 %
Sibanye-Stillwater (ticker SSW) $SSW (-0,39 %)
Key figures 2026 2027 2028
Earnings per share 0.77 0.69
P/E RATIO 3.66 4.06
PEG -0.37 -0.04
Dividend yield 4.46 % 8.61 % 8.17 %
Performance
1 week -5.63 %
1 month -14.93 %
6 months +53.64 %
1 year +228.34 %
3 years +45.78 %
5 years -26.56 %
Eastern Platinum (Ticker ELR) $ELR (+1,19 %)
Performance
1 week -3.21 %
1 month +7.09 %
6 months +83.03 %
1 year +184.91 %
3 years +300.00 %
5 years +25.83 %
7 years +161.20
10 years -34.58 %
Northam Platinium (NPH) $NPH (+0 %)
Key figures 2026 2027 2028
Earnings per share 2.14 2.85 2.99
KGV 9.03 6.80 6.48
Earnings growth +982.29 % +29.09 % -0.11 %
PEG +0.27 +1.41 -0.06
Dividend yield 4.25 % 5.79 % 6.53 %
Performance
1 week -0.51 %
1 month -2.01 %
6 months +74.11 %
1 year +217.07 %
3 years + 156.58 %