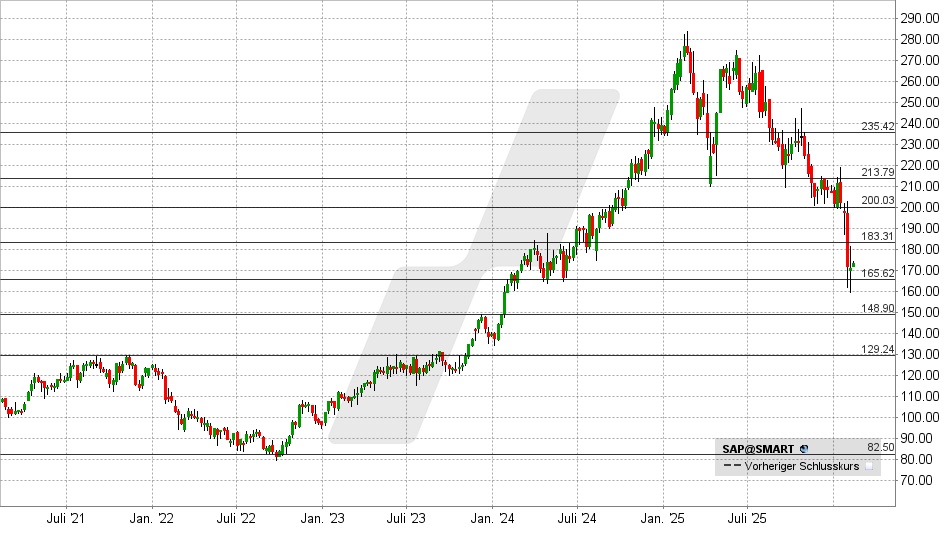
$SAP (+1,73 %) and Mistral AI work together to implement Mistral AI's models into SAP products and infrastructure in an attempt to strengthen EU's digital sovereignty.

SAP
Price
Debate sobre SAP
Puestos
220Basic knowledge: EV/EBITDA - the more realistic valuation than the P/E ratio
Reading time: approx. 8 minutes
In one of my last articles on the weaknesses of the P/E ratio, I showed why the seemingly simple price/earnings ratio can easily be misleading. It takes into account neither the capital structure nor the level of debt of a company, ignores special accounting effects and makes companies from different sectors artificially comparable, even though their business models function completely differently. Three central problems stand out in particular:
- Debt: Two companies with the same P/E ratio can have completely different risk profiles if one is highly indebted.
- Accounting logic: Depreciation and amortization, taxes and one-off effects can strongly distort profits - the P/E ratio reacts sensitively to this.
- Sector comparison: Capital-intensive industrial companies and scalable software companies can hardly be meaningfully compared using the P/E ratio.
If you want to gain a deeper understanding of what a company is really worth, you have to look beyond the share price alone and look at enterprise value (EV). While the P/E ratio only reflects the market value of the equity, the EV comprises the entire enterprise value, i.e. what a buyer would actually have to pay. The formula is simple: EV = market capitalization + debt - cash and cash equivalents.
This reveals the economic reality: a company with a high cash position is actually cheaper than the P/E ratio suggests, while one with a high level of debt is more expensive. In combination with EBITDA - earnings before interest, taxes, depreciation and amortization - this results in EV/EBITDA, the key figure that has long been standard in professional financial analysis.
EBITDA reflects the operational strength of a company before financing decisions or tax effects distort the picture. If you put the enterprise value in relation to this operating profit, you get a structured answer to the question: How many years of the current EBITDA would a buyer have to pay to take over the company completely?
This approach is much more meaningful than the P/E ratio. Two companies with identical earnings and the same market capitalization can be valued completely differently with identical P/E ratios as soon as their debt is taken into account:
- Both generate €1 billion profit with €10 billion market capitalization → P/E ratio = 10.
- Company A: no debt → EV = € 10 bn.
- Company B: additional debt of € 5 bn → EV = € 15 bn.
- With the same EBITDA of € 1.5 billion, the EV/EBITDA is 6.7x (A) and 10x (B).
Same profit, completely different risk.
This is precisely the strength of EV/EBITDA: it is neutral in terms of capital structure, focused on operating earnings power and comparable across sectors. Especially in the M&A environment or for private equity investors, it is the key valuation indicator because it shows what is paid for the actual business - regardless of the form of financing.
Typical valuation levels vary by sector:
- Capital-intensive sectors such as energy, chemicals or engineering: usually 5-8x.
- Software and MedTech companies: often 15-25x.
- $SAP (+1,73 %) (SAP SE): historically around 10-12x EV/EBITDA.
- $ADBE (+4,29 %) (Adobe Inc): around 18-22x EV/EBITDA.
- $BAS (+4,3 %) (BASF SE): regularly below 6x, due to high capital commitment and cyclicality.
EV/EBITDA is not an absolute figure, but a ratio that should be read in the context of the market environment. Multiples rise during upswings and fall during recessions. Nevertheless, a rough guide is: below 7x is considered favorable, 7-12x as fair, above 12x as ambitious or growth-driven.
Of course, this ratio also has its limits. It ignores investments, taxes and actual cash flows and can make capital-intensive business models appear too positive. It should therefore always be considered together with key figures such as EV/EBIT, free cash flow yield or the PEG ratio.
At its core, however, EV/EBITDA remains the more realistic benchmark: it brings operating performance, debt and market value into a common relationship and shows what a company really costs. The P/E ratio may be simpler - but those who rely on simplicity often only see half the truth.
How do you proceed? Do you use EV/EBITDA as the central valuation indicator or does the P/E ratio remain the starting point for you? And in which sectors do you think the ratio reaches its limits?
Deutsche Telekom invests more than one billion euros in AI factory
Deutsche Telekom $DTE (+2,52 %) wants to enter the construction and operation of data centers for artificial intelligence (AI) on a large scale. Group CEO Timotheus Höttges announced in Berlin the launch of a joint project with the US chip company Nvidia $NVDA (+0,31 %) in which a so-called AI factory is to be built in Munich at a cost of over one billion euros.
"Without AI, you can forget about industry," said Höttges. "Without AI, you can forget about Germany as a business location." The Deutsche Telekom CEO pointed out that only five percent of high-performance AI chips are currently used in Europe, compared to 70 percent in the USA.
Höttges emphasized that the data in the Munich AI cloud should remain entirely in Germany. Only employees from Germany and Europe would be used to handle the data. And the technology comes from Germany and the USA. This means that there are no longer any excuses for German and European companies not to use AI on a large scale.
》Great day for Germany and Europe《
Federal Digital Minister Karsten Wildberger (CDU) spoke of "a great day for Germany and for Europe". "We are celebrating an investment with a signal effect: more than one billion euros for an AI factory with the most modern chips in the world." But this is more than just an AI factory for industry. "It is a signal of new beginnings. A further step on Germany's path to resolutely exploiting the opportunities offered by artificial intelligence."
In Berlin, Nvidia CEO Jensen Huang recalled that the concept of Industry 4.0 was developed in Germany. "Germany had this vision of connecting the digital world with the physical world.
With AI, we can now bring a super version of Industry 4.0 to life. And this is a new era, namely industrial AI." Nvidia is the world's leading provider of high-performance chips that are essential for training and using AI.
Deutsche Telekom is already a provider of conventional cloud services and operates over 180 data centers worldwide. At the same time, the Group cooperates with large platforms such as Google Cloud, Amazon AWS $AMZN (+2 %) or Microsoft Azure in the cloud business.
However, Deutsche Telekom's economic success is driven by its core business with telco services in Europe and the business success of its US subsidiary T-Mobile $TMUS (-0,75 %) business success.
》Part of a larger AI strategy《
The AI data center in Munich's Tucherpark is just the start of a larger-scale AI strategy at Deutsche Telekom. The Group hopes to be considered for a major European Union funding program for so-called AI Gigafactories.
The EU defines a gigafactory as a data center with 100,000 or more special AI chips (GPUs) - the facility in Munich will only run with 10,000 GPUs.
In order not to lose touch with the future topic of AI and at the same time remain independent of US companies such as Open AI, Google $GOOGL (+4,38 %)Microsoft $MSFT (-0,83 %) and Meta $META (+1,83 %) Brussels is planning to promote the construction of four to five such large data centers.
The interested parties from Germany were unable to agree on a uniform application. Therefore, in addition to Telekom, the Schwarz Group, which is behind Lidl and Kaufland, the cloud provider Ionos $IOS (+2,74 %) and other consortia.
Federal Research Minister Dorothee Bär (CSU) emphasized the importance of this initiative. At least one AI Gigafactory must come to Germany.
With the Bavarian AI factory, Deutsche Telekom is primarily targeting users in industry.
The first customers include Agile Robots $AGL (+0 %)a leading German high-tech company that specializes in AI-controlled automation solutions and intelligent robotics.
In addition to Nvidia, other cooperation partners include Europe's largest software company SAP $SAP (+1,73 %)Deutsche Bank $DBK (+2,05 %) and the AI provider Perplexity.

Nvidia and Telekom build AI data center in Munich
Nvidia $NVDA (+0,31 %) and Deutsche Telekom $DTE (+2,52 %) are preparing to launch a billion-euro initiative for a data center in Germany. This was reported by the Bloomberg news agency, citing sources familiar with the matter. The project is intended to meet the region's demand for computing capacity.
Europe's largest software group SAP $SAP (+1,73 %) is expected to be the anchor tenant of the data center. The plans themselves have been known for some time, but no official announcement has yet been made.
An event in Berlin in November could be the occasion for the announcement. Deutsche Telekom CEO Tim Höttges, Nvidia CEO Jensen Huang, SAP CEO Christian Klein and Digital Minister Karsten Wildberger are expected to attend. The event is planned for Munich, a source said.
The project aims to develop regional AI capabilities. In the US market, companies such as Microsoft and Google have invested hundreds of billions of US dollars in AI infrastructure. Europe is lagging behind both US and Chinese competitors in this area.
》Europe's AI infrastructure offensive comparatively small《
Nvidia's management previously expressed concerns about Europe's pace in expanding its computing infrastructure. European companies are reaching their limits if they want to use AI systems and at the same time maintain data sovereignty within European borders.
The planned facility will use around 10,000 graphics processors - specialized chips that power AI systems. However, this dimension remains modest compared to projects elsewhere. A data center developed in the US state of Texas by Softbank, OpenAI and Oracle is designed for around 500,000 GPUs.
In February, the European Union presented a 200 billion euro plan to promote AI development in the member states. The initiative aims to triple the region's AI computing capacity over the next five to seven years. However, implementation of the plan is slower than expected.

Nvidia and Deutsche Telekom plan €1B AI data center in Germany — SAP to be anchor customer
$NVDA (+0,31 %)
$DTE (+2,52 %)
$SAP (+1,73 %)
Nvidia and Deutsche Telekom announced plans for a €1 billion AI data center project in Germany, aimed at supporting Europe’s growing AI infrastructure needs.
SAP is set to join as a key customer, leveraging the new facility for cloud-based enterprise AI solutions.
SAP Q3’25 Earnings Highlights
🔹 Non-IFRS Revenue: €9.08B (Est. €9.09B) 🔴; UP +7% YoY
🔹 Non-IFRS Cloud & Software: €8.02B (Est. €8.06B) 🔴; UP +8% YoY
🔹 Non-IFRS Cloud: €5.29B (Est. €5.33B) 🔴; UP +22% YoY
FY25 Guidance
🔹 Non-IFRS Cloud Revenue: €21.6B–€21.9B (now guiding to lower end) 🔴
🔹 Non-IFRS Operating Profit: €10.3B–€10.6B (toward upper end)
🔹 Free Cash Flow: €8.0B–€8.2B (prior ~€8.0B)
🔹 Cloud & Software Revenue (cc): €33.1B–€33.6B; +11% to +13% (cc)
Q3 Segment
🔹 Cloud ERP Suite Revenue: €4.59B; UP +26% YoY (+31% cc)
🔹 SaaS/PaaS Revenue: €5.21B; UP +23% YoY (+28% cc)
🔹 IaaS Revenue: €78M; DOWN -34% YoY (-31% cc)
🔹 Services Revenue: €1.06B; UP +2% YoY (+6% cc)
Other Metrics
🔹 Current Cloud Backlog: €18.8B; UP +23% YoY (+27% cc)
🔹 Non-IFRS Operating Profit: €2.57B; UP +14% YoY (+19% cc)
🔹 Non-IFRS Operating Margin: 28.3%; UP +180 bps YoY
🔹 Non-IFRS Cloud Gross Margin: 75.1%; UP +130 bps YoY
🔹 Share of More Predictable Revenue: 87%; UP +2 pp YoY
🔹 Free Cash Flow: €1.27B; UP +5% YoY
🔹 EPS (Non-IFRS, Basic): €1.59; UP +29% YoY
CEO / CFO Commentary
🔸 “We delivered strong cloud growth of 27% at constant currency, with customers adopting Business Data Cloud and AI at pace. Our Q4 pipeline supports our 2026 acceleration ambition.” — Christian Klein, CEO
🔸 “Disciplined execution drove double-digit profit growth and strong free cash flow, supporting an improved outlook for operating profit and FCF.” — Dominik Asam, CFO
Quartalsberichte 21.10-24.10.25
$NDAQ (+0,88 %)
$RTX (-1 %)
$KO (+2,74 %)
$MMM (+1,78 %)
$NOC (+0,4 %)
$LMTB34
$OR (+5,23 %)
$TXN (+3,92 %)
$NFLX (-0,76 %)
$HEIA (+3,84 %)
$SAAB B (-3,19 %)
$UCG (+1,45 %)
$BARC (+1,46 %)
$GEV (-0,31 %)
$TMO (+1,92 %)
$T (+2,22 %)
$MCO (+1,04 %)
$IBM (+1,99 %)
$SAP (+1,73 %)
$TSLA (+0,22 %)
$AAL (+5,56 %)
$FCX (+1,11 %)
$HON (+1,43 %)
$DOW (+5,61 %)
$NOKIA (+1,98 %)
$TMUS (-0,75 %)
$INTC (+3,52 %)
$NEM (+1,84 %)
$F (+3,63 %)
$PG (+1,87 %)
$GD (+0,45 %)
Opportunity seized
After giving a lot of thought to whether I should add to one of my many positions or look for a tidbit, I decided to welcome SAP to my portfolio - one of the few companies in Germany that still has sufficient potential, but is moving sideways this year.
In addition, I will probably be getting rid of some positions soon and cleaning up my portfolio a little by the end of the year - at least that's my plan... The following are the main ones that catch my eye
Once bought with the idea of dividends and a possible turnaround in mind, I doubt that the situation with these companies will change abruptly and now regard them more as yield killers.
SAP comes in handy as an addition in order to still be able to invest alongside $ALV (+1,33 %) and $DHL (+3,23 %) another German company in the portfolio.
My review for September 2025: facts, figures and data - honest and unembellished
September was the month in which my account shone like the last rays of summer sunshine! Why? The half-year bonus catapulted this month into the month with the highest income of all time. Of course, the money doesn't go into savings, but is put into the market the following month, because share price growth and dividends beat any consumption. There was also an unexpected refund from the dental supplement, which has already been reinvested. Who says that prophylaxis doesn't bring returns after all?
And what else? Business as usual: preparations for ice swimming started at the end of the month thanks to colder temperatures, daily sport and exercise, a nice community meeting of frugalists and investors. Yes, we talked about dividends rather than the latest fashion. Everything was rounded off with a donation. My portfolios went sideways, but did what they are supposed to do: Generate cash flow. And from this month onwards, there will be additional risk figures presented. A little growth and distribution. Time for a review!
Overall performance
This month was a typical month of consolidation for me. My investments moved sideways with only a very slight increase. Is this a good sign for a year-end rally? There was also an initial cut in the Fed's key interest rate. However, there were no major movements, and Q4 is more likely to be responsible for this. As always, income rained down on the account. My key performance indicators for my overall portfolio at a glance:
- TTWROR (month under review): +1,76 % (previous month: +1.01 %)
- TTWROR (since inception): +76,55 %
- IZF (month under review): +9,64 % (previous month: +12.50 %)
- IZF (since inception): +11,15 %
- Delta: +€615.12
- Absolute change: +€2,635.52
Performance & volume
The rise in the price of $AVGO (-1,84 %) allows my largest single share position to grow further and strengthens its dominance. And the class leader has not spilled the beans in terms of performance since purchase either: +337%! After the $BAC (+1,15 %) climbed into the top 5 by volume in the previous month, it remains in this group. The banks are currently doing well. Also$WMT (-0,97 %) The retail giant is a reliable dividend payer and an important pillar among my individual stocks. The competitor$TGT (+4,78 %) on the other hand, is the red lantern in my portfolio. Despite thefts and sales problems, I see a healthy business model. I am sure that this share will bounce back and continue to invest on a monthly basis.
Size of individual share positions by volume in the overall portfolio:
Share (%) of total portfolio and associated portfolio:
$AVGO (-1,84 %) 3.30 % (main share portfolio)
$NFLX (-0,76 %) 1.87 % (main share portfolio)
$WMT (-0,97 %) 1.74 % (main share portfolio)
$FAST (+0,99 %) 1.72 % (main share portfolio)
$BAC (+1,15 %) 1.49 % (main share portfolio)
Smallest individual share positions by volume in the overall portfolio:
Share (%) of the total portfolio and associated securities account:
$SHEL (-0,09 %) : 0.41 % (crypto follow-up portfolio)
$NOVO B (+0,28 %) 0.50 % (main share portfolio)
$TGT (+4,78 %) 0.55 % (crypto follow-on deposit)
$HSBA (+1,27 %) 0.58 % (main share portfolio)
$GIS (+1,18 %) 0.60 % (main share portfolio)
Top-performing individual stocks
Shares with performance since initial purchase (%) and the respective portfolio:
$AVGO (-1,84 %) a: +337 % (main share portfolio)
$NFLX (-0,76 %) : +153 % (main share portfolio)
$WMT (-0,97 %) : +78 % (main share portfolio)
$FAST (+0,99 %) +76 % (main share portfolio)
$SAP (+1,73 %) +75 % (main share portfolio)
Flop performer individual stocks
Shares with performance since initial purchase (%) and the respective portfolio:
$TGT (+4,78 %) : -38 % (main share portfolio)
$GIS (+1,18 %) -31 % (main share portfolio)
$NKE (+2,78 %) -27 % (main share portfolio)
$CPB (+2,81 %) -24 % (main share portfolio)
$UPS (+4,45 %) -24 % (main share portfolio)
Asset allocation
My asset allocation is as follows:
ETFs: 39.1%
Equities: 58.6%
Crypto: 2.2 %
P2P: less than 0.01 %
Investments and subsequent purchases
I have invested the following amounts in savings plans:
Planned savings plan amount from the fixed net salary: € 1,030
Planned savings plan amount from the fixed net salary, incl. reinvested dividends according to plan size: € 1,140
Savings ratio of the savings plans to the fixed net salary: 49.75
In addition, the following additional investments were made from returns, refunds, cashback, etc. as one-off savings plans/repurchases:
Subsequent purchases/one-off savings plans as cashback annuities from refunds: € 73.00
Subsequent purchases/non-recurring savings plans as cashback annuities from bonuses/incentives from the KK: € 0.00
Subsequent purchases from other surpluses: € 31.00
Automatically reinvested dividends by the broker: € 5.03 (function is only activated for an old custody account, as I otherwise prefer to control the reinvestment myself)
Additional purchases were made:
Number of additional purchases: 2
73.00 € for $TDIV (+2,2 %)
25.00 € for $ZPRG (+2,28 %)
Passive income from dividends
My income from dividends amounted to € 139.14 (€ 128.42 in the same month of the previous year). This corresponds to a change of -1.36% compared to the same month last year. The slight decrease is due to the fact that my large Vanguard ETFs postponed the distribution to the following month. The following are further key data on the distributions:
Number of dividend payments: 34
Number of payment days: 17 days
Average dividend per payment: € 4.09
average dividend per payment day: € 8.18
The top three payers are:
My passive income from dividends (and some interest) mathematically covered 16.05% of my expenses in the month under review.
Crypto performance
My crypto portfolio ran sideways in September with highs and lows. The hope here lies more in the coming Q4. My key figures:
Performance in the reporting period: +8.66 %
Performance since inception: +135.10
Share of holdings for which the tax holding period has expired: 98.57 %.
Crypto share of the total portfolio: 2.20 %
I am vigilant with regard to crypto. The exit should continue. I don't want to provide the exit liquidity for the other market participants. There will be news in the following month.
Performance comparison: portfolio vs. benchmarks
A comparison of my portfolio with two important ETFs shows:
TTWROR (current month): +1,76 %
$VWRL (+1,2 %) : +2,63 %
$VUSA (+1,33 %) : +2,56 %
One possible explanation for the poorer performance compared to the index values could be a higher proportion of individual shares,
New: Risk indicators
Here are my key risk figures for the month under review (and in brackets YTD)
Maximum drawdown: 0.94% (17.17%)
Maximum drawdown duration: 19+ days (231+ days)
Volatility: 1.68% (11.51%)
Sharpe Ratio: 5.73 (0.29)
Semi-volatility: 1.21% (9.04%)
An extremely low drawdown of only 0.94% shows that your portfolio had hardly any fluctuations during the month. This is typical for a sideways phase or stable markets.
The YTD drawdown of 17.17% is no coincidence: Trump's tariffs have mainly affected consumer-related stocks such as $TGT (+4,78 %) have been hit. However, my focus on stable dividend payers and broad-based ETFs has limited the losses. The fact is, however, that Trump has put a dent in my figures.
Outlook
As you can see from the introduction, there were no highlights, but there were also no disasters for me to report on. So we're done for this month. Thanks for reading!
However, I still have some questions for you to improve my review:
Are you also interested in the performance and top/flop5 of my ETFs or cryptos? Then let me know in the comments and I'll include it in the coming months.
In my posts on Instagram and also here, I keep talking about my cashback pension. Would you like to know more about the concept, what's behind it for me and how it will supplement my "share and ETF pension"?
My review here on getquin includes additional key figures as well as those from my Instagram reviews. Would you also like to see more from the budget review of my private finances included here as a little extra?
👉 Would you like to view my review as an Instagram Carousel post?
Then follow me on Instagram:
📲 There's also 3 posts a week in addition to the portfolio and budget review: @frugalfreisein
Please pay close attention to the spelling, unfortunately there are too many fake and phishing accounts on social media. I have also been "copied" several times now.
👉 How was your month in the portfolio? Do you have any tops and flops to report?
Leave your thoughts in the comments!
100k reached
With the posting of $MSFT (-0,83 %) , $ABBN (-0,83 %) , $SAP (+1,73 %) and $AAPL (+2,27 %) my portfolio has broken through the 100k mark. A position with 30 $BRK.B (+0,46 %) should be booked in the next few weeks. USA is still underweighted at the moment, so I would like to buy $VUAG (+1,35 %) buy more.
What do you think of the current allocation?
And if you use the time now, as you have already written, to buy the USA cheaply due to the currency situation, then you will be able to sleep peacefully despite all the short-term unrest.
Valores en tendencia
Principales creadores de la semana