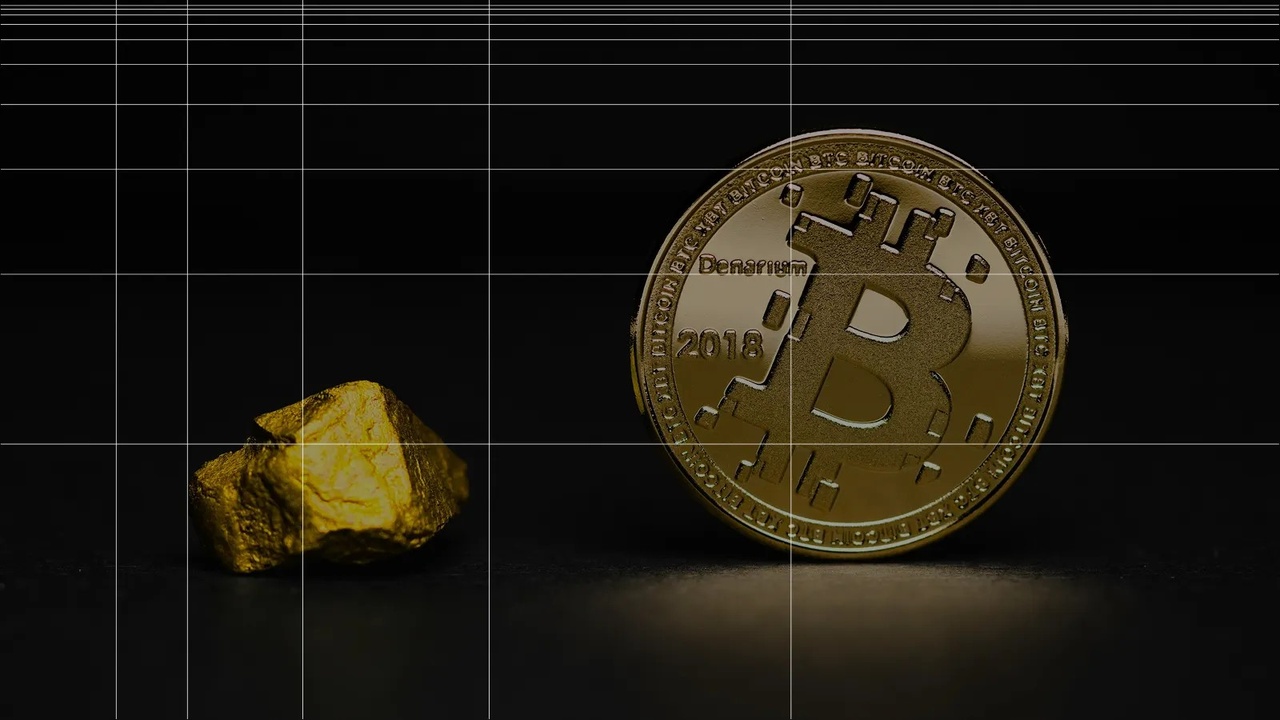
When it comes to Bitcoin $BTC (-3,32 %) opinions are divided: Some see it as just a digital casino, others as the hardest currency in the world. For me, Bitcoin is digital gold but with a significantly better return potential than physical gold $IGLN (+0,81 %)
Especially with Bitcoin I find the technical chart analysis particularly exciting. Because here human psychology, value attribution, cycles play an even greater role here than with many traditional shares, which in my opinion often makes it easier to predict future movements.
As with any hobby, a bit of coffee grounds reading for men and in the case of Bitcoin, this is not only entertaining but also relevant. Because here timing can be crucial and a cleverly placed Lump Sum purchase quickly turns into digital gold, literally!
Those who only rely on DCA (dollar-cost averaging) have historically often been at a disadvantage with Bitcoin, even more so than with conventional equities. That's why I'm sharing my analysis here for all those who want to take a bit of a gamble when investing in Bitcoin. timing to achieve a better return than would be possible with pure DCA.
Fibonacci levels - the magic of numbers (colored bars)
Hardly any analysis can do without the famous Fibonacci retracements without the famous Fibonacci retracements. The idea: markets do not move randomly, but react to certain percentage retracement levels (0.236, 0.382, 0.5, 0.618, 0.786 ...). The chart shows how Bitcoin repeatedly reacts to these levels. Whether these are laws of nature or self-fulfilling prophecies is up to you. The fact is that many traders pay attention to them.
Elliott waves - five up, three down (1,2,3,4,5 / A,B,C)
In the big picture, the chart currently fits well into the classic Elliott wave theory theory:
- We had five waves up (1-5 in green).
- Now comes the logical consequence: an ABC correction.
The pattern: wave (A) down, a countermovement (B) up, and then another deeper crash (C).
My tactics - DCA and Lump Sum
I plan to trade in the green boxes with DCA (Dollar-Cost-Averaging) to enter the green boxes. However, should Bitcoin cross the yellow line reaches the yellow line, I will make a lump sum purchase (a larger sum at once).
The boxes are my "retreat zones", so to speak, where I expect the market to stop sooner or later. The lower the box, the less likely it is to reach this green box, but in the case of Bitcoin, with corrections of between -30% and -90% in the past, this is still within the realm of possibility!
And now the questions for you
This is my strategy. But how do you do it?
- Are you betting on DCA, regardless of the price?
- Do you wait patiently for a major correction?
- Or do you go all-in as soon as a certain level is reached?
In the end, every investor and trader has their own philosophy and that's what makes the world of charts so exciting!
Greetings Lord Vader!
(Disclaimer: The analysis discussed in this post can just as easily be right as it can be wrong. Technical analysis is only based on the past and is not a given for the future. Therefore, regardless of how Bitcoin performs, I have a fixed hodl position that will not be touched. The mentioned strategy refers to new investments of mine with a short to medium term holding period. Even if Bitcoin never reaches these prices again, I am well invested! No investment advice, just my opinion).