
$EL (+2,78 %)
$TEM (-5,74 %)
$VRTX (+1,64 %)
$AAPL (-1,58 %)
$PLTR (-5,23 %)
$ON (-2,2 %)
$ZAL (-0,52 %)
$BAYN (+5,27 %)
$DOCN (-5,9 %)
$SHOP (-4,87 %)
$RACE (-1,38 %)
$PFE (+1,26 %)
$PS (-6,99 %)
$DUOL
$SMCI (-1,07 %)
$CPNG (-0,37 %)
$BMW (-0,05 %)
$NOVO B (+2,56 %)
$UBER (+0,57 %)
$CVS (-0,26 %)
$DDOG (-8,43 %)
$MCD (+0,02 %)
$FSLY (-6,41 %)
$HUBS (-0,47 %)
$ELF (-0,64 %)
$QCOM (-7,5 %)
$ARM (-2,74 %)
$SNAP (-3,64 %)
$APP (-9,25 %)
$MELI (-1,4 %)
$FIG (-1,23 %)
$SHL (-0,43 %)
$DHL (-0,71 %)
$RHM (-2,1 %)
$LMND (-5,38 %)
$OSCR (-1,31 %)
$LYFT (-1,37 %)
$DBX (+0,03 %)
$ABNB (-1,92 %)
$NET (-6,48 %)
$TEAM (-3,76 %)
$LITE (-5,35 %)
$IREN (-4,1 %)
$OKLO
$MRNA (-0,09 %)
$UAA (-0,89 %)

DHL AG
Stock
Stock
ISIN: DE0005552004
Ticker: DHL
DE0005552004
DHL
Price
Debate sobre DHL
Puestos
32322H·
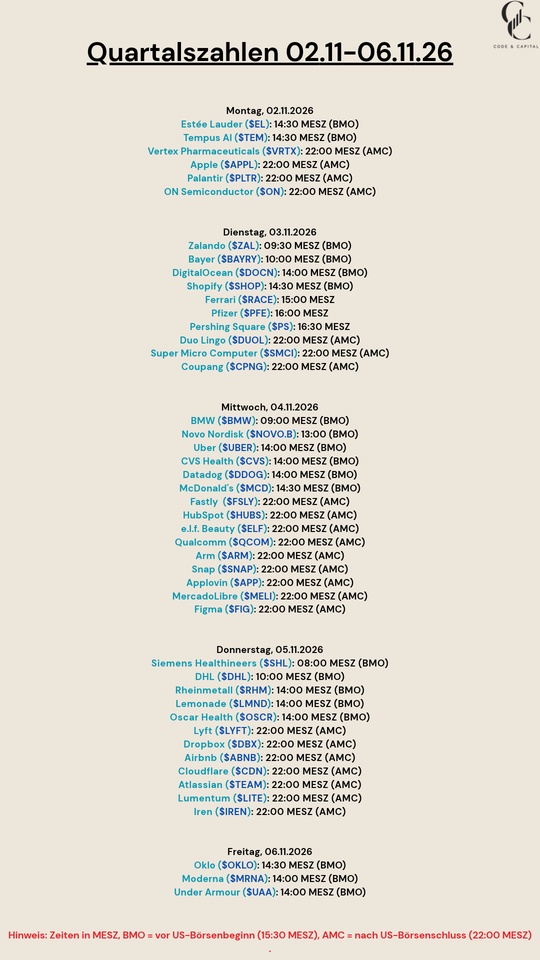
Quarterly Results Nov. 2–Nov. 6, 26
1111

2Semana·
𝐃𝐇𝐋 Group: 𝐄𝐫𝐡ö𝐡𝐭 𝐄𝐁𝐈𝐓-𝐏𝐫𝐨𝐠𝐧𝐨𝐬𝐞 𝐧𝐚𝐜𝐡 𝐬𝐭𝐚𝐫𝐤𝐞𝐦 𝐐𝟑, 𝐄𝐱𝐩𝐫𝐞𝐬𝐬 𝐚𝐥𝐬 𝐖𝐚𝐜𝐡𝐬𝐭𝐮𝐦𝐬𝐭𝐫𝐞𝐢𝐛𝐞
📊 𝐄𝐫𝐠𝐞𝐛𝐧𝐢𝐬𝐬𝐞
• Q3 Revenue: €22.6 billion (+over 12%)
• Group EBIT: €1.71 billion (+16%)
• DHL Express EBIT: €1.035 billion (previous year: €692 million)
• Global Forwarding EBIT: €260 million (previous year: €195 million)
• Supply Chain EBIT: €300 million (previous year: €278 million)
• Q3 free cash flow: approximately €900 million
⠀
🎯 𝐀𝐮𝐬𝐛𝐥𝐢𝐜𝐤
• Group EBIT 2026: over €7.0 billion (previously over €6.5 billion)
• DHL Divisions EBIT: over €6.4 billion (previously over €5.9 billion)
• Free cash flow: over €3.2 billion (previously approximately €3.0 billion)
• Capex: approximately €3.6 billion (previously €3.0–3.3 billion)
• Medium-term forecast will be reviewed in March 2027
⠀
📌 Key Points
• DHL Express benefits from higher transport volumes, improved capacity utilization, and effective cost measures
• Capacity constraints in the air freight market contributed approximately €100 million to EBIT in Q3
• Broad earnings momentum across multiple business segments and initial signs of robust seasonal performance in Q4
• Free cash flow at approximately €900 million despite a €255 million burden from IEEPA payments
• Higher investments are expected to enable additional growth opportunities
• The full Q3 report will follow on November 5, 2026
1313

2Lun·
Top News Stories from the Past Week
As we do every week, here are the top stories from the past week:
Tuesday:
$PLTR (-5,23 %) is driving the entire AI market higher. Quarterly revenue was nearly $200 million above expectations. Earnings per share were also significantly higher than expected.
Wednesday:
Expectations for $DHL (-0,71 %) DHL were already high, causing the stock to dip slightly, but DHL reported strong results. Profit increased by more than 20%. Revenue also rose by about 12% to 22.37 billion euros.
Thursday:
$G24 (+2,08 %) Scout24 continues to grow strongly. In Q2, revenue rose by 20% to just under 200 million euros. AI integration was also significantly expanded.
https://www.wallstreet-online.de/nachricht/21205218-scout24-starkem-q2-umsatz-20-bereinigtes-eps-18
As a result, $RWE (-2,06 %) RWE is withdrawing from wind power projects in the U.S., the government is paying $1.2 billion. RWE plans to use the money, among other things, to invest in a liquefied natural gas project.
44

2Lun·
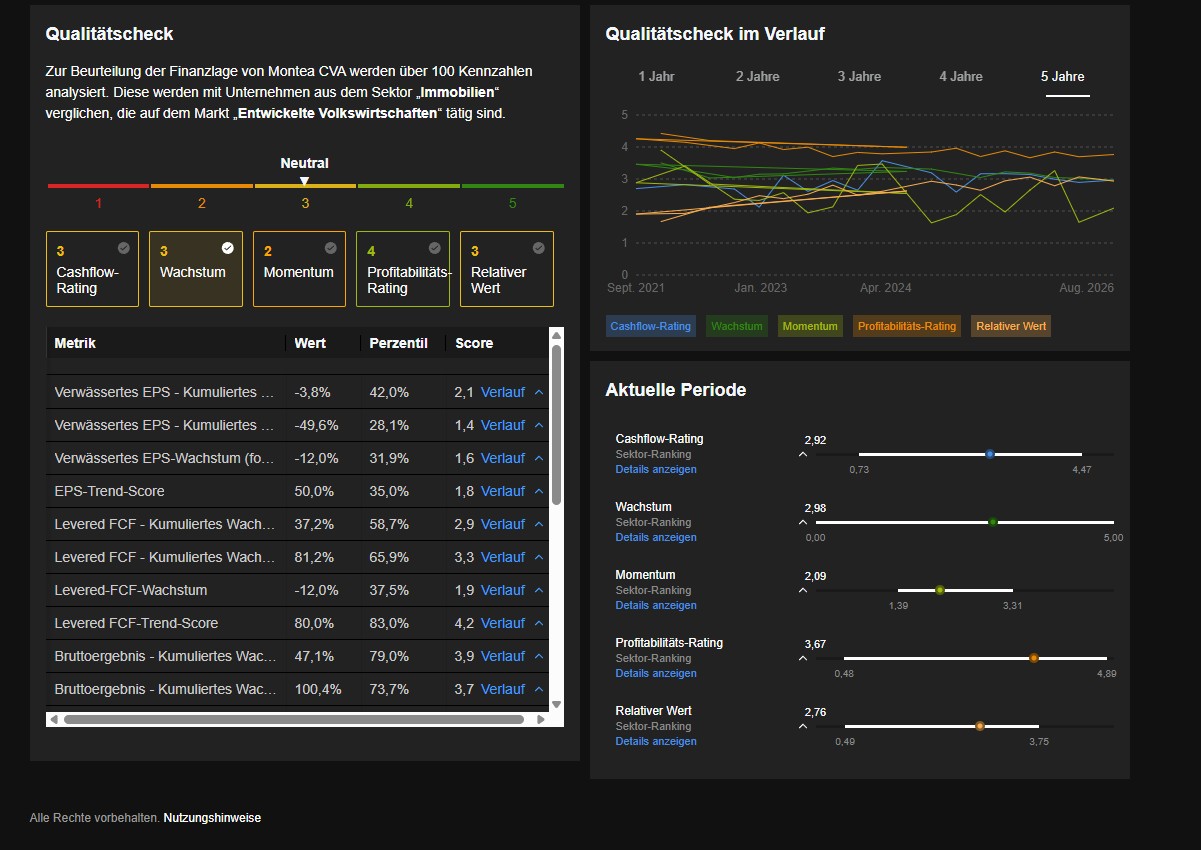
🏭 Montea CVA - The Belgian Logistics Giant in REIT Form
Why Montea is the "backbone" of European supply chains!
Imagine ordering a pair of shoes, a new espresso machine, or replacement parts for your solar system online in the evening and having the package in your hands the very next day. There’s no magic behind this seemingly magical process—just rock-solid logistics infrastructure—and that’s exactly where Montea comes into play.
$MONT (+1,31 %) doesn’t just operate “warehouses.” The company owns and leases so-called prime logistics properties along the most important arteries of European freight transport (the so-called Benelux-Northern France-Germany Corridor).
Let’s get started—15 points, 15 facts from the engine room!
1. What the company does & how it was founded
Montea NV (formerly Montea Comm VA) is a Belgian real estate investment trust (REIT). The company develops, acquires, and manages logistics and semi-industrial properties. Its geographic focus is on key markets in Central Europe: Belgium, the Netherlands, France, and Germany. Montea benefits directly from the ongoing e-commerce boom and the realignment of global supply chains (nearshoring).
When you open the gates to Montea’s complexes, you won’t find dusty junk, but rather state-of-the-art, highly specialized assets:
- e-commerce and retail giants (e.g., $DHL (-0,71 %)
, $AMZN (+4,71 %)
, XPO Logistics): Fully automated sorting facilities, high-bay warehouses, and kilometers of conveyor belts. Millions of consumer goods—ranging from electronics to clothing to household goods—are stored here and packaged and shipped around the clock.
- Pharmaceutical giants & cold-chain logistics: Temperature-controlled warehouses (“cold storage”). These facilities store essential medications, vaccines, and fresh food. These warehouses require extremely high technical standards and provide Montea with particularly long-term, crisis-proof lease agreements.
- Industry & Automotive (Nearshoring): Spare parts warehouses for the automotive and mechanical engineering industries. Due to geopolitical tensions, European companies are bringing their warehousing operations back to Europe (nearshoring). Montea’s warehouses serve as buffer storage facilities to ensure that industrial production lines do not come to a standstill when cargo ships from Asia are delayed.
2. Current Key Figures & Facts
- Current Share Price:
€67.10 (or €67.30 based on the last official closing price) - 52-week range:
€63.20 – €78.80 - Revenue (LTM):
€176.2 million - Net income (LTM):
€165.1 million - Price-to-Earnings Ratio (P/E):
9.5x (Trailing) / 12.9x (Forward 2026) - Price-to-Cash Flow Ratio (P/CF) / FCF Yield:
7.2% - Price-to-Sales Ratio (P/S): approx. 8.9x (is 80.3% of the 3-year average)
- Price-to-Book Ratio (P/B):
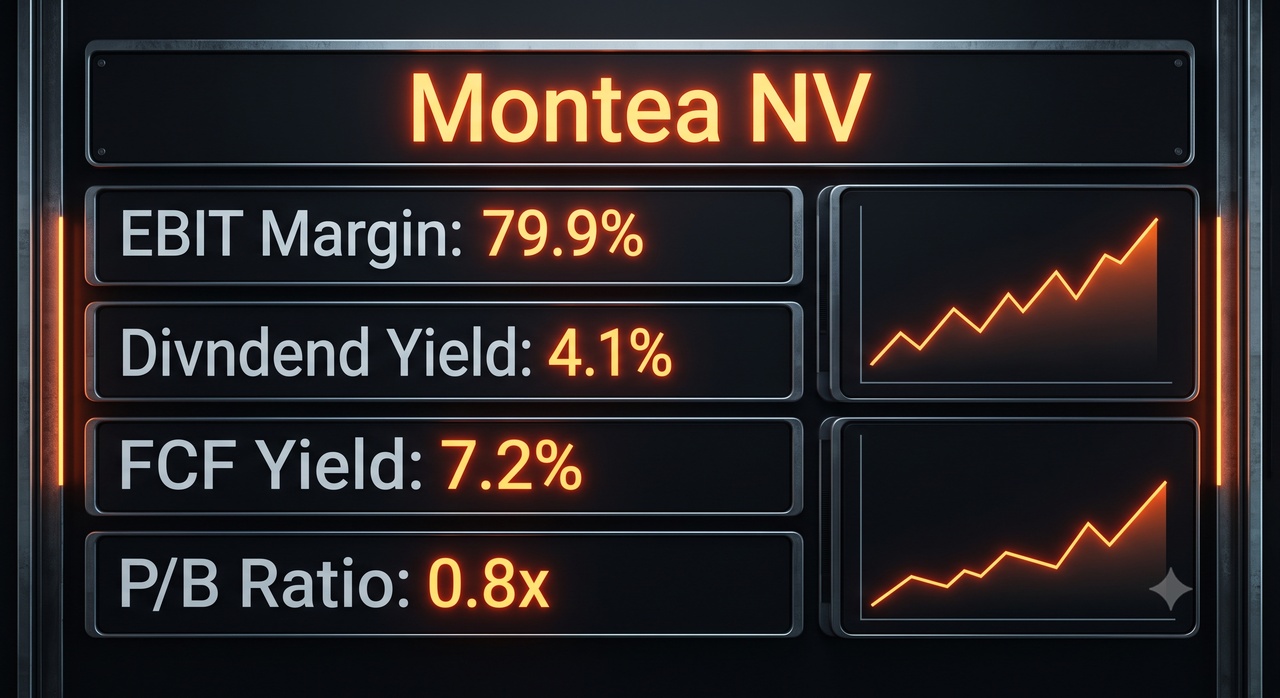
0.8x (The stock is trading below its book value/NAV!)
3. Core Quality Formula (Revenue Growth + Margin)
Our target score for growth stocks is > 25. For real estate REITs, the figures are structurally extremely high, as there is virtually no cost of goods sold.
- Revenue Growth:
23.1% - Operating EBIT Margin:
79.9% - Score: $23{,}1 + 79{,}9 = 103{,}0$
- Conclusion: The score is off the charts. Growth of 23.1% in a challenging interest rate environment is a powerful sign of strength and pricing power in the rental market.
4. Cash Flow Quality Formula
- FCF Yield (Free Cash Flow Yield):
7.2% - Conclusion: Our target of > 5% is easily exceeded. The 7.2% shows that Montea is a true cash machine that generates sufficient funds for dividends and organic growth.
5. Dividend Filter (Income-Core)
- Dividend Yield:
4.10% (€2.75 per share annually) - Payout ratio:
52.13% - Growth streak: Dividend payments have been maintained for 20 years.
- Conclusion: A perfect fit for the Income Core! The yield is above 3.5%threshold, and the payout ratio of just over 50% leaves plenty of room for investments or times of crisis.
6. Exclusion Rule Check
- Is revenue stagnating? No (+23.1%).
- EBIT margin < 5%? No (79.9%).
- Dividend not covered? Yes, strong FCF and 52% payout ratio.
- Conclusion: No exclusion rule applies. Green light!
7. Future and Industry Outlook
The logistics industry is undergoing a transformation. On the one hand, high interest rates are weighing on portfolio valuations. On the other hand, nearshoring (bringing production back to Europe) and e-commerce are further driving demand for first-class warehouses at key transportation hubs (ports, highways). With its focus on the Benelux region, Montea is strategically positioned at the heart of Europe’s logistics network.
Why is Montea so extremely important?
- The “one-of-a-kind” rental spaces: Vacant lots at central highway interchanges or near the major ports of Rotterdam and Antwerp are in short supply in Europe. Anyone who builds there has a kind of “infrastructure monopoly.”
- Sustainability as a competitive advantage: Montea is equipping the vast roofs of its logistics centers across the board with solar panels (Green Logistics). This allows tenants to save on energy costs and meet their ESG requirements, which makes the switching costs to other providers extremely high.
In short: Montea doesn’t just rent out space—it rents out the lifelines of European commerce. Without these facilities, the supply chain in supermarkets, cities, and factories would collapse within a matter of days.
8. Competition
In the European logistics real estate sector, Montea competes with strong players such as WDP, VGP, Segro, and Tritax Big Box. Montea’s advantage lies in its strict focus on strategic “multimodal” locations and its extremely conservative cash management. A P/B ratio of 0.8x indicates that, compared to the rest of the industry, the stock is currently trading at a discount to its net asset value.
9. Analyst Forecasts & Fair Value
- Analyst Consensus (8 analysts):
€80.50 - Deutsche Bank: Maintains "Buy" rating but lowers the target price from €85.00 to €73.00.
- InvestingPro Fair Value:
€68.47 (According to screenshot: +2.0% upside). Your text excerpt mentions €65.66 (-1.74% risk), which shows that the mathematical valuation models consider the current price to be fairly valued. However, analysts see a clear discount.
10. Chart Analysis of the Last Few Months
- Trend: The stock is trading at 98.6% of the 200-day moving average, meaning it is currently battling the long-term trend resistance.
- Performance: Slightly down over the past month (-0.88%), but up over the past 12 months (+4.22%).
- Stability: The stock is hovering around the €67 after rebounding from its 52-week low of €63.20 .
11. Bargain Hunter List (Entry Zones)
Since the stock is currently stabilizing and trading near its calculated fair value, there are three strategic entry zones:
- Zone 1 (Fair Value Range / First Tranche):
- Price range:
€66.00 – €68.50 - Strategy: Current level. Offers a solid entry point for the first tranche or to start a savings plan, as the stock is fairly valued and provides a dividend yield of over 4%.
- Zone 2 (Support Zone / Test of the Year’s Low):
- Price range:
€63.00 – €64.50 - Strategy: Range near the 52-week low (€63.20). A pullback into this zone offers an excellent opportunity to buy more, as institutional investors have increasingly stepped in here in the past.
- Zone 3 (Bargain Hunter / Crisis Discount):
- Price range:
€55.00 – €60.00 - Strategy: Absolute bargain territory. At these prices, the dividend yield jumps to well over 4.5%, and the price-to-book ratio (P/B) becomes extremely attractive. This is the time to significantly increase your position.
12. Future Viability
Montea is exceptionally well-positioned. A net debt-to-total-capital ratio (LTV) of 44.3% is extremely moderate for a REIT and provides protection against interest rate shocks. According to forecasts, EPS (earnings per share) growth is expected to be solid over the next few years, reaching €5.58 (2027) and €6.05 (2028). The competitive moat provided by prime locations is strong.
13. Potential Alternatives
If you want to diversify the geographic risk (Benelux), consider Prologis (U.S./Global), Segro (UK/Europe), or even the Belgian competitor WDP .
14. Profit Margin Report
- Gross Margin: Phenomenal efficiency.
- EBIT Margin: At 79.9% , Montea demonstrates that rental income is passed through to operating income with minimal friction losses.
- ROCE (Return on Equity):
8.8% is a more than solid figure for the capital-intensive real estate business.
15. Management & the CEO’s Perspective: How Does Leadership View the Company’s Course?
To truly understand a real estate company, you need to know who is at the helm and how management assesses the future.
Who leads Montea?
- Chief Executive Officer (CEO):
Jo De Wolf - Jo De Wolf has been leading Montea since 2010 and is regarded as an experienced veteran in the European logistics industry. Under his leadership, the portfolio has grown from just under 200 million euros to over 3.5 billion euros today.
- Skin in the Game (Equity Stake): De Wolf himself holds over 134,000 Montea shares (valued at approximately 9 to 12 million euros). His personal wealth is therefore directly tied to the company’s success—a perfect signal for us shareholders!
Management’s Key Strategic Messages:
- The Growth Plan (“Track27”): Jo De Wolf and his team have developed the strategy "Track27" . By the end of 2027, Montea plans a total investment of 1.2 billion euros in new logistics space, green energy (solar power/battery storage), and strategic acquisitions. The goal is to continuously increase operating recurring earnings (EPRA EPS) by an average of 6% per year by 2027.
- Focus on “like-for-like” rent growth: The CEO regularly emphasizes in his statements that Montea achieves growth not only through expensive new acquisitions, but primarily through the renewal and renegotiation of existing leases. For upcoming lease renewals, Montea achieves, on average, rent uplifts of 10% to 20%.
- "Our strong leasing momentum underscores the sustained demand for high-quality logistics space in strategic locations. This allows us to command higher rents and invest exclusively in locations that offer our customers the greatest value." – Jo De Wolf (CEO)
- Conservative debt management as a protective shield: In light of rising interest rates in recent years, management has maintained strict discipline in managing the balance sheet. The loan-to-value ratio stands at an extremely solid ~39–44%, and the average interest rate on existing loans is kept at a very low 2.2% . De Wolf makes it clear that balance sheet discipline remains the foundation for avoiding pressure during crises and instead seizing opportunities flexibly as they arise.
Conclusion on Management:
No pie-in-the-sky promises, but rather a down-to-earth, highly experienced team that holds a stake in the company itself. The fact that the CEO has been in office for over 15 years, demonstrates continuity, and has safely steered the company through the interest rate crisis of recent years lends the investment an enormous sense of fundamental stability.
RaketenToni’s Conclusion & Risk Disclosure
Montea is a classic “cash cow” for a dividend strategy!
You’re not buying into an artificial hype story here, but rather rock-solid fundamentals at a hefty discount to book value (P/B 0.8x).
The dividend is secure, the payout ratio lets you sleep soundly at night, and the P/E check is flawless.
A strong anchor tenant for any dividend portfolio.
The only downside: in the current interest rate environment, you shouldn’t expect price surges of +50% in a year from REITs. It’s a long-distance runner!
And, of course, all the others :)

1818
14 Comentarios
Keineui@Keineui
2Lun
•
44
•Ver todas las 3 respuestas adicionales

2Lun·
DHL After Its Quarterly Results – Strong Operational Performance
Today, $DHL (-0,71 %) released its quarterly results. At first glance, the numbers look promising. What interested me most was whether the points I had highlighted as particularly important in my post before the quarterly results were confirmed. That’s exactly why I’ve re-evaluated the numbers in light of my original investment thesis.
First, a look at the numbers:
• EPS (expected): 0.89 EUR
• EPS (reported): 0.90 EUR
• Revenue (estimated): 20.94 billion EUR
• Revenue (reported): 22.37 billion EUR
One of my key watchpoints was profitability. Here, $DHL (-0,71 %) a positive surprise for me. EBIT rose by about 30% to €1.9 billion, significantly exceeding the prior-year figure. What I find particularly important, however, is that the company’s strength no longer stems exclusively from cost cuts. The express business, in particular, once again performed very robustly and benefited from higher shipment volumes as well as solid international demand. That’s exactly what I had hoped to see going in.
The measures under the “Fit for Growth” program also continue to have an impact. As I mentioned earlier, however, it was important to me that the core business once again contribute more significantly to growth, and the current figures give me exactly that impression. To me, this is a much better sign than if earnings had been improved solely through cost savings.
Another key point for me was free cash flow and capital allocation. There was good news here as well. The fact that $DHL (-0,71 %) the ongoing share buyback program has been increased once again by €500 million to a total of €6.5 billion is, in my view, a strong signal. To me, this shows that management continues to have confidence in the company’s own business performance.
I was also pleased with the performance of the other business segments. In addition to the strong express business, Global Forwarding and Supply Chain also posted solid results. To me, this confirms that the company’s current strength is built on multiple pillars and isn’t driven by just a single segment.
There were no negative surprises in the outlook either. After $DHL (-0,71 %) the EBIT forecast had already been raised in July, it has now been confirmed. Management remains confident despite geopolitical uncertainties. Changes in global supply chains and stable demand for logistics services remain key drivers.
As expected, there was no major news regarding the partnership with Leidos. For me, this remains an interesting long-term topic that could complement the investment story. However, it does not yet play a decisive role in the current performance.
For the coming quarter, I will primarily be watching to see whether the positive trend in the express business continues and $DHL (-0,71 %) whether the current growth can be sustained. It will also be interesting to see whether margins can be maintained at their current level and whether global trade flows continue to stabilize.
For me, the figures confirm my investment thesis. I find it particularly positive that $DHL (-0,71 %) growth is now once again coming more strongly from the core business and is no longer primarily driven by ongoing efficiency measures. However, following the strong stock price performance, market expectations will continue to rise. Therefore, in the coming quarters, the focus is likely to shift from simply delivering good results to sustainably confirming the current trend. My personal assessment therefore remains largely unchanged. $DHL (-0,71 %) remains an important component of my portfolio. Following the strong stock performance, I am somewhat more cautious about making further purchases; however, today’s figures tend to reinforce rather than call into question my long-term investment thesis.
~ Not investment advice ~
2Lun·
DHL Ahead of Its Quarterly Results – Will It Stay the Course?
On August 5, $DHL (-0,71 %) its quarterly earnings. According to the current analyst consensus (Investing.com), the following are expected:
• EPS: €0.89
• Revenue: €20.94 billion
Revenue and EPS only provide a first impression at this stage. I find the question of whether $DHL (-0,71 %) the company can confirm the current recovery. Following the strong stock performance, expectations have now risen significantly. For me, it will therefore be particularly important to see whether $DHL (-0,71 %) can continue to grow under its own steam or whether the recent strong results are primarily due to consistent cost discipline.
Consequently, I’ll be paying close attention to EBIT, free cash flow, margin trends, and the performance of the individual business segments. In particular, the Express, Global Forwarding, and Supply Chain segments are likely to once again be the main drivers of growth. I’m particularly curious to see whether the Express business will continue to stabilize and whether the international B2B business will gain additional momentum. At the same time, I’m interested in whether the global trade environment will provide some tailwind again or whether demand will remain rather subdued.
Another point I’ll be keeping an eye on is the ongoing “Fit for Growth” program. The planned cost savings have recently been a key driver of earnings. In the long term, however, I expect growth to come more strongly from core operations again, rather than primarily from cost reductions.
When it comes to capital allocation, however, I do not expect any major surprises. $DHL (-0,71 %) In recent years, the company has demonstrated that dividends, share buybacks, and investments are well balanced. For me, therefore, the key factor remains whether free cash flow can continue to adequately cover capital returns while still leaving sufficient leeway for investments.
I also find the recently announced partnership with Leidos exciting. While it’s unlikely to play a role in the upcoming quarterly results, in the long term it could $DHL (-0,71 %) open up access to an interesting market in the field of defense logistics. For my investment thesis, this is currently more of a bonus than a decisive factor.
I also find the analyst consensus interesting. According to Investing.com, 5 analysts currently recommend buying the stock, 12 rate it as a “Hold,” and 3 issue a “Sell” recommendation. The average price target is currently even slightly below today’s price. To me, this shows that the market has become somewhat more cautious following the strong price performance. That’s precisely why, this time around, it’s likely to be less about the actual numbers and more about management’s outlook.
My key points to watch for the quarterly results
• EBIT and operating margin trends
• Free cash flow and capital allocation
• Shipment volume trends in the express business
• Performance of the Global Forwarding and Supply Chain divisions
• Progress on the “Fit for Growth” program
• Comments on global trade and transport volumes
• Outlook for the second half of the year
Overall, I expect a solid quarter, but I believe that a slight beat in revenue or EPS will hardly be enough this time. It will be much more important to see whether $DHL (-0,71 %) can demonstrate that the core business is regaining momentum and that the chosen course is sustainable. $DHL (-0,71 %) is already part of my portfolio. Following the strong price performance, I’m currently a bit more cautious about making further individual purchases, but I’m keeping the stock in my savings plan because I’m convinced of the company’s long-term potential. For me, the upcoming quarterly results will therefore primarily show whether the market has already priced in a large portion of the company’s positive development, or whether we are seeing a sustainable and long-term positive trend here.
~ Not investment advice ~
1111
2Lun·
DHL Ahead of Its Quarterly Results – Will It Stay the Course?
On August 5, $DHL (-0,71 %) its quarterly earnings. According to the current analyst consensus (Investing.com), the following are expected:
• EPS: €0.89
• Revenue: €20.94 billion
Revenue and EPS only provide a first impression at this stage. I find the question of whether $DHL (-0,71 %) the company can confirm the current recovery. Following the strong stock performance, expectations have now risen significantly. For me, it will therefore be particularly important to see whether $DHL (-0,71 %) can continue to grow under its own steam or whether the recent strong results are primarily due to consistent cost discipline.
Consequently, I’ll be paying close attention to EBIT, free cash flow, margin trends, and the performance of the individual business segments. In particular, the Express, Global Forwarding, and Supply Chain segments are likely to once again be the main drivers of growth. I’m particularly curious to see whether the Express business will continue to stabilize and whether the international B2B business will gain additional momentum. At the same time, I’m interested in whether the global trade environment will provide some tailwind again or whether demand will remain rather subdued.
Another point I’ll be keeping an eye on is the ongoing “Fit for Growth” program. The planned cost savings have recently been a key driver of earnings. In the long term, however, I expect growth to come more strongly from core operations again, rather than primarily from cost reductions.
When it comes to capital allocation, however, I do not expect any major surprises. $DHL (-0,71 %) In recent years, the company has demonstrated that dividends, share buybacks, and investments are well balanced. For me, therefore, the key factor remains whether free cash flow can continue to adequately cover capital returns while still leaving sufficient leeway for investments.
I also find the recently announced partnership with Leidos exciting. While it’s unlikely to play a role in the upcoming quarterly results, in the long term it could $DHL (-0,71 %) open up access to an interesting market in the field of defense logistics. For my investment thesis, this is currently more of a bonus than a decisive factor.
I also find the analyst consensus interesting. According to Investing.com, 5 analysts currently recommend buying the stock, 12 rate it as a “Hold,” and 3 issue a “Sell” recommendation. The average price target is currently even slightly below today’s price. To me, this shows that the market has become somewhat more cautious following the strong price performance. That’s precisely why, this time around, it’s likely to be less about the actual numbers and more about management’s outlook.
My key points to watch for the quarterly results
• EBIT and operating margin trends
• Free cash flow and capital allocation
• Shipment volume trends in the express business
• Performance of the Global Forwarding and Supply Chain divisions
• Progress on the “Fit for Growth” program
• Comments on global trade and transport volumes
• Outlook for the second half of the year
Overall, I expect a solid quarter, but I believe that a slight beat in revenue or EPS will hardly be enough this time. It will be much more important to see whether $DHL (-0,71 %) can demonstrate that the core business is regaining momentum and that the chosen course is sustainable. $DHL (-0,71 %) is already part of my portfolio. Following the strong price performance, I’m currently a bit more cautious about making further individual purchases, but I’m keeping the stock in my savings plan because I’m convinced of the company’s long-term potential. For me, the upcoming quarterly results will therefore primarily show whether the market has already priced in a large portion of the company’s positive development, or whether we are seeing a sustainable and long-term positive trend here.
~ Not investment advice ~
55
2Lun·
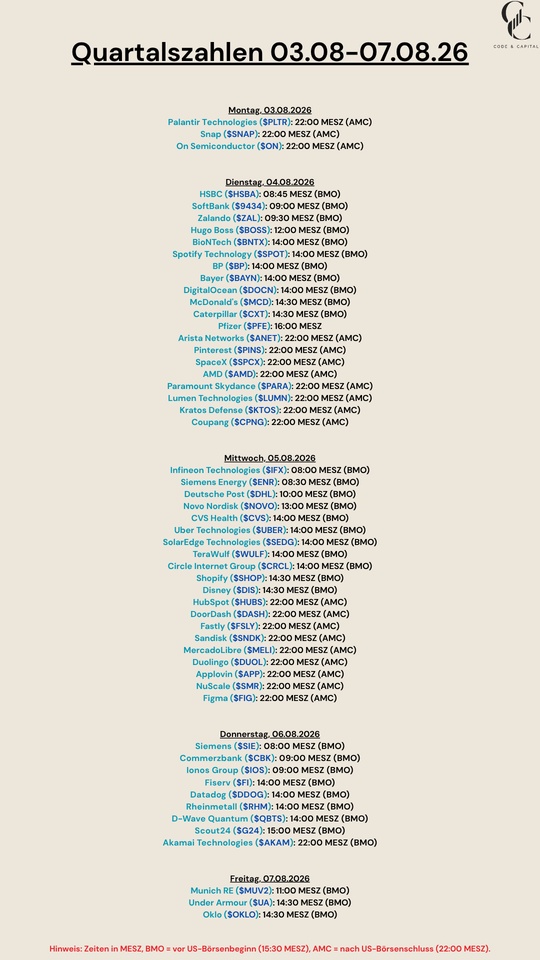
Quarterly Results August 3–7, 2026
$PLTR (-5,23 %)
$SNAP (-3,64 %)
$HSBA (-2,53 %)
$9434 (+1,33 %)
$ZAL (-0,52 %)
$BOSS (+0,19 %)
$BNTX (-0,76 %)
$SPOT (+7,14 %)
$BP. (-0,32 %)
$BAYN (+5,27 %)
$DOCN (-5,9 %)
$MCD (+0,02 %)
$CAT (-2,99 %)
$PFE (+1,26 %)
$ANET (-5,43 %)
$PINS (+9,46 %)
$SPCX (-4,17 %)
$AMD (-5,15 %)
$PARA (+0,71 %)
$LUMN (+2,11 %)
$KTOS (-3,37 %)
$CPNG (-0,37 %)
$IFX (-4,37 %)
$ENR (-6,07 %)
$DHL (-0,71 %)
$NOVO B (+2,56 %)
$CVS (-0,26 %)
$UBER (+0,57 %)
$SEDG (-0,37 %)
$WULF (-4,36 %)
$CRCL (-5,38 %)
$SHOP (-4,87 %)
$DIS (+0,24 %)
$HUBS (-0,47 %)
$DASH (-1,25 %)
$FSLY (-6,41 %)
$SNDK (-10,82 %)
$MELI (-1,4 %)
$DUOL
$APP (-9,25 %)
$SMR
$FIG (-1,23 %)
$SIE (-3,4 %)
$CBK (-1,73 %)
$IOS (-0,62 %)
$FI (+2,93 %)
$DDOG (-8,43 %)
$RHM (-2,1 %)
$QBTS (-6,65 %)
$G24 (+2,08 %)
$AKAM (-4,95 %)
$MUV2 (+1,83 %)
$UA (+0 %)
$OKLO
1313
3Lun·
𝐃𝐞𝐮𝐭𝐬𝐜𝐡𝐞 𝐏𝐨𝐬𝐭: 𝐄𝐫𝐡ö𝐡𝐭 𝟐𝟎𝟐𝟔-𝐏𝐫𝐨𝐠𝐧𝐨𝐬𝐞 𝐧𝐚𝐜𝐡 𝐬𝐭𝐚𝐫𝐤𝐞𝐦 𝐐𝟐
📊 𝐄𝐫𝐠𝐞𝐛𝐧𝐢𝐬𝐬𝐞
• Consolidated revenue: up more than 10% year-over-year
• Group EBIT: approximately €1.85B (vs. €1.43B, +29%)
• DHL Express EBIT: approximately €1.20B (vs. €730M)
• DHL Global Forwarding EBIT: approximately €240M (vs. €196M)
• DHL Supply Chain EBIT: approximately €305M (vs. €348M)
• DHL eCommerce EBIT: approximately €50M (vs. €56M)
• Mail & Parcel Germany EBIT: approximately €135M (vs. €166M)
⠀
🎯 𝐀𝐮𝐬𝐛𝐥𝐢𝐜𝐤
• Group EBIT for 2026 now expected to exceed €6.5B (previously: over €6.2B)
• DHL segments: EBIT now expected to exceed €5.9B (previously: over €5.6B)
• Forecast for Mail & Parcel Germany confirmed at over €900M EBIT
• Forecast for Group Functions confirmed at approximately -€400M
⠀
📌 Key Points
• Rising demand drove positive earnings momentum in the second quarter
• DHL Express benefited from higher transport weight and capacity constraints in the air freight market
• A reduced cost base resulting from the “Fit for Growth” program supported earnings growth
• The outlook was raised, assuming no further deterioration in the geopolitical environment
1212
2 Comentarios3Lun
Great beat and great title. I'm still hooked.
•
66
•

4Lun·
Opinion Sought - DHL Stock Program
Hello, through the employee program at $DHL (-0,71 %) you get a 15% discount on every share (no minimum holding period). However, you can invest a maximum of 300€ per quarter.
Example: €1,000.00 = €190.38 / 19% annual return (15% discount + dividends)
What do you think? Good, bad, or are there better alternatives?
Thanks, everyone! ☺️
1111
20 Comentarios
4Lun
A guaranteed return of 15–19% plus additional long-term growth is great.
But even here, I wouldn't put all my eggs in one basket.
But even here, I wouldn't put all my eggs in one basket.
•
1010
•
4Lun·
From Saxon savings roots to record cash flow: my review for May 2026
Step by step upwards! With an all-time high in passive income, the foundation for financial freedom is rock solid. 📈🏰
May proved how important stability is. Just like the historic walls of Albrechtsburg Castle in Meissen, which I visited, my portfolio is in a solid position after the recent rollercoaster ride, with the overall portfolio recording a solid gain of 2.42%.
On the markets, AI continues to drive tech stocks, while $CSCO (-4,25 %) the strong old economy backbone.
The 397 steps of the Spitzhaus staircase in Radebeul near Dresden are a perfect symbol of wealth accumulation. It takes perseverance and consistency. But investors are rewarded with a steadily increasing cash flow. Time for a look back!
DISCLAIMER/RISK WARNING
Please remember that this article is for entertainment purposes only. At no point is it a buy or sell recommendation or professional legal, tax or investment advice. Don't just copy anything I do. I am merely describing what is happening in my portfolios, but in no way guarantee that it is up-to-date, correct or complete.
Investing in the capital market is always associated with risks such as loss of invested capital, price fluctuations, liquidation risks or market risks. In accordance with the current guidelines of ESMA and BaFin, I expressly point out that this review serves exclusively to document my personal investment strategy and does not constitute investment advice within the meaning of the WpIG. The securities presented by me are expressly not to be understood as investment advicebut are merely components of my personal portfolio at the time of reporting. Please also bear in mind that there is a conflict of interest, as I naturally hold the securities mentioned myself.
If necessary, seek professional advice and do your own research.
Despite great care, there may be errors in the text or in the figures.
Overall performance
My key performance indicators for my overall portfolio at a glance:
- TTWROR (month under review): + 2.42 % (previous month: + 5.29 %)
- TTWROR (since inception): +95,36 %
- IZF (month under review): +32.45 % (previous month: +87.17 %)
- IZF (since inception): +12,39 %
- Delta: +2,426.37 €
- Absolute change: € +3,506.37
Data shown as "since inception" is valid since 31.05.2020
Performance & volume
The merry month of May had little impact on my tops and flops. They all moved a little, but hardly with recognizable strong trends. It is rather stocks from the solid middle that stand out with a stronger positive development, such as $CSCO (-4,25 %) , $QCOM (-7,5 %) or $TXN (-2,27 %) . All tech somewhere, but not the tech that we all think of first and foremost.
My problem children remain problem children, but they are all improving somehow. We are reducing the minus, especially with $NKE (+0,26 %) ; $CPB (+1,75 %) , $NOVO B (+2,56 %) and $DHR (-1,64 %) . I cannot see any clear reason other than a general recovery.
Largest single stock positions by volume in the overall portfolio:
Share (%) of total portfolio (and associated portfolio):
$AVGO (-2,31 %) 3.39 % (main share portfolio)
$GOOGL (+0 %) 1.67 % (main share portfolio)
$WMT (+1,31 %) 1.61 % (main share portfolio)
$CSCO (-4,25 %) 1.51 % (main share portfolio)
$FAST (-3,45 %) 1.32 % (main share portfolio)
Smallest individual share positions by volume in the overall portfolio:
Share (%) of the total portfolio (and associated securities account):
$GIS (+2,71 %) 0.39 % (main share portfolio)
$NOVO B (+2,56 %) 0.45 % (main share portfolio)
$EDM2 (-1,5 %) 0.45 % (main share portfolio)
$NKE (+0,26 %) 0.47 % (main share portfolio)
$DHR 0.56 % (main share portfolio)
Top-performing individual stocks
Shares with performance since initial purchase (%) (and the respective portfolio):
$AVGO (-2,31 %) : +450.94 % (main share portfolio)
$GOOGL (+0 %) +153.04 % (main share portfolio)
$CSCO (-4,25 %) +116.83 % (main share portfolio)
$WMT (+1,31 %) +91.59 % (main share portfolio)
$OHI (+0,38 %) +81.69 % (main share portfolio)
Flop performer individual stocks
Shares with performance since initial purchase (%) (and the respective portfolio):
$GIS (+2,71 %) : -46.94 % (main share portfolio)
$NKE (+0,26 %) -46.64 % (main share portfolio)
$CPB (+1,75 %) -40.13 % (main share portfolio)
$NOVO B (+2,56 %) -26.23 % (main share portfolio)
$DHR (-1,64 %) -24.28 % (main share portfolio)
Sector allocation of my individual stocks
My top 6 sectors are:
Consumer goods: 16.30% (previous month: 17.62%)
Technology: 16.09% [excluding information technology] (previous month: 16.60%)
Miscellaneous: 15.56 % (previous month: 16.60 %)
Financial sector: 11.30% (previous month: 11.39%)
Transportation: 9.67% (previous month: 9.13%)
Trade: 8.18 % (previous month: 7.50 %)
Asset allocation
Equities and ETFs currently determine my asset allocation, with ETFs growing steadily in recent months, which may be due to additional purchases.
ETFs: 43.4 % (previous month: 42.8 %)
Equities: 56.6 % (previous month: 57.2 %)
Investments and additional purchases
I have invested the following sums in savings plans:
Planned savings plan amount from the fixed net salary: € 1,080
Savings ratio of savings plans to fixed net salary: 50.60
Planned savings plan amount from the fixed net salary, incl. reinvested dividends according to plan size: € 1,200
In addition, there were the following additional investments from returns, refunds, cashback, etc. as one-off savings plans/repurchases:
Subsequent purchases/one-off savings plans as cashback annuities from refunds: € 0.00
Subsequent purchases/one-off savings plans as cashback annuities from bonuses: € 0.00
Subsequent purchases from other surpluses: € 185.21
Automatically reinvested dividends by the broker: € 5.47 (Function is only activated for an old custody account, as I otherwise prefer to control the reinvestment myself)
Number of unscheduled additional purchases: 5
Passive income from dividends and ETF distributions
Passive income in the month under review
I received € 272.14 in dividends and ETF distributions in the month under review (€ 163.38 in the same month of the previous year). This corresponds to a change of +66.57 % compared to the same month of the previous year.
Number of dividend payments and ETF distributions: 28
Number of payment days: 15 days
Average dividend per payment: € 9.72
average dividend per payment day: € 18.14
Passive income YTD
YTD I have received distributions in the amount of € 914.50. If you put this in relation to my annual dividend target of € 2,100, the target achievement of the distribution is 43.5 % (target 41.7 %). This means that after several months I am now back above the target, which also shows that we are now facing stronger months again.
The three calculation methods result in the following distribution yields:
YTD distribution yields: 0.98 %
Distribution yields since inception: 4.97 %
Distribution yields YoY: 2.31 %
The distribution yield YoY increased by 0.93%, while the relative fluctuation was 29.54%. This shows that the distribution is growing slightly, but nevertheless from a lower momentum, as the relative fluctuation was always lower in the previous months. We are therefore dealing with a surge, which traditionally characterizes May for me.
My top payers
The top 6 payers in the month under review were:
FIRE Number & Runway
Even though I don't want to sell shares later, I also calculate my FIRE number for comparability with investors who run an exclusively accumulating strategy.
My FIRE figure based on my 12-month spending (TTM) of €12,219.62 was €305,490.50 (previous month: €303,921.50).
That's the minimum amount my portfolio would need to reach to theoretically cover the expenses via a 4% withdrawal. And this figure has risen slightly.
Of course, this figure fluctuates every month. But it's not the only metric to determine how long my assets could support me in an emergency (without taking taxes into account).
The rolling spending range (runway) expresses how long I could live off my assets.
On an annual basis, this is currently 8.16 years (previous month 7.92 years). Compared to the previous month, it has fallen by 0.24 years increased. So I am effectively about quarter of a year more "free" due to the recovery from the current global political events.
Compared to the same month last year, this is an increase of 2.33 years years. I am still 16.84 years away from my runway target (25 years), which corresponds to the FIRE multiplier. 16.84 years away. So there is still a long way to go to financial freedom, assuming that everything continues as before.
The runway stability of 97.49% indicates that my system is solid despite the market turbulence. The proximity to 100% proves that the core of my strategy remains unaffected by the market.
Performance comparison: portfolio vs. benchmarks
To see where I really stand, I regularly compare my portfolio with the major market ETFs. This allows me to see immediately how well my performance (TTWROR) has done in the current month and since the start compared to the overall market.
My portfolio: +2.42 %
$VWRL: +5,97 %
$VUSA: +6.43 %
$IQQY: +3.22 %
I am lagging behind...
Risk figures
Here are my risk figures for the month under review:
Maximum drawdown:
In the month under review: 0.78
since start: 17.17 %
Maximum drawdown duration:
In the month under review: 8 days
since start: 702 days
Volatility:
In the month under review: 2.07
since inception: 28.74 %
Sharpe Ratio:
In the month under review: 13.77
since inception: 0.43
Semi-volatility:
In the month under review: 1.28
since inception: 21.31 %
The maximum drawdown in May of just 0.78 % shows that the dust has settled. While the previous months were still characterized by corrections, the impact in May remains minimal. The Sharpe ratio of a strong 13.77 underlines the excellent risk-adjusted performance in this growth phase.
With a volatility of 2.07% and a semi-volatility of 1.28%, the fluctuations are far below the historical average. This confirms once again that my system is stable. While the long-term values hardly move, I use the calm for my foundation. The focus remains on cash flow, while the risks remain absolutely controlled.
Outlook
I look back on the merry month of May with real satisfaction. Fresh capital flowed directly into the market, the foundation for passive income continues to grow and May delivered a new all-time high: EUR 272.14 in dividends and distributions show in black and white that perseverance pays off.
Privately, May was a real month of pleasure. The trips to Albrechtsburg Castle in Meissen and Wackerbarth Castle, including the Spitzhaustreppe in Radebeul near Dresden, were absolute highlights. The 397 steps of the Spitzhaustreppe made me realize something that I have long known from investing: it always goes up step by step. My running sessions and workouts are now so automated that my strength and endurance grow almost automatically, without any motivational debates.
I conclude this review with real serenity. When the foundation is right and the habits are in place, the market noise loses all its terror. If you build your foundation like a castle, you will not be distracted by any wind.
Thank you for reading. Onwards to June and upwards step by step! 🚀
👉 The review is also available as a YouTube video and as Instagram Carousel posts, which are published as follows:
06.06.2026: Depot review on Instagram (key performance indicators, share performance, allocation, sectors, additional purchases and performance comparisons)
07.06.2026: Budget review on Instagram (income, expenses, cash flow, ratios, budget compliance and citizen money check)
08.06.2026: Cash flow review on Instagram (general, YTD and actual vs. target comparison for passive income, my top spenders, FIRE figure and capital reach)
09.06.2026: consolidated monthly review on YouTube
📲 There are regular videos, shorts, reels and carousel posts on the topics of frugalism, mindset and investing under @frugalfreisein on Instagram and YouTube.
Please pay close attention to the spelling of my alias. Unfortunately, there are too many fake and phishing accounts on social media. I have already been "copied" several times.
