
Vanguard FTSE All-Wld Hgh Div Yld ETF D
Price
Discussion sur VHYL
Postes
306


No. 2: No sooner said than done
I made another purchase today$VHYL (+0,16 %) to keep boosting it. The goal is to maintain a good balance with the other ETFs, especially the $TDIV (+0,18 %) , so that both positions can grow naturally. The savings plan is in place, and I’ll be adding more next month as well.
Do you also have this ETF in your portfolio? If not, which dividend ETF do you rely on instead?
~ Rendite Rudin
#ETF
#VGHY
#TDIV
#Dividenden
#AssetAllocation
#Langzeitinvestor
#RenditeRudin

New ETFs in the Spotlight – Are You Betting on Asia? 🌏
I'd like to add a new ETF to my$VHYL (+0,16 %) portfolio. Now I'm considering adding two more ETFs: the $FYEQ (-1,56 %) and the $FGEQ (-0,16 %)
I find the inclusion of Asian markets particularly exciting. Of course—these regions aren’t among the absolute top performers right now. But I’m very curious to see what the future holds. If these countries experience strong growth in the coming years, I see enormous long-term potential there, despite all the current turmoil surrounding China and others.
Do you perhaps have these two ETFs in your portfolio, or do they not really fit into your strategy?
What’s your general take on this: Are you invested in Asia and emerging markets—whether through ETFs or even individual stocks? Or are you staying completely out of them?
I’m looking forward to hearing your opinions and strategies!
~ Rendite Rudin
#ETF
#Asien
#Schwellenländer
#vhyl
#FYEQ
#FGEQ
#AssetAllocation
#Langzeitinvestor
#RenditeRudin

Best regards from the “Pott,” Markus

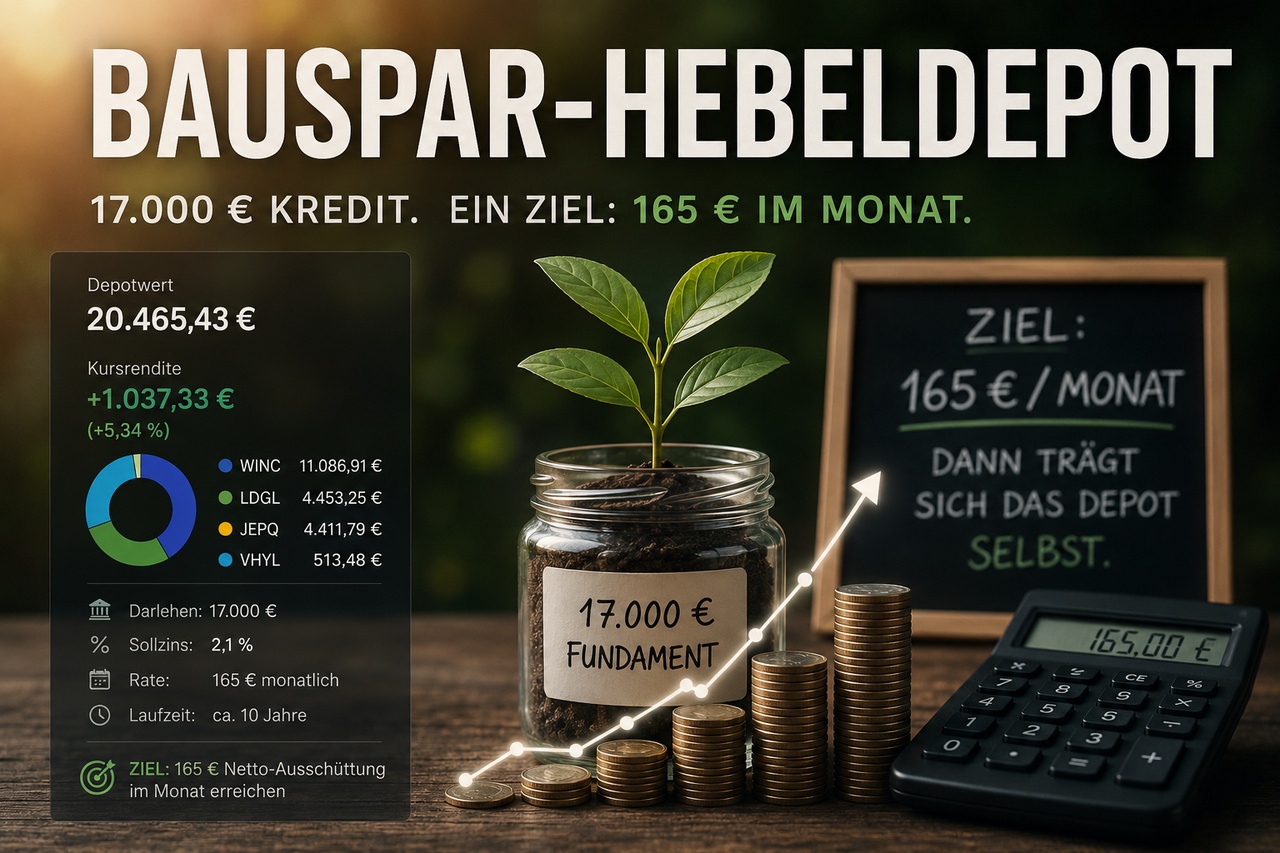
Update on my "Bausparer" portfolio
With all-time highs currently skyrocketing, I figured I’d share some positive news for a change
Less max yield—more growth
At the end of February, I started a separate portfolio that was originally funded by a home equity loan.
**Starting point:**
* Loan: €17,000
* Interest rate: 2.1%
* Monthly payment: €165
* Term: approx. 10 years
The basic idea is simple:
Build a portfolio that generates enough dividends over the long term to cover its own financing.
---
My status today
After just under four months, the portfolio currently looks like this:
💰 Portfolio value: **€20,465**
📈 Performance: **+€1,037 (+5.34%)**
Positions:
$WINC (-0,7 %) : €11,087
$LDGL (+0,67 %) : €4,453
$JEPQ (-1,73 %) : €4,412 (covers the loan interest perfectly)
$VHYL (+0,16 %) : €513
In addition, two savings plans are currently active:
* €250 monthly in WINC
* €250 monthly in VHYL
All dividends are reinvested.
---
## What has changed
The original portfolio consisted of:
* WINC
* JEPQ
* JEGP
After a few months, I sold the entire JEGP position and replaced it with the L&G Global Quality Dividends ETF.
Not because I think JEGP is a bad ETF.
On the contrary.
JEGP does exactly what it’s supposed to: deliver high ongoing dividends. But as many of us have noticed, unlike its counterpart on the Nasdaq, its price isn’t recovering at all.
However, it became clear to me relatively quickly that my goal isn’t to maximize dividends in the current year.
My goal is a portfolio that will still be growing in 10, 15, or 20 years, generating rising dividends.
That is why the portfolio today deliberately consists of a mix of:
* Cash Flow (JEPQ) to cover interest expenses
* High Income (WINC) to cover principal payments
* Quality dividends (LDGL) to build wealth
* Global dividend growth (VHYL) to build wealth
The actual idea behind the project
The original €17,000 forms the foundation for me.
This foundation is expanded month after month through:
* Savings plans
* Special payments
* Reinvested dividends
I do not measure success by a specific portfolio size.
The decisive milestone is:
➡️ €165 in net dividends per month.
Once the portfolio consistently generates this amount on its own, it will cover its own loan payments.
From that point on, it will be exciting to see how the system evolves under its own steam.
---
I’d be interested to know:
If your goal were not the maximum dividend today, but a long-term sustainable cash flow portfolio:
Would you have kept JEGP or also made the move toward quality dividends and dividend growth?

That’s how you beat interest rates and outperform them entirely through growth alone.

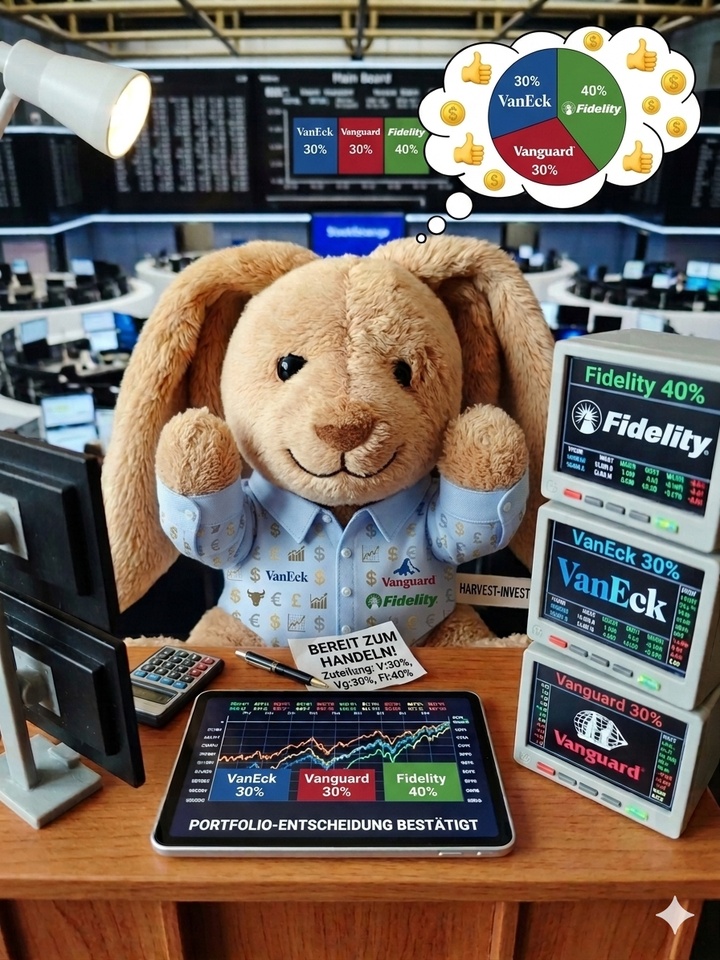
The decision on the ETF has been made!
Dear gq community,
First of all, thank you so much for the great discussion and tips, which really helped me make up my mind.
Here’s what I’ve decided:
$FYEQ (-1,56 %) 40%
$VHYL (+0,16 %) 30%
$TDIV (+0,18 %) 30%
Since I am no longer invested in EM at all, I reconsidered the suggestion regarding $FYEQ (-1,56 %) and found it very helpful, so I allocated the largest portion—40%—to that sector.
With the addition of the VanEck, I immediately sold several small European ETFs with an average gain of over 10%, thereby reallocating 30% of the total amount to $TDIV (+0,18 %) .
The $VHYL (+0,16 %) Vanguard fund has also received a 30% allocation, which allows me to cover the “world sector” holistically, so to speak, with a rock-solid investment.
I would like @BavarianLion
@Solitair
@NichtRelevant
@erbsinator and @Novius thank you all for the ideas and discussion, and of course a special carrot-sized thank you to @Raketentoni for his great analyses throughout the entire discussion!
Yours, Hase 🐰
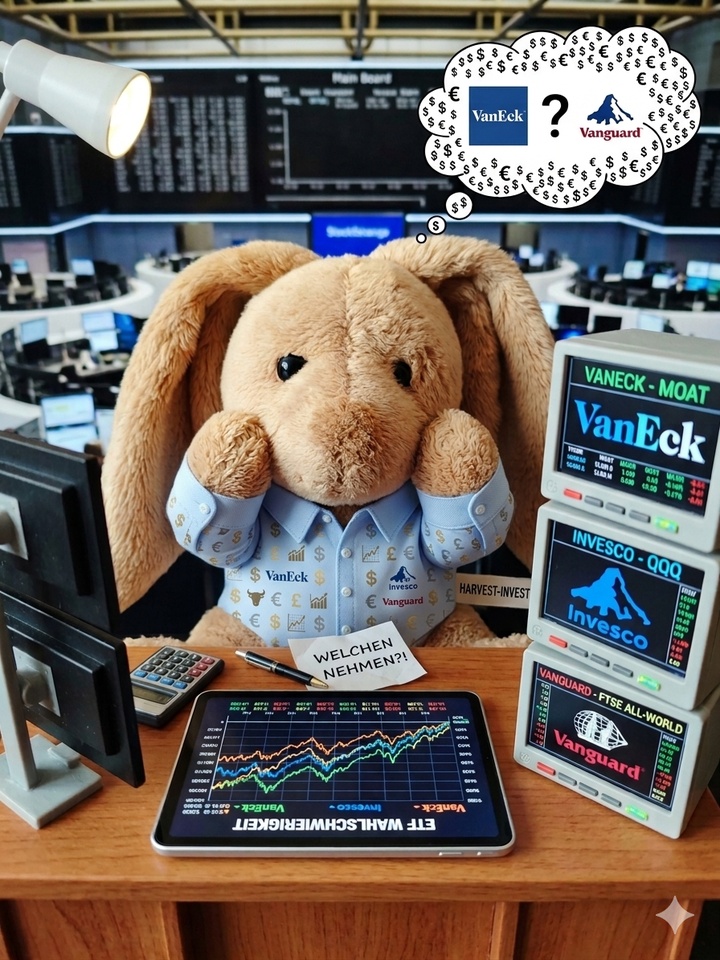
Dividend ETFs to choose from
Dear gq community,
I’ll have some funds available this week that I’d like to invest in a dividend ETF.
Whenever this topic comes up, the $TDIV (+0,18 %) is mentioned.
However, I’ve also identified two other ETFs that I’d like to put up for discussion, and I’d love to hear your pros and cons here.
The two additional dividend ETFs are, first, the $EQQQ (-1,28 %) and, secondly, the $VHYL (+0,16 %)
Here are a few figures:
Price performance
YTD
$TDIV (+0,18 %) 11.98%
$EQQQ (-1,28 %) 19.03%
$VHYL (+0,16 %) 14.52%
1 year
$TDIV (+0,18 %) 27.83%
$EQQQ (-1,28 %) 35.54%
$VHYL (+0,16 %) 26.92%
Dividend
Current
$TDIV 3.14%
$EQQQ 0.17%
$VHYL 2.36%
1 year
$TDIV (+0,18 %) 3.90%
$EQQQ (-1,28 %) 0.23%
$VHYL (+0,16 %) 3.03%
My assessment is therefore as follows:
VanEck offers the highest dividend, but currently lags slightly behind Vanguard in the charts. In the chart, Invesco is far ahead of both in terms of YTD and 1-year performance. However, the dividend there is very low.
However, if you balance the dividend against the price gains, you would still have to choose the Invesco $EQQQ (-1,28 %) .
I’d really appreciate your opinions, tips, and food for thought.
Your Hase🐰
@Dividendenopi
@Epi
@Multibagger
@Tenbagger2024
@Raketentoni
and, of course, everyone else who’s interested ♥️🥕
You’ve dug up some interesting figures for your spare change and broken them down very clearly. But let’s take a hard look at the data—and especially your final conclusion—because you’re mixing apples and oranges here.
Here’s the reality check for your decision-making:
**1. The elephant in the room: EQQQ is NOT a dividend ETF**
Right at the start, you write that your capital is supposed to flow into a “dividend ETF.” If that’s your real, strategic goal (regular cash flow), then the **Invesco EQQQ** has absolutely no place in this specific selection.
* The EQQQ tracks the Nasdaq-100. That is the ultimate U.S. tech growth engine, but not an income instrument.
* Your own data proves this mercilessly: The current dividend is a paltry 0.17%.
* Your conclusion to choose the EQQQ if one “offsets the dividend with capital gains” is, from a so-called “total return” perspective, entirely correct. However, this undermines your own goal of a dividend investment, as defined in the first sentence.
**2. The Real Showdown: TDIV vs. VHYL**
If we remove the tech outlier EQQQ, we’re left with the classic showdown between the dividend heavyweights:
* **VanEck ($TDIV):** As your figures correctly show, it delivers the highest dividend yield (currently 3.14% or 3.90% over 1 year). The TDIV applies very strict filters for dividend quality and sustainability, but focuses exclusively on established industrialized countries (developed markets).
* **Vanguard ($VHYL):** This is the global, stoic sledgehammer. It offers slightly lower dividends (currently 2.36% according to your data), but it also includes emerging markets and is extremely broadly diversified across the globe. It often doesn’t perform as dynamically as the TDIV, but it’s a massive rock in the storm.
**3. The Topic of Diversification**
* If you choose the **EQQQ**, you’ll have extreme concentration in the U.S. tech sector. This brings massive price gains in bull markets, but also brutal downward volatility when the tech sector takes a hit.
* In contrast, the **VHYL** offers you the ultimate global diversification in a single product.
* The **TDIV** is excellent for pure cash flow, but excludes pure growth stocks (since these often don’t pay high dividends).
**My tip and food for thought for you:**
Before buying, you need to make a cold, hard decision about what the *purpose* of this position in your portfolio should be:
1. **Do you want passive income and strong, reliable cash flow?** Then go with the **TDIV** for maximum returns or the **VHYL** for maximum global diversification.
2. **Do you want maximum capital growth (total return)?** Then go with **EQQQ** without hesitation. But then say goodbye to the idea that this is a “dividend investment.”
Choose the strategy, not just the past return figures!
Best regards!
Titres populaires
Meilleurs créateurs cette semaine