The dip dribbled out perfectly! With bonus and tax refund, it's now cash flow season. 📈⚽
April showed that consistency is not a fair-weather project. While I was standing in thick fog in Saxon Switzerland and couldn't see the valley from the top of the rocks because of the fog, the depots reflected the turnaround in performance for the better. As soon as the sun broke through, the gray gave way to a lush green.
After a turbulent March, I seized the opportunity when my employer paid out my half-year bonus. I hit the low point very well and dribbled out. Broadcom did exactly what it usually does with my shares: be the engine of growth. The road to freedom is a hike through all kinds of weather. Sometimes the wind whips up, sometimes you enjoy the sunset at Leipziger Völki.
The key is to stubbornly continue investing. Intel is the best example. Anyone who wrote off the share too early missed the turnaround. Unfortunately, I was never invested in Intel. In any case, I don't know the future in five years' time, but I am securing my cash flow today. Time for a look back.
DISCLAIMER/RISK WARNING
Please remember that this article is for entertainment purposes only. At no point is it a buy or sell recommendation or professional legal, tax or investment advice. Don't just copy anything I do. I am merely describing what is happening in my portfolios, but in no way guarantee that it is up-to-date, correct or complete.
Investing in the capital market is always associated with risks such as loss of invested capital, price fluctuations, liquidation risks or market risks. In accordance with the current guidelines of ESMA and BaFin, I expressly point out that this review serves exclusively to document my personal investment strategy and does not constitute investment advice within the meaning of the WpIG. The securities presented by me are expressly not to be understood as investment advicebut are merely components of my personal portfolio at the time of reporting. Please also bear in mind that there is a conflict of interest, as I naturally hold the securities myself.
If necessary, seek professional advice and do your own research.
Overall performance
Intel shows it again. Just keep a broad base and stay tuned. Then your portfolios will turn out to be a rock in the surf.
My key performance indicators for my overall portfolio at a glance:
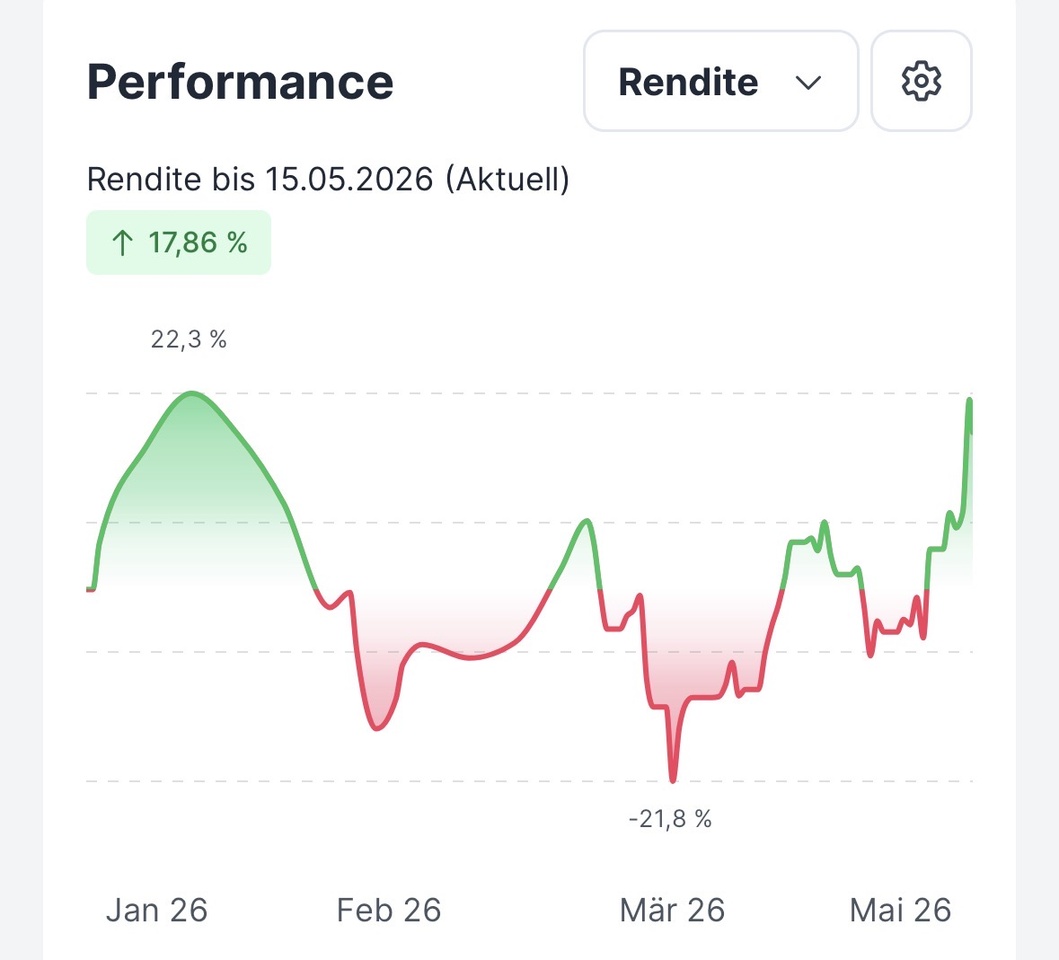
- TTWROR (month under review): + 5.29 % (previous month: -4.60 %)
- TTWROR (since inception): +88,98 %
- IZF (month under review): +87.17 % (previous month: -42.46 %)
- IZF (since inception): +11,49 %
- Delta: + € 4,935.78
- Absolute change: € +6,139.12
Data shown as "since inception" is valid since 31.05.2020
Performance & volume
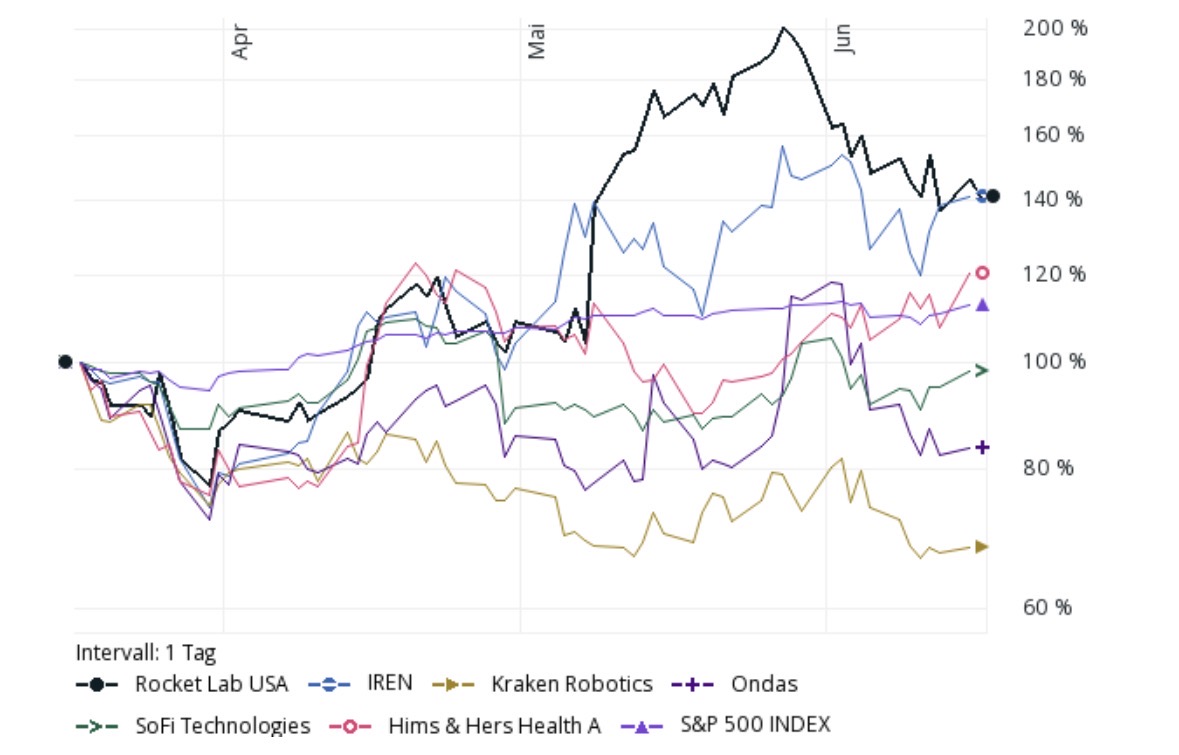
After the fog lifted in April, the true strength of my allocation became apparent. My top of the class $AVGO (+0,03 %) not only leads the green portfolio, but is actually marching ahead. In my top 5 $WMT (+0,07 %) and $GOOGL (+6,34 %) The $BAC, a stable financial anchor, moved back into the top group. Also $FAST (+1,98 %) underpins my strategy of solid industrial stocks with consistency.
The highlight is the run at $TGT (-0,16 %) My staying power is paying off massively, the minus has shrunk to just 8%. This is clear proof that discipline pays off in phases of weakness. Target seems to be regaining confidence through improved inventory management.
There are downsides to the current "problem children" $NKE (+0,08 %) , $GIS (-0,64 %) and $$CPB (-0,42 %) which are feeling the headwind. But as long as the dividends flow reliably, I remain relaxed. I invest for the stable cash flow that finances my freedom.
Largest individual share positions by volume in the overall portfolio:
Share (%) of total portfolio (and associated securities account):
$AVGO (+0,03 %) 3.26 % (main share portfolio)
$WMT (+0,07 %) 1.87 % (main share portfolio)
$GOOGL (+6,34 %) 1.67 % (main share portfolio)
$FAST (+1,98 %) 1.37 % (main share portfolio)
$BAC (-0,06 %) 1.35 % (main share portfolio)
$FDX (-0,02 %) 1.29 % (main share portfolio)
Smallest individual share positions by volume in the overall portfolio:
Share (%) of the total portfolio (and associated securities account):
$GIS (-0,64 %) : 0.40 % (main share portfolio)
$NOVO B (-8,33 %) 0.41 % (main share portfolio)
$NKE (+0,08 %) 0.44 % (main share portfolio)
$CPB (-0,42 %) 0.44 % (main share portfolio)
$DHR (-0,03 %) 0.55 % (main share portfolio)
Top-performing individual stocks
Shares with performance since initial purchase (%) (and the respective portfolio):
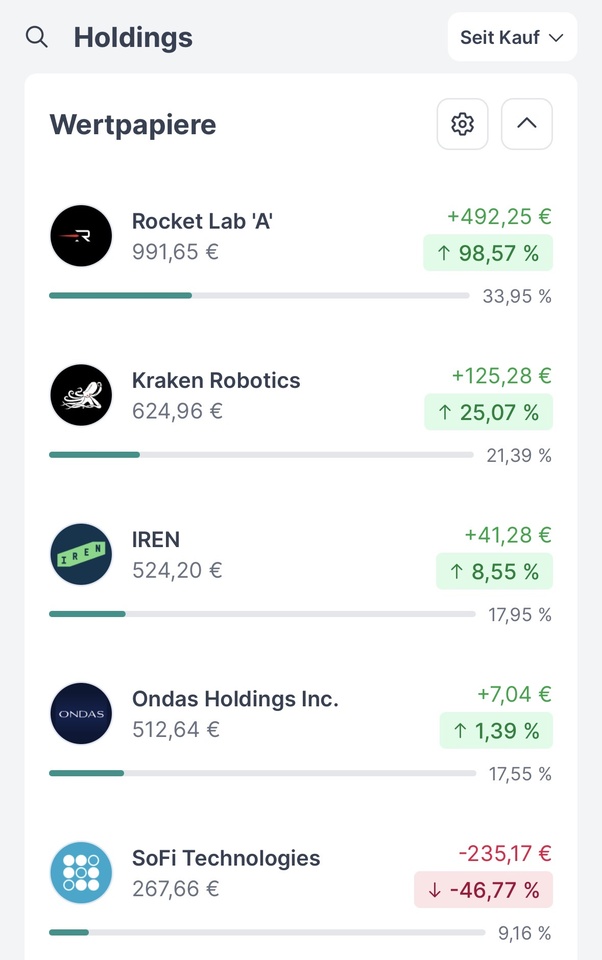
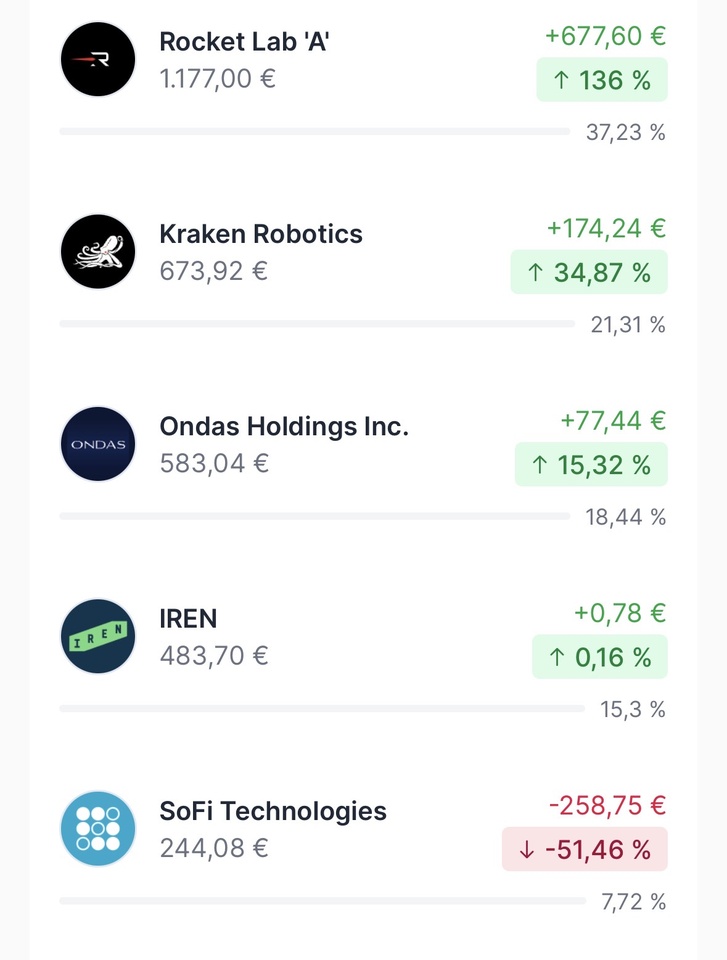
$AVGO (+0,03 %) : +380 % (main share portfolio)
$GOOGL (+6,34 %) +149 % (main share portfolio)
$WMT (+0,07 %) +118 % (main share portfolio)
$NFLX (-1,74 %) +93 % (main share portfolio)
$OHI (+0,55 %) : +82 % (main share portfolio)
Flop performer individual stocks
Shares with performance since initial purchase (%) (and the respective portfolio):
$NKE (+0,08 %) : -50 % (main share portfolio)
$GIS (-0,64 %) -47 % (main share portfolio)
$CPB (-0,42 %) : -43 % (main share portfolio)
$NOVO B (-8,33 %) -32 % (main share portfolio)
$DHR (-0,03 %) -27 % (main share portfolio)
Sector allocation of my individual stocks
My top 6 sectors are:
Consumer goods: 16.47% (previous month: 17.62%)
Miscellaneous: 16.40 % (previous month: 16.60 %)
Technology: 14.18 % [excluding information technology] (previous month: 12.07 %)
Financial sector: 11.55% (previous month: 11.39%)
Transportation: 9.57% (previous month: 9.13%)
Trade: 7.59% (previous month: 7.50%)
Asset allocation
Equities and ETFs currently determine my asset allocation, with ETFs growing steadily in recent months, which may be due to additional purchases.
ETFs: 42.8 % (previous month: 42.3 %)
Equities: 57.2 % (previous month: 57.7 %)
Investments and additional purchases
I have invested the following amounts in savings plans:
Planned savings plan amount from the fixed net salary: € 1,070
Savings ratio of savings plans to fixed net salary: 50.20
Planned savings plan amount from the fixed net salary, incl. reinvested dividends according to plan size: € 1,190
In addition, there were the following additional investments from returns, refunds, cashback, etc. as one-off savings plans/repurchases:
Repurchases/one-off savings plans as cashback annuities from refunds: € 85.00
Subsequent purchases/one-off savings plans as a cashback annuity from bonuses: € 774.97
Subsequent purchases from other surpluses: € 75.00
Automatically reinvested dividends by the broker: € 3.99 (Function is only activated for an old custody account, as I otherwise prefer to manage the reinvestment myself)
Number of unscheduled additional purchases: 7
Passive income from dividends and ETF distributions
Passive income in the month under review
I received € 192.02 in distributions in the month under review (€ 152.82 in the same month of the previous year). This corresponds to a change of +25.65 % compared to the same month last year. The growth can be explained to a small extent by the new positions in the crypto successor portfolio, the majority comes from continuous investing through savings plans, reinvestment of dividends and other surplus funds.
Number of dividend payments and ETF distributions: 33
Number of payment days: 13 days
Average dividend per payment: € 5.82
average dividend per payday: € 14.77
Passive income YTD
YTD I have received dividends in the amount of € 450.34. If you put this in relation to my annual dividend target of € 2,100, the target achievement of the distribution is 21.44% (target 25.00%). This puts me just below the target, but this will be reversed in the coming months with high dividend payments.
The three calculation methods result in the following distribution yields:
YTD distribution yields: 0.70%
Distribution yields since inception: 4.87 %
Distribution yields YoY: 2.25 %
The slightly falling distribution yield since inception and YoY shows the underpinning price increase. At 0.7% YTD, it shows that my asset accumulation is still comparatively a young project.
The distribution yield fell by 0.87% YoY, while the relative fluctuation was 21.88%. This shows that the distributions are constant, but still fluctuate quite strongly.
My top payers
The top 6 payers in the month under review were:
$VWRL (+0 %)
$VHYL (-0,52 %)
$ISPA (-0,51 %)
$HSBA (+0,29 %)
$VUSA (+0,38 %)
$GSK (-1,21 %)
FIRE Number & Runway
Even though I don't want to sell shares later, I also calculate my FIRE number for comparability with investors who run an exclusively accumulating strategy.
My FIRE figure based on my 12-month spending (TTM) of €12,156.86 was €303,921.50 (previous month: €305,512.00).
This is the minimum volume my portfolio would need to reach in order to theoretically cover the expenses via a 4% withdrawal. And this figure has fallen slightly.
Of course, this figure fluctuates every month. But it's not the only metric to determine how long my assets could support me in an emergency (without taking taxes into account).
The rolling spending range (runway) expresses how long I could live off my assets.
On an annual basis, this is currently 7.92 years (previous month 7.41 years) or the equivalent of around 94.98 months (previous month: 88.86 months). Compared to the previous month, it is 0.51 years increased.
So I am effectively about half a year more "free", due to the recovery from the current global political events.
Compared to the same month last year, this is an increase of 2.80 years is available. I am still 17.08 years away from my runway target (25 years), which corresponds to the FIRE multiplier. 17.08 years away. So there is still a long way to go to financial freedom, assuming that everything continues as before.
The runway stability of 97.46% indicates that my system is in a solid position despite the market turbulence. Although the price fluctuations have advanced my theoretical range by a minimal 0.51 years, the high stability ratio proves that the core of my strategy remains unaffected.
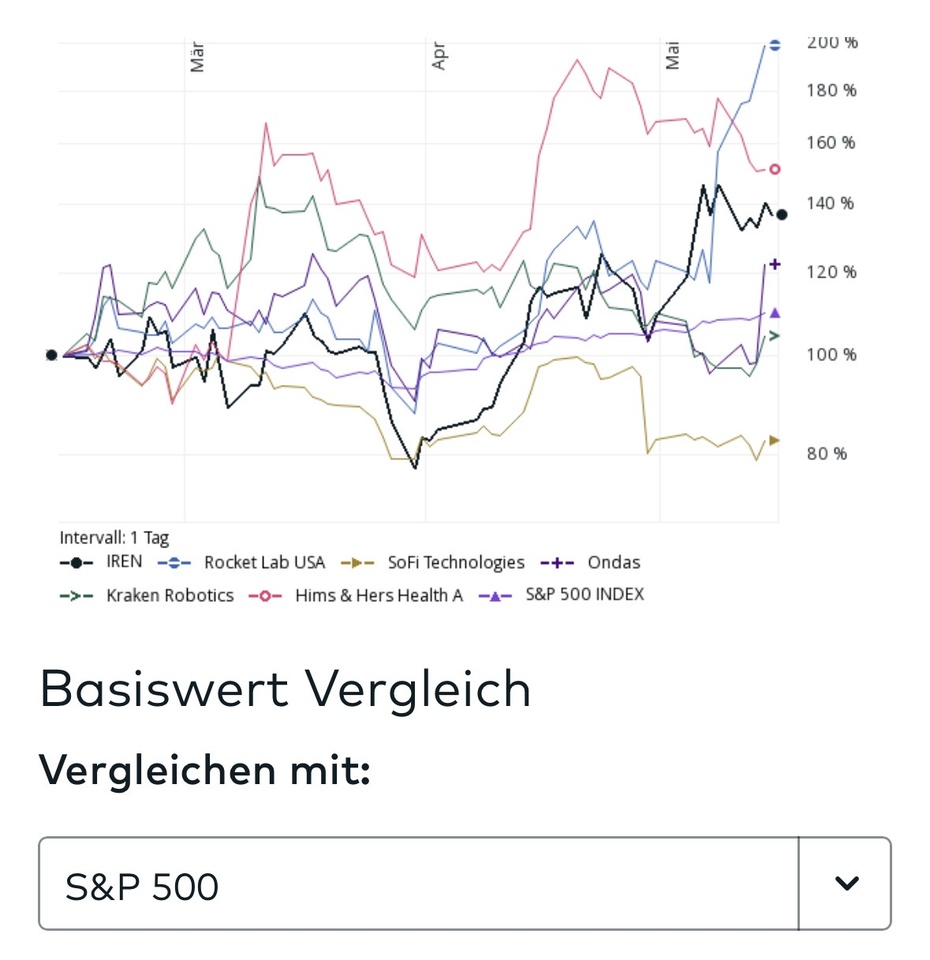
Performance comparison: portfolio vs. benchmarks
To see where I really stand, I regularly compare my portfolio with the major market ETFs. This allows me to see immediately how well my performance (TTWROR) has done in the current month and since the start compared to the overall market.
My portfolio: -4.60 % (since I started: +88.49 %)
$VWRL (+0 %) -5.55 % (since my start: 62.19 %)
$VUSA (+0,38 %) -4.05 % (since my start: 53.23 %)
$IMEU (-0,33 %) -6.87 % (since I started: 74.05 %)
Data shown as "since I started" is considered to be since 31.05.2020
Key risk figures
Here are my key risk figures for the month under review:
Maximum drawdown:
Since inception: 17.17 %
Month under review: 0.67
Maximum drawdown duration:
since inception: 702 days
Reporting month: 7+ days
Volatility:
since inception: 28.66
Month under review: 2.64 %
Sharpe Ratio:
since inception: 0.41
in the month under review: 41.68
Semi-volatility:
since inception: 21.26
Month under review: 1.59
The maximum drawdown in April of just 0.67 % clearly shows that the dust has settled. While March was still characterized by a correction, the impact in April was minimal. The Sharpe ratio of an impressive 41.68 in the month under review underlines the excellent risk-adjusted performance in this recovery phase.
With a monthly volatility of 2.64% and a semi-volatility of 1.59%, the fluctuations remain far below the historical average of over 28%. This confirms once again that my system is stable. While the long-term key figures are barely moving, I am using the calm to further consolidate my foundations. The focus remains on cash flow, while the risks remain absolutely controlled.
Outlook
After the implementation month of April, I look back with deep satisfaction. The employer bonus and the tax refund have been a real turbo boost for the market. I am extremely grateful for the opportunity to be able to fully invest such sums in order to massively broaden my passive income base.
Privately, April was the calm after the storm. A balanced month, characterized by stability and little hustle and bustle. Like hiking in Saxon Switzerland, the fog has lifted and allowed me to focus on the essentials. This calm is also reflected in my sport. My workouts and running sessions are now so ingrained, it's as if they've been automated. Without much motivational debate, I stubbornly and steadily follow my program, allowing my strength and endurance to grow almost automatically. And the words "stubborn" and "steady" are an important basic rule for us investors that we have internalized for investing. So you can see that these words dominate many areas of life.
I conclude this review with a feeling of serenity. When the foundation is right and the habits are in place, the noise on the markets loses its terror. Those who know their course will not be swayed by the wind.
Thank you for reading. Here's to May continuing to be a constant merry month! ☀️
👉 My related Instagram Carousel posts for the review will be published as follows:
08.05.2026: Portfolio review (Key performance indicators, share performance, allocation, sectors, additional purchases and performance comparisons)
09.05.2026: Budget review (Income, expenditure, cash flow, ratios, budget compliance and citizen's income check)
10.05.2026: Cash flow review (general, YTD and actual vs. target comparison of passive income, my top spenders, FIRE figure and capital reach)
📲 There you can find @frugalfreisein on Instagram and YouTube with regular videos, shorts, reels and carousel posts.
Please pay close attention to the spelling of my alias. Unfortunately, there are too many fake and phishing accounts on social media. I have already been "copied" several times.
👉 How do you personally feel the stock market year has started? (No investment advice!)