A quick note before we begin: I’ve significantly shortened the entire post to make it easier to read. Going forward, you’ll only be able to find some of the key metrics in my YouTube video or on Instagram. I’ve also completely removed the outlook section and the narrative text in between.
I hope you like the shorter version. 😊
I’ve had an eventful month! While things were relatively quiet on the markets, I was able to celebrate some real milestones in my passive income. My financial journey has been solid, calm, and steadily upward, just like hiking in Saxon Switzerland. When the foundation is right and your habits are in place, the daily market noise loses all its fear.
Here are the hard facts and all the key metrics from June:
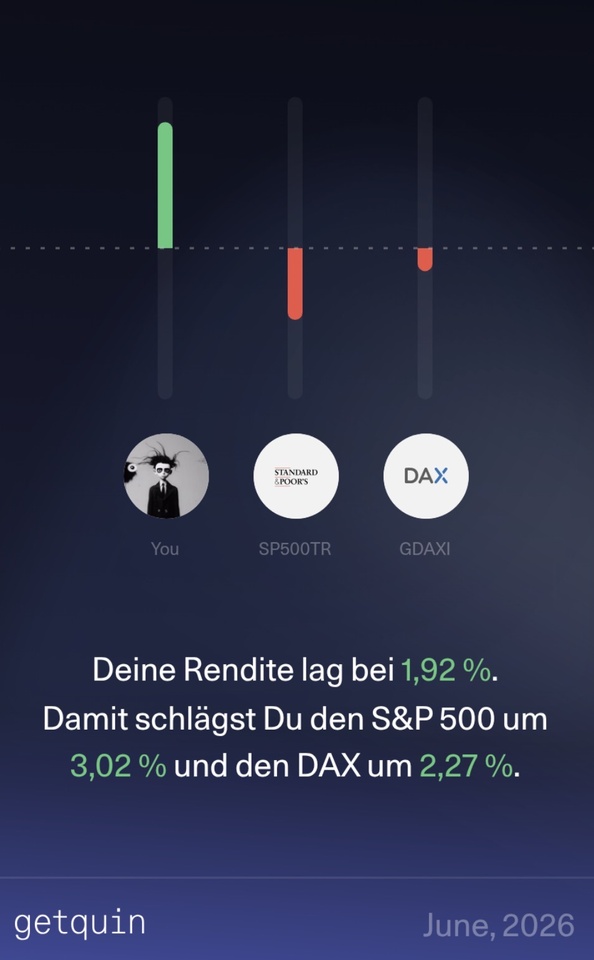
Portfolio Performance: Stable Returns & Beat the Benchmark 📈
Total performance (TTWROR):
+0.57% for the reporting month (96.80% since inception)
Internal Rate of Return (IRR):
+0.79% (+12.29% since inception)
Delta: A hefty gain of +778.41 €
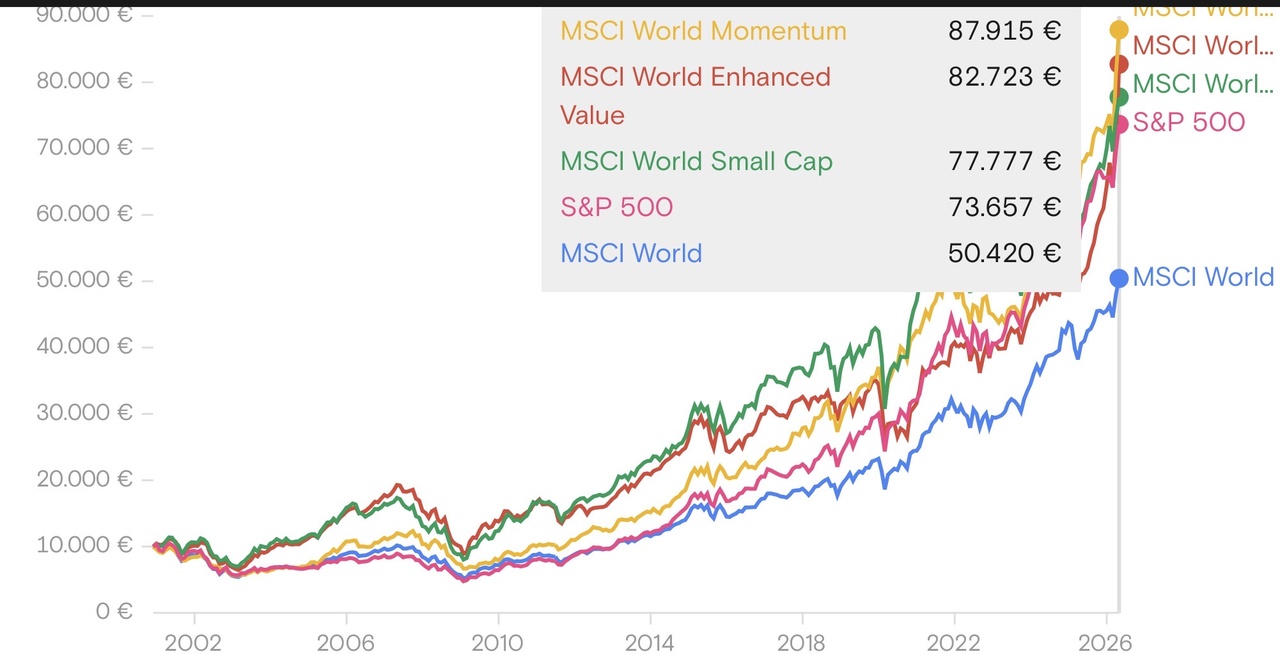
Benchmark comparison with the TTWROR of the following ETFs:
$VWRL (-0,21 %) : -0.33%
$VUSA (+0,01 %) : -0.41%
$IMEU (-0,25 %) : +3.22%
Largest individual stock positions by volume as a percentage of the total portfolio:
$AVGO (-3,4 %) : 2.78%
$WMT (+1,69 %) : 1.62%
$GOOGL (+0,55 %) : 1.54%
$CSCO (-3,75 %) : 1.50%
$FAST (+4,1 %) : 1.42%
Smallest individual stock positions by volume as a percentage of the total portfolio:
$GIS (+4,58 %) : 0.43%
$NKE (+3,56 %) : 0.43%
$NOVO B (+2,13 %) : 0.49%
$CPB (+3,45 %) : 0.49%
$BATS (+3,7 %) : 0.57%
Top-performing individual stocks
$AVGO (-3,4 %) : +332.73%
$GOOGL (+0,55 %) : +134.74%
$CSCO (-3,75 %) : +115.98%
$WMT (+1,69 %) : +94.59%
$OHI (+3,08 %) : +88.06%
Worst-Performing Individual Stocks
$NKE (+3,56 %) : -50.39%
$GIS (+4,58 %) : -47.00%
$CPB (+3,45 %) : -36.10%
$NOVO B (+2,13 %) : -20.48%
$DHR (+2,34 %) : -18.41%
Asset Allocation
ETFs and stocks are not quite balanced yet.
ETFs: 43.7% (previous month: 43.4%)
Stocks: 56.3% (previous month: 56.6%)
Investments and Additional Purchases
Planned savings plan amount from fixed net salary: €1,080
Savings rate of the savings plans as a percentage of fixed net salary: 50.60%
Planned savings plan amount from fixed net salary, including reinvested dividends based on plan size: 1,200 €
Additional purchases from various sources: €392.83. This is offset by sales of €286.36 this month (portfolio rebalancing $FDXF (+3,57 %) into $FDX (+1,28 %) ).
Passive income from dividends and ETF distributions
Dividends and ETF distributions: €174.33 (€152.30 in the same month last year
Change from the same month last year: +14.46%
YTD dividends and ETF distributions: €1,088.83
Annual target: €2,100
Target achievement: 51.85% (Target: 50.00%)
Risk Metrics
Maximum drawdown in the reporting month: 1.15%, since inception: 17.17%
Maximum drawdown duration in the reporting month: 10 days; since inception: 702 days
Volatility in the reporting month: 1.72%; since inception: 28.79%
Sharpe Ratio, for the reporting month: 5.53, since inception: 0.42
Semivolatility, for the reporting month: 1.01%, since inception: 21.33%
Thank you for reading. 🚀
Now please leave me a comment. Is this summary helpful? Is there anything you think is missing? Let me know.
👉 This review is also available as a YouTube video and as Instagram carousel posts, which will be published as follows:
July 8, 2026: Portfolio review on Instagram (performance metrics, stock performance, allocation, sectors, additional purchases, and performance comparisons)
July 9, 2026: Budget review on Instagram (income, expenses, cash flow, ratios, budget adherence, and basic income check)
July 10, 2026: Cash flow review on Instagram (overview, YTD, and actual vs. target comparison for passive income, my top dividend payers, FIRE number, and capital reach)
Sometime during Week 28: Consolidated monthly review on YouTube
📲 You can find regular videos, Shorts, Reels, and carousel posts on the topics of frugalism, mindset, and investing at @frugalfreisein on Instagram and YouTube.
Please pay close attention to the spelling of my alias. Unfortunately, there are too many fake and phishing accounts on social media. I’ve already been “copied” several times.